
CNAP HD: Noninvasive Hemodynamic Monitoring in Research

Cardiac Output (CNCO® ) and further essential hemodynamic parameters calculated from the continuous non-invasive arterial pressure curve (CNAP®) by means of the Pulse Contour Analysis shows high accuracy and high trending ability (precision) compared to invasive clinical standards (e.g. thermodilution and PiCCO) with valuable benefit for scientific and clinical research.

By Dr. Jürgen Fortin, CEO, CNSystems

Pulse Contour Analysis (PCA) for deriving complete Hemodynamics from continuous blood pressure wave (CNAP)

Pulse Contour Analysis (PCA)[1] derives important physiological information on preload, contractility, afterload and compliance of the heart from the well validated CNAP® Continuous Noninvasive Arterial Pressure Curve[2],[3]. By adding biometric patient data Stroke Volume (SV) and therefrom Continuous Noninvasive Cardiac Output (CNCO®), both essential hemodynamic markers, are calculated. Further hemodynamic parameters such as Systemic Vascular Resistance (SVR) as well as all indexed values SI, CI or SVRI are derived completing the hemodynamic picture.

Validation: CNCO® is clinically validated against invasive methods

Non-invasive continuous CNCO® is the non-invasive continuous cardiac output calculated from CNAP® Arterial Pressure as described above.

Accuracy of CNCO® compared to clinical standards such as invasive thermodilution (TD) or PiCCO is expressed as percentage error. In 1999, Critchley and Critchley suggested a percentage error of 30% or less[4]. In clinical practice, however, percentage errors of 40-45% are more realistic for the interchangeability between two CO-measurement methods (meta-analysis by Peyton and Chong[5]).

Trending ability is the precise tracking of changes in CO. According to Critchley, Lee and Ho, reliable trending ability[6] is indicated by concordance rates of > 90%. Vincent and colleagues state that following hemodynamic trends may be more important than absolute values[7].

CNCO® shows both high accuracy as well as high trending ability (precision) compared to the invasive clinical standards thermodilution and PiCCO fulfilling all Critchley criteria:

Bland-Altman plots show

  • Small bias and narrow limits of agreement
  • Percentage errors ≤ 30% (according to strict Critchley standard [8],[9])
  • Concordance rates ≥ 90% (according to standard [10])

Read more on CNAP accuracy here and here.

Benefit of continuous BP, CO & SVR in research (examples)

Blood pressure, cardiac output and vascular resistance are used to differentiate between challenge and threat states (positive and negative stress)[11],[12] and to quantify emotional response[13] in psychophysiological studies. A challenging situation causes a far bigger rise in cardiac output than a threating state. Total peripheral resistance rises in threat state but shows strong decrease in the challenging situation.

CNCO® is available with the CNAP® HD feature, currently only available in Europe.

For more information on CNAP, to include references to studies and research and plots, click here.

[1] https://en.wikipedia.org/wiki/Cardiac_output#Pulse_Pressure_methods
[2] Jeleazcov C et. al. Precision and accuracy of a new device (CNAP®) for continuous noninvasive arterial blood pressure monitoring: assessment during general anaesthesia. BJA. 2010; 105(3):264-272
[3] Biais, M. et. al. Continuous non-invasive arterial pressure measurement: Evaluation of CNAPTM device during vascular surgery Ann Fr Anesthesia
[4] Critchley, L. A., & Critchley, J. A. (1999). A meta-analysis of studies using bias and precision statistics to compare cardiac output measurement techniques. Journal of clinical monitoring and computing, 15(2), 85–91
[5] Peyton PJ, Chong SW: Minimally invasive measurement of cardiac output during surgery and critical care. Anesthesiology 2010; 113:1220-35

[6] Critchley LA, Lee A, Ho AMH: A critical review of the ability of continuous cardiac output monitors to measure trends in cardiac output. Anesth Analg 2010; 111:1180-92.

[7] Vincent JL et al.: Clinical review: Update on hemodynamic monitoring – a consensus of 16. Critical Care 2011, 15:229.

[8] Critchley, L. A., & Critchley, J. A. (1999). A meta-analysis of studies using bias and precision statistics to compare cardiac output measurement techniques. Journal of clinical monitoring and computing, 15(2), 85–91

[9] Peyton PJ, Chong SW: Minimally invasive measurement of cardiac output during surgery and critical care. Anesthesiology 2010; 113:1220-35.

[10] Critchley LA, Lee A, Ho AMH: A critical review of the ability of continuous cardiac output monitors to measure trends in cardiac output. Anesth Analg 2010; 111:1180-92.

[11] Kirby, L. D., & Wright, R. A. (2003). Cardiovascular correlates of challenge and threat appraisals: A critical examination of the Biopsychosocial Analysis. Personality and Social Psychology Bulletin, 7, 216-233.

[12] Tomaka, J., Blascovich, J., Kelsey, R. M., & Leitten, C. L. (1993). Subjective, physiological, and behavioral effects of threat and challenge appraisal. Journal of Personality and Social Psychology, 65, 248-260.

[13] Lackner, H. K., Weiss, E. M., Schulter, G., Hinghofer-Szalkay, H., Samson, A. C., & Papousek, I. (2013). I got it! Transient Cardiovascular Response to the Perception of Humor. Biological Psychology, 93, 33–40.

For more information on BIOPAC’s Noninvasive Blood Pressure monitoring and measurement systems and advanced functionality in the area of cardiovascular hemodynamics, to include CNAP noninvasive blood pressure systems, visit BIOPAC’s NIBP page or view BIOPAC’s NIBP amplifiers (MRI and small animal applications are also supported) and related equipment for a wide variety of research applications.

BIOPAC Systems, Inc. provides life science researchers and educators with data acquisition and analysis systems that inspire people and enable greater discovery about life.  Visit us at www.biopac.com.

Electrodermal Activity (EDA)

Typically, EDA is measured as skin conductance and a small direct constant voltage (0.5 vdc) is used as excitation source across the skin electrodes.

By Alan Macy, BIOPAC Systems, Inc.

Electrodermal activity measurement is subject to electrically-related characteristics of the skin. There are two phenomena associated with this type of skin activity. One is skin potential, which is a self-generated potential intrinsic to the skin. This potential is a consequence associated with dissimilar skin layers placed in proximity coupled with the presence and movement of interstitial fluids. An evoked skin potential response is called the sympathetic skin response. This change in skin potential can be evoked by electrical, auditory or magnetic stimulation. The other phenomenon associated with skin electrical activity can be measured when a stimulation (excitation) current is injected through, or a voltage is applied across, attached skin electrodes. The current or voltage stimulation is typically at constant (DC) level, or at low frequency, because the skin impedance is high. The application of excitation current or voltage produces a corresponding voltage or current, respectively, that changes over time subject to physiological state. In these cases, the skin’s resistance, impedance, conductance or admittance is being measured, corresponding to the type of electrical stimulation used.

EDA Measurements – subject to electrical excitation type:

Skin Resistance – Direct Constant Current (not commonly used)

Skin Conductance – Direct Constant Voltage (most commonly used)

Skin Impedance – Alternating Constant Current (not commonly used)

Skin Admittance – Alternating Constant Voltage (sometimes used)

Typically, EDA is measured as skin conductance and a small direct constant voltage (0.5 vdc) is used as excitation source across the skin electrodes. The skin admittance method (alternating constant voltage excitation) may provide some advantages in measurement in that this method does not polarize the skin electrodes during EDA recording. Skin conductance is usually measured in units of “Siemens” although sometimes “mho” is used. The unit “mho” comes from the reverse spelling of “ohm”, the unit of resistance. One mho equals one Siemen.  The conductivity of the skin is small, so values are given in microsiemens (uS) or micromhos (umho).

Changes in the electrically-related characteristics of the skin is correlated to eccrine sweat gland activity. Eccrine glands are in nearly all skin locations and are found, in highest concentrations, on the palms of hands, fingertips and soles of the feet. EDA, measured as skin conductance, is a physiological signal that indicates increased sympathetic nervous system (SNS) activity. This aspect of EDA is representative of changes in the electrical conductance of the skin due to eccrine (sweat) gland activity. SNS activity increases sweat gland secretions. Eccrine glands only receive activation signals from the SNS, so increased EDA is an indicator of increased arousal.

There are two aspects to skin conductance measurements, namely phasic and tonic. Tonic value is the average skin conductance level (SCL), that is relatively consistent over time, and is related to arousal. The phasic component  of skin conductance is the change of the skin conductance, over a short time period, in reaction to a stimulus. For a skin conductance response (SCR), the skin conductance rises in a short time period and then returns to tonic levels. SCRs are characterized by four different parameters: the response peak amplitude, latency of response, rise time to the response peak, and recovery time after peak.

For more information on BIOPAC’s EDA research solutions, including real-time live raw EDA data as well as real-time filtering or calculation channels including High-pass filtered/AC Coupled EDA, visit BIOPAC’s EDA Analysis page or view BIOPAC’s full line of electrodes, amplifiers, and wearable, wireless transmitters and loggers.

Additionally, a link to a recently updated EDA SCR Analysis Guide for Psychological Experiments came be found here.

BIOPAC Systems, Inc. provides life science researchers and educators with data acquisition and analysis systems that inspire people and enable greater discovery about life.  Visit us at www.biopac.com.

CNAP Noninvasive Blood Pressure Technology – An Overview

The interaction of an easy-to-use finger sensor with unique control loops and algorithms as well as with NBP provides high accuracy of the BP signal – equivalent to invasive arterial line.

By Dr. Jürgen Fortin, CEO, CNSystems

Continuous noninvasive arterial blood pressure measurement (CNAP®) is the technique for measuring blood pressure (BP) that is, as the title describes, both continuous and noninvasive. CNAP combines the advantages of the following two clinical “gold standards:” it measures blood pressure (BP) continuously in real time like the invasive arterial catheter system (IBP) and it is noninvasive, like the standard upper arm sphygmomanometer (NBP).

The CNAP principle is the intelligent interaction and synergy of IP-protected features and functions based on the well-known Vascular Unloading Principle by Penaz (with significant improvement over the past 15 years) [1], on unique control algorithms (e.g. VERIFI) [2] and on calibration mechanisms, making it a reliable and accurate method with results comparable to the intra-arterial measurement.

Pulsating blood flow detected by infrared light sensors is kept constant by the counter pressure exerted on the artery through inflating or deflating the integrated cuff. The resulting pressure in the finger sensor corresponds to the real arterial pressure [1]. The pressure system is controlled by multiple digital feedback loops. The “VERIFI-algorithm” is used for high fidelity signal processing and artifact rejection. This is a superior method for filtering vasomotoric influences, in contrast to Standard methods based on Vascular Unloading Principle, which can show false BP shifts due to influence of vasomotoric tone.

In terms of calibration, CNAP is the only available technology calibrating to directly measured upper arm values, providing blood pressure variations in absolute values at heart-level. The interaction of finger sensor with NBP provides high accuracy of the BP signal – equivalent to invasive arterial line.

Use of CNAP provides researchers with several benefits, including: 

  •  NBP Cuff – Automated scaling to brachial pressure (gold standard) at start of measurement and user programmable
  • Double finger sensor – Quick and error-free application
  • Continuous waveform – Continuous tracing of hemodynamic changes without interruptions to recalibrate; beat-to-beat systolic, diastolic, mean BP values
  • Connectivity – Plug-and-play integration into all common data acquisition systems and patient monitors
  • Data storage and analysis – Unlimited data storage via USB interface. Data format (*.csv) for import into all common data analysis software packages (e.g. BIOPAC’s AcqKnowledge®, Matlab, MS Excel, SPSS, etc.)
  • Accuracy – Reliably equivalent to invasive blood pressure (IBP) [3], [4]

Notes:

[1]  Jan Penaz, Brno, Czech Republic 1973.

[2]  Fortin J et al.: Continuous non-invasive blood pressure monitoring using concentrically interlocking control loops. Comput in BiolMed 36 (2006) 941 – 957.

[3]  Jeleazcov C et. al. Precision and accuracy of a new device (CNAP) for continuous noninvasive arterial blood pressure monitoring: assessment during general anaesthesia. BJA. 2010; 105(3):264-272.

[4]Biais, M. et. al. Continuous non-invasive arterial pressure measurement: Evaluation of CNAP device during vascular surgery Ann Fr Anesthesia.

Studies documenting the CNAP device’s performance can be found below:

Arterial stiffness is higher in older adults with increased perceived fatigue and fatigability during walking

Does conscious intention to perform a motor act depend on slow cardiovascular rhythms?

The Effect of Mainstream Media on Body Image and Stress Reactivity in Latina Females

For more information on BIOPAC’s Noninvasive Blood Pressure monitoring and measurement and cardiology research solutions, to include CNAP noninvasive blood pressure systems, visit BIOPAC’s NIBP page or view BIOPAC’s NIBP amplifiers (MRI and small animal applications are also supported) and related equipment for a wide variety of research applications.

BIOPAC Systems, Inc. provides life science researchers and educators with data acquisition and analysis systems that inspire people and enable greater discovery about life.  Visit us at www.biopac.com.
Practical Tips for Recording Physiological Data in MRI

The MRI system incorporates a VERY strong magnetic field and both emits and records radio frequency (RF) energy. This has impacts on subject and experimenter safety and on data accuracy.

By Alan Macy, BIOPAC Systems, Inc.

When recording physiological signals from subjects in MRI systems, two issues are very important:

  1. The MRI system incorporates a VERY strong magnetic field. It is extremely important that no significant magnetically susceptible objects are taken into the room that houses the MRI System.  All materials have some degree of magnetic susceptibility. However, materials with mass magnetic susceptibility values, similar to or have magnitude less than that of water (-0.91E-8 m^3/kg), are typically permitted to be used in the vicinity of MRI Systems. No electrodes, electrode leads, transducers or cabling, that contain significant magnetically susceptible components, should be used when recording data from a subject in the MRI.
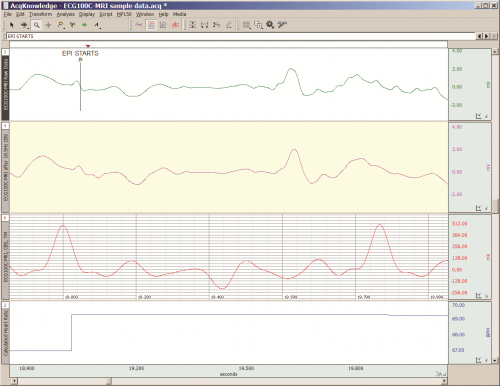
  2. The MRI System both emits and records radio frequency (RF) energy. This energy is typically in the range of 5 to 500 MHz. For a 3T MRI, the characteristic proton precession frequency will be 3T * 42.7 MHz or 128.1 MHz.  MRI generated RF energy will, at least, partially reflect from encountered conductors and induce current flow in those conductors. Signal reflections and induced currents can disrupt sensitive imaging operations by creating signal artifacts. Also, RF induced currents, if not properly controlled, can cause local heating.

Care must be taken to limit the flow of RF energy both in and out of the room that houses the MRI. RF energy from the MRI superimposes with the very small biopotentials and transducer signals in the vicinity of the subject. Alternatively, RF energy from recording or other equipment in the MRI Control Room (e.g. digital clocks and power supply switching noise) can leak into the MRI chamber, via subject cabling, and cause degradation of the image created by the MRI. It can be complicated to record biopotentials, from a subject’s body, during an MRI scan. These signals are very tiny and the RF energy, and associated magnetic field shifting, generated by the MRI corrupts the recording. Accordingly, successful biopotential recording in the MRI involves the use of specialized amplifiers, optimized cabling, patch-panel filtering, advanced signal processing and/or synchronization with MRI scanning processes to perform clean measurements.

When RF energy is pulsed into the subject, this energy spreads throughout the subject because the subject is a volume conductor. As the MRI magnetic gradient shifts in synchrony with RF energy pulsing, the gradient shift induces a current flow in conductors that intersect with the field. From a practical standpoint, RF energy pulsing and gradient-induced current flows often manifest themselves as repetitive artifact signals directly in the band of the physiological generated biopotentials. This is because RF energy pulsing and magnetic field gradient switching are performed synchronously for imaging and the repetition rates for image slice generation usually fall within the range of 1-100 Hz. Depending upon the biopotential frequency range (from lowest to highest: EGG, EOG, ECG, EEG and EMG), different amplification and signal processing techniques can be used to isolate the signal of interest. Furthermore, it’s often helpful to control imaging processes so that the MRI artifact signal spectrum does not unduly impact the measured physiological signal spectrum.

For more information on BIOPAC’s MR Safe and MR Conditional solutions, visit BIOPAC’s MRI page or view BIOPAC’s full line of electrodes, amplifiers, and wearable, wireless transmitters and loggers.

Download a related and important application note that describes the relationship between MRI imaging sequences and associated physiological measurements, when subjects are monitored in the MRI. In particular, this note addresses newfound insights on the impact that imaging sequence types have upon simultaneously recorded electrocardiography (ECG) and impedance cardiography (ICG) subject measurements.

BIOPAC Systems, Inc. provides life science researchers and educators with data acquisition and analysis systems that inspire people and enable greater discovery about life.  Visit us at www.biopac.com.

Signal Artifact Associated with MRI

By Alan Macy, BIOPAC Systems, Inc.

When performing MRI and simultaneously recording time-series physiological data, there are two basic types of artifact associated with MRI processes. The first type of artifact is associated with the presence of the large constant MRI magnetic field.  This type of artifact is typically called “magnetohydrodynamic effect” (MHD). MHD artifact results from movement of conductive fluid (blood) and from the movement of charge inside the body, when exposed to a magnetic field. A motional electromotive force (Vemf) is generated when a conductor moves through a magnetic field. Also, a charge moving in a magnetic field may have its travel path affected by the field. This two phenomenon can distort, and superimpose with, an existing biopotential signal. The most prominent MHD effects occur in the vicinity of the heart. The aortic arch is aligned perpendicularly to the MRI magnetic field and this geometry is conducive to creating large magnitude MHD artifacts in the ECG signal. Aortic blood flow is highest during systole, which corresponds to the ST segment in the ECG signal, so the largest MHD artifacts occur during this period. MHD effects are easily seen when measuring ECG inside the MRI, even when scanning is off. In this situation, the ECG signal will usually distort to the point of being non-diagnostic, such as lengthening QRS time and increasing T-wave amplitude.

The second type of artifact is associated with the time-based scanning processes occurring within the MRI. During scanning, two sources generate artifacts during biopotential measurements in the MRI. The first source is associated with magnetic field gradient switching during EPI or other scanning sequence. As the magnetic field changes orientation with respect to the biopotential electrode lead-subject-amplifier loop, a current is induced in the loop. The magnitude of induced current is proportionally linked to the loop area and number of turns in the loop. The second source is associated with radio-frequency (RF) pulsing coincident with gradient switching during the scanning sequence.  The RF is at the Larmor frequency and couples to the biopotential loop conductors, which include electrodes, electrode leads and subject. RF energy can circulate in this loop because the biopotential signal conductors will travel through the cable harness to the patch panel connectors separating chamber room from control room. RF energy will couple throughout the cabling harness due to distributed capacitance in the cable, thus establishing an RF conducting loop that includes subject, electrodes, electrode leads and distributed capacitance in cable harness.

For more information on BIOPAC’s MR Safe and MR Conditional solutions, visit BIOPAC’s MRI page or view BIOPAC’s full line of electrodes, amplifiers, and wearable, wireless transmitters and loggers.

Download a related and important application note that describes the relationship between MRI imaging sequences and associated physiological measurements, when subjects are monitored in the MRI. In particular, this note addresses newfound insights on the impact that imaging sequence types have upon simultaneously recorded electrocardiography (ECG) and impedance cardiography (ICG) subject measurements.

BIOPAC Systems, Inc. provides life science researchers and educators with data acquisition and analysis systems that inspire people and enable greater discovery about life.  Visit us at www.biopac.com.

Impedance Cardiography

By Alan Macy, BIOPAC Systems, Inc.

ICG is a measurement method that is primarily used to determine aspects of Cardiac Output (CO).   CO is the total amount of blood, pumped from both the left and right ventricles of the heart for each of its successive systolic phases, over the course of one minute.  The systolic phase, or systole, is when the heart muscle contracts and pumps blood from the chambers (left and right ventricles) into the arteries.  Typical resting cardiac output is 4.9 liters/minute for an adult human female and 5.6 liters/min for an adult human male.

Left ventricular cardiac output is the CO from the left ventricle only and can be estimated via a non-invasive technique called Impedance Cardiography (ICG), which provides an approximation of Stroke Volume (SV).  If SV and Heart Rate (HR) are known, then CO can be determined by:


SV * HR = Cardiac Output


ICG is measured by introducing a constant current (I) through the thoracic volume and then measuring the resulting voltage (V).   The following equation is used to determine thoracic impedance (Z).

 Z = V/I

 Where V and I are the root mean square (rms) values of the measured voltage and supplied (known) current.  ICG systems induce a constant magnitude, alternating current (I) through the thorax via electrodes.  A separate set of electrodes (placed between the current electrodes) monitor the voltage (V) developed across the thorax.  Because the magnitude of I is constant, V will vary in direct proportion to Z.


The applied current (I) flows through the volume of the thorax, which includes skin, skeletal muscle, the lungs, the heart and blood.  Because blood is a conductor, the changes in blood volume during a cardiac cycle produce a measurable change in thoracic impedance.  Researchers have developed equations for estimating left ventricular SV based on thoracic impedance, with the most widely used equation being that developed by Kubicek, et al. (1966):

 SV = rho x (L/Zo)² x LVET x (dZ/dt Max)

 Where:

 SV = Stroke volume (ml)

rho = Resistivity of blood (Ohms·cm) which is assumed to be a constant 135 Ohms·cm (Quail, Traugott, Porges, & White, 1981).

L = Length or distance between inner band (voltage monitoring) electrodes (cm)

Zo = Basal Thoracic Impedance (Ohms)

LVET = Left Ventricular Ejection Time (seconds)

dZ/dt Max = Absolute value of the cyclic peak of the derivative of Zo (Ohms/sec)

LVET varies inversely with heart rate under a broad range of circumstances.  LVET should not be treated as a constant in the Kubicek equation.  Unlike Length (L), which is constant during a session, Thoracic Impedance (Zo) also varies some, although not as much as LVET.   Blood resistivity (rho) also may vary with changes in hematocrit levels and red blood cell orientation, but that variation has largely been ignored because of the difficulties associated with having to draw blood to measure rho.

Impedance Cardiography (ICG) is an indirect measurement of Stroke Volume (SV).  Studies have been performed to correlate ICG to SV, using thermodilution as reference and have found that accuracy improves when variables such as age, height, sex, waist circumference and weight are factored into the SV estimation.  Accordingly, ICG measures are best interpreted as a relative, versus absolute, indication of SV.  Even so, as a relative measure, ICG can provide a clear indication of important physiological processes associated with homeostasis and hemodynamic changes.

Research in psychophysiology, and other areas of physiology, focuses on the left ventricle because it pumps blood that supplies the metabolic requirements of striated (skeletal and cardiac) musculature and thus fundamentally supports behavior and exercise.  For Impedance Cardiography (ICG), the left ventricle is principally important because the dZ/dt signal primarily indicates left ventricular blood ejection into the aorta.  There is very little influence from right ventricular blood ejection in the ICG signal.

For more information on BIOPAC’s ECG solutions, visit BIOPAC’s ECG-Cardiology page or view BIOPAC’s full line of electrodes, amplifiers, and wearable, wireless transmitters and loggers.

For more information on BIOPAC Systems, visit us at www.biopac.com.

Electrocardiogram Waveshape Pt. 2

In some situations, it can be helpful to craft a compromise between maximizing ECG signal bandwidth, preserving the essential ECG waveshape, reducing the impact of skeletal myo-electrical noise and removing mains interference.

By Alan Macy, BIOPAC Systems, Inc.

This blog continues the discussion of Electrocardiogram waveshape.

In some situations, it can be helpful to craft a compromise between maximizing ECG signal bandwidth, preserving the essential ECG waveshape, reducing the impact of skeletal myo-electrical noise and removing mains interference. If this collective compromise is not well-considered, certain problems can arise. For example, if notch filters are used to remove mains interference in the ECG signal processing channel, significant distortion can be introduced into the ECG waveshape. Accordingly, notch filters are generally avoided or only used in combinations with lowpass filters to minimize undesired effects.

When constraining the ECG signal bandwidth, it becomes increasingly important to be aware of the phase linearity of the filters used to bandlimit the channel. For example, if a 35 Hz, second order, lowpass, Butterworth filter is used instead of one at 150 Hz, then an observable “ringing” will be evident after the QRS interval. This ringing occurs because of the phase non-linearity of the 35Hz Butterworth filter. However, if the 35 Hz filter is adjusted to have more “Bessel-like” phase qualities, the problematic ringing can be eliminated. When limiting the ECG signal frequency band to less than 0.05-150 Hz, reasonably phase linear highpass and lowpass filters will preserve the essential waveshape of the ECG. Phase linearity implies constant group delay. Constant group delay means that all frequencies in the filter passband are delayed by the same amount of time. Phase linear analog filters, and their digital equivalents, can be designed to process an ECG signal with minimal, filter-induced, distortion.

In addition to the above-listed simple strategies, a host of digital signal processing methods are available to optimize the previously mentioned compromise. Methods include linear and non-linear adaptive filters, synchronous adaptive noise cancellation, dynamic neural networks, coherent averaging, transform domain singular value decomposition and Legendre moments. [2]
References:

[2] http://www.ijric.org/volumes/Vol7/Vol7No7.pdf

For more information on BIOPAC’s ECG solutions, visit BIOPAC’s ECG-Cardiology page or view BIOPAC’s full line of electrodes, amplifiers, and wearable, wireless transmitters and loggers.

BIOPAC Systems, Inc. provides life science researchers and educators with data acquisition and analysis systems that inspire people and enable greater discovery about life.  Visit us at www.biopac.com.

Electrocardiogram Waveshape – Pt 1

When recording ECG, it’s important to consider the impacts of electrode placement and amplifier filters on the measured biopotential. Electrode placement is important because different orientations of biopotential surface electrodes with respect to the heart’s position will result in different signal shapes.

By Alan Macy, BIOPAC Systems, Inc.

When recording ECG, it’s important to consider the impacts of electrode placement and amplifier filters on the measured biopotential. Electrode placement is important because different orientations of biopotential surface electrodes with respect to the heart’s position will result in different signal shapes. As the heart contracts and expands, during the course of pumping blood, a time-varying, voltage signal is propagated over the volume of the heart. This voltage signal conducts to the surface of the body and is detectable between any two points on the body that straddle the heart. The signal can look quite different depending on whether the signal is collected from left hand to right hand or from right hand to left leg. When the ECG signal is recorded far from the heart, electrode placement is not critical to obtain similar-looking ECG waveforms when recording over time. As electrodes are placed increasingly close to the heart, then electrode placement becomes quite specific to recreate similar-looking ECG signals. This is because the body is a volume conductor and the heart is not a point-source of electrical signal activity.

The ECG waveform has been specified to consist of frequency components in the range of 0.05 Hz to 150 Hz, even though the characteristic ECG waveform shape is largely composed of components from 0.05 Hz to 35 Hz. However, even if the ECG’s primary waveshape is preserved, bandwidth limits affect usability of the data. For a high-resolution ECG recording, the signal bandwidth should be maximized. Although the Association for the Advancement of Medical Instrumentation (AAMI) standard recommends an ECG bandwidth of 0.05-150 Hz, surface electrodes measurements can show ECG components up to 500 Hz. [1]

As with any physiological measurement from a subject, the balance lies in attempting to isolate the signal of interest from residual noise sources. In the case of ECG recording, interfering noise is often generated by skeletal muscle that lies in the superposition path defined by electrode placement. This noise (recorded as the electromyogram) can be especially problematic if the subject is intentionally moving during the ECG measurement. Other noise sources include interference resulting from mains-generated displacement currents (50/60 Hz hum).

Depending on the nature of the ECG measurement requirements, filtering methodology can be a helpful ally to reduce the effects of interfering noise sources.  The critical aspects of filtering are a function of the filter’s magnitude and phase characteristics.  Choice of filter topologies can have a significant effect on the shape of the ECG.  Given that AAMI guidelines are primarily concerned with ECG filter flatness from 0.05-150 Hz, typically, second-order (or higher) Butterworth filters are used to define these limits.

The discussion of ECG waveshape is continued in Electrocardiogram Waveshape Pt. II.

[1] http://circ.ahajournals.org/content/115/10/1306.full

For more information on BIOPAC’s ECG solutions, visit BIOPAC’s ECG-Cardiology page or view BIOPAC’s full line of electrodes, amplifiers, and wearable, wireless transmitters and loggers.

For more information on BIOPAC Systems, visit us at www.biopac.com.

Electrical Stimulators for Physiological Research: Compliance

All stimulators incorporate a fundamental characteristic known as “compliance.” Compliance comes in two flavors, namely voltage compliance and current compliance. Voltage stimulators emulate a voltage source, up to a certain current compliance. Current stimulators emulate a current source,

By Alan Macy, BIOPAC Systems, Inc. 

All stimulators incorporate a fundamental characteristic known as “compliance.” Compliance comes in two flavors, namely voltage compliance and current compliance. Voltage stimulators emulate a voltage source, up to a certain current compliance. Current stimulators emulate a current source, up to a certain voltage compliance. The stimulator compliance limit is important information. Here are examples:

Current Compliance

A voltage stimulator is being used to establish a field stimulation in a tissue bath. The voltage pulse is 100 volts, with a width of 1 ms. The bath establishes a 1000 ohm impedance between stimulation electrodes. Therefore, 100 volts/1000 ohms is 100 ma. In this situation, the voltage stimulator must be able to provide a current compliance up to 100 ma for at least 1 ms. If the stimulator’s current compliance is limited to 50 ma, then the output voltage will be limited to 50 ma * 1000 ohms or 50 volts, even if the stimulator is being instructed to output 100 volts.

Voltage stimulators commonly operate with the help of high voltage DC-DC converters and storage capacitors to provide the needed compliance current. If the storage capacitors can’t store enough charge or are not sufficiently supplied, then voltage stimulators may exhibit a quality known as voltage droop. Voltage droop is the quality when the stimulator output voltage can’t be maintained over a specific time interval, due to lack of sufficient current compliance. If the above stimulator can only be current compliant to 100 ma for 0.5 ms, then the output voltage pulse will be 100 volts for 0.5 ms and then will decay in direct proportion to the current compliance limit.

Voltage Compliance 

A current stimulator is being used for neuromuscular stimulation between two small electrodes. The current pulse is 10 ma, with a width of 1 ms and there is a 10,000 ohm impedance between stimulation electrodes. Therefore, 10 ma * 10,000 ohms is 100 volts. In this situation, the current stimulator must be able to provide a voltage compliance up to 100 volts for at least 1 ms. If the stimulator’s voltage compliance is limited to 50 volts, then the output voltage will be limited to 50 volts / 10,000 ohms or 5 ma, even if the stimulator is being instructed to output 10 ma.

Current stimulators commonly operate with the help of high voltage DC-DC converters and storage capacitors to provide the needed compliance voltage. If the storage capacitors can’t store enough charge or are not sufficiently supplied, then current stimulators may exhibit a quality known as current droop. Current droop is the quality when the stimulator output current can’t be maintained over a specific time interval, due to lack of sufficient voltage compliance. If the above stimulator can only be voltage compliant to 100 volts for 0.5 ms, then the current pulse will be 10 ma for 0.5 ms and then will decay in direct proportion to the voltage compliance limit.

Example

In the case of transcranial Direct Current Stimulation (tDCS), a constant current of up to 2 ma (Is) may be applied through the cranium. Assuming a combined series electrode / skin junction resistance of 20 Kohms, a cranium resistance of 100 ohms and other loop series resistances considered negligible, then the total stimulation loop impedance (Zs) is 20.1 Kohms. Accordingly, in this situation, the voltage compliance (Vs) of the tDCS current stimulator must be at least:

Is * Zs = Vs
0.002 amp * 20,100 ohms = 40.2 volts

Given the variable nature of the combined series resistances in the stimulation loop, it’s generally helpful to double the expected compliance voltage requirement of the stimulator. Accordingly, in this case, a stimulator compliance voltage of 80 volts or higher is recommended. Because the series resistance in the loop is largely a function of the electrode / skin interface junctions, the choice of electrode type and contact area has a great effect on the voltage compliance requirements of the current stimulator. Other factors contributing to the voltage compliance requirement are the equilibrium potentials and over-potentials associated with the specified electrode / electrolyte / skin junctions. Furthermore, if high resistance electrode leads are used, the potential across the leads may become material.


BIOPAC Systems, Inc. provides life science researchers and educators with data acquisition and analysis systems that inspire people and enable greater discovery about life. BIOPAC lets you measure physiology anywhere, with innovative, compatible wireless, wearable solutions that can be used by anyone for meaningful discovery. We make high-quality scientific tools for physiology measurement and interpretation with superior compatibility and world-class customer service and support. Visit us at www.biopac.com.

Five Steps to a Better Physiology Lab – Preparation

Integrating new hardware and software into the Physiology lab curriculum…key points from instructors who have created successful labs that will greatly increase the chances of a rewarding lab experience for both students and instructor.

by William McMullen, BIOPAC Systems, Inc.

Integrating new hardware and software into the Physiology lab curriculum can be intimidating. Despite the best of early-summer intentions, in fall Instructors often find themselves apprehensively staring at a box full of unfamiliar equipment a few short days before the first lab. Luckily, the Biopac Student Lab excels in this situation, as it is easy to use and includes all materials necessary for students to prepare, record and analyze their data. This means that, in a crunch, if all one did was install the software and verify the hardware connections, most students should obtain meaningful data. Beyond the default setup, there are multiple customization options as described in the user support documentation. There are, however, some key points we have learned from instructors who have created successful labs that will greatly increase the chances of a rewarding lab experience for both students and instructor.

1. Organize the lab such that each student participates equally and each obtains recorded data from their bodies.
Students are more motivated when working with their own data. The Biopac Student Lab requires a minimum of three students for most lessons; a Recorder, a Director and a Subject. At the end of each lesson recordings, the students should rotate through these rolls and rerun the lesson until each student has recorded their own data. In order to provide enough recording time in a standard 2 hour lab period, the number of students per lab station should be four to five.

2. Setup basic Lesson Preferences before the first lab to minimize confusion.
Run each lesson* that will be used and setup the following:

  • If using lessons L02, L07-L09 or L12-L17, different models of transducers may be used. Check that the image and transducer descriptions in the lesson guide match the hardware used. If changes are needed, choose File > Lesson Preferences and select the desired transducer.
  • Disable undesired recording tasks by choosing File > Lesson Preferences > Lessons Recordings. If none of the recording tasks are desired (if using a custom procedure), disable all and only generic information will be displayed in the lesson guide.

*Note: If using the optional Curriculum Management System (available in BSL 4.1), only changes to the Host computer are required and all other computer/lab stations will be automatically updated. If not using this option, the changes must be made to each computer.

3. For Lessons L12 and L13 (Pulmonary Function), greatly reduce calibration time by matching the hardware with the software.
Label the lab station computer, the MP device and the Airflow Transducer (SS11LA/L) and make sure they are always matched. Run lesson 12 and check File > Preferences > Calibration Syringe Size to make sure it matches the syringe that will be used. Choose File > Preferences > Calibration Syringe Values and then select “Set once and use stored values”. Carefully run through the calibration using the syringe. From then on, when the students run the lesson, they will only need to calibrate for zero baseline (no syringe) which is easy and only takes a few seconds.

4. Students should have a basic understanding of the software before the first lab.
All Biopac Student Lab lessons use the same basic software tools and if students have a basic understanding of these tools in advance, they will experience greater success obtaining good data and having a positive lab experience. Students should be instructed to download the free Biopac Analysis software onto their personal computers.

This software not only provides the ability to analyze the data recorded in the lab but also allows students to prepare for a lab by studying the included tutorial videos and sample data. Some instructors give a test prior to the first lab to make sure students reviewed the BSL Tutorial Video.

5. Demonstrate proper electrode preparation and explain ways to minimize motion artifact. 
For lessons that use electrodes, good electrode contact and minimal EMG/motion artifact are keys to obtaining good data. Although this is explained in the procedures, it cannot be emphasized enough. Demonstrate the cleaning of the skin (with soap or alcohol) to remove dirt and oil and the abrading around the electrode site to remove the dead epidermal layers that impede electrical flow. Always place a drop of electrode gel on the electrode and wait at least 5 minutes after electrode placement before beginning a recording. To minimize EMG artifact, the student should be as relaxed and motionless as possible (unless procedure calls for movement). Talking, blinking (during EEG or EOG recording), laughing or deep breathing will add unwanted EMG artifact to the data.

These easily implemented steps will greatly assist students in obtaining good data from the very first lesson, leading to a positive lab experience and ultimately gaining a better understanding of Physiology.


BIOPAC Systems, Inc. provides life science researchers and educators with data acquisition and analysis systems that inspire people and enable greater discovery about life. BIOPAC lets you measure physiology anywhere, with innovative, compatible wireless, wearable solutions that can be used by anyone for meaningful discovery. We make high-quality scientific tools for physiology measurement and interpretation with superior compatibility and world-class customer service and support. Visit us at www.biopac.com.

error: Content is protected !!

