Eye-Catching: Mobile Tech Enhances Immersive Experiments

Freed from the limitations of stationary eye tracking technology, mobile eye tracking enables researchers to study their subjects while they perform a wide range of immersive tasks in natural settings.

Sixteenth-century pediatrician Thomas Phaer mused that “the eyes are the windows to the soul.” These sensory organs and their movements certainly provide a wealth of information to researchers studying the interaction of mind and body. Eye tracking has long been a key tool of physiological and psychophysiological research, and recent developments in mobile eye tracking take this valuable data resource out of the confines of the lab and into the real world.

Freed from the limitations of stationary eye tracking technology, mobile eye tracking enables researchers to study participants while they perform a wide range of immersive tasks in natural settings. These self-contained devices come in a variety of form factors including wearable glasses that provide untethered eye tracking data acquisition in real time that can be combined with other physiological data collected during live experiments.

Today’s lightweight mobile devices can record a broad spectrum of eye tracking data, including pupil size and position, gaze path, vergence angle, and areas of interest (AOI). The latter connects stimuli to eye-movement metrics, providing data on the participant’s psychophysiological response to stimuli within their field of vision. In previous blog posts and webinars, we have explored how mobile eye tracking technology gathers this data. Numerous studies have been published that demonstrate its potential in physiological and psychophysiological research. Settings and applications include user experience, sports and physical therapy, public safety and law enforcement, driving and equipment operation, and work environments from the office to the factory floor.

Mobile eye tracking technology allowed researchers at The University of Sheffield to take their experiments to the city streets for a 2020 study into how different lighting affects cyclists navigating urban environments at night. Mobile eye tracking provided data on the gaze behavior of nocturnal cyclists in parallel with skin conductance response (SCR) to better understand how obstacle detection is influenced by variations in type, location, and level of lighting. Bicycles and their riders were equipped with a BIOPAC data acquisition unit and audio stimulation units along with a BioNomadix EDA transmitter and electrodes to record the participants’ SCR. Eye tracking data, including AOI, were synchronized with SCR data and analyzed using AcqKnowledge software to determine how the riders reacted to a variety of lighting conditions. Researchers concluded that lighting plays a significant role in riders’ comfort levels at night and that improved lighting could increase urban bicycle use.

VGM playerLess intrusive by design, mobile eye tracking can provide indoor experiments with a heightened degree of immersion. A study at the University of British Columbia used mobile eye tracking glasses to create a more natural environment to investigate how the immersive effects of electronic gaming machines (EGM) impact gambling addiction. The study looked at how machine design triggered psychophysiological responses in participants by assigning various AOI to EGM screens. ECG data were recorded along with respiration effort via a BIOPAC respiration effort transducer and amplifier, which were fed to a data acquisition unit and synchronized with AOI data recorded via mobile eye tracking glasses. The study was able to successfully identify several key markers for game immersion using AOI that suggest behavioral links between immersion and gambling addiction.

Possible applications for mobile eye tracking in research continue to expand with the evolution of the technology. To learn more about recent developments in mobile eye tracking, check out our latest webinar on mobile eye tracking glasses with AcqKnowledge integration.


Learn more about how to integrate mobile eye tracking into your next research project by contacting your local BIOPAC sales representative.

Mind and Body: Signals to Enhance Your Psychophysiology Research

The human body and mind share an intrinsic link, both influencing and reflecting the health and general well-being of the other. Within the field of psychophysiology, researchers gain a wealth of insight into mental processes and disorders by studying physiological signals recorded from both the brain and body. Signals such as electrodermal activity (EDA), skin temperature (SKT), electroencephalogram (EEG), heart rate variability (HRV), and functional near-infrared spectroscopy (fNIRS) provide just a few of the tools helping us to better understand these mind-body interactions.

A wide range of research technologies has made these signals increasingly accessible in the lab as well as in everyday environments, allowing studies to place participants in increasingly naturalistic settings while gathering critical physiological data. In this way, researchers can provide a more accurate picture of how study participants react to stress and arousal, experience emotion, or interact within group environments.

One recent study used EDA and heart rate (HR) to examine the role of emotion in student success within computer-based learning environments (CBLE). As discussed in previous posts, a range of signals can be used to measure the body’s physiological response to emotion, otherwise known as “affect.” By gaining a better understanding of learners’ emotional responses to CBLE stimuli, researchers in this study hope to apply their data to improvements in CBLE design. EDA data was gathered from participants via SS57LA EDA leads while HR signals were collected with SS2LB shielded lead sets, both of which were connected to a BSL MP36 data acquisition and analysis system. Participants were shown imagery designed to evoke a negative emotional reaction before being asked to read a complex academic paper. The study was able to establish a link between the participants’ emotions and their comprehension of the reading material.

head with brain exposedIn another study, researchers used EDA and skin conductance response (SCR) to measure participants’ reactions to conditioned stimuli (CS) and unconditioned stimuli (US). The goal was to determine if fear-inducing memories could be modified either pharmacologically or through behavior modification to overcome fear. An MP36R System with AcqKnowledge software allowed analysis of SCR signals gathered via SS3LA finger transducers across a range of experiments designed to trigger fear-inducing memories. While the overall results were inconclusive, the SCR signals provided valuable feedback regarding the participants’ response to stimuli.

While EDA is a common thread through many of these psychophysiology studies, other signals provide researchers with a more complete and nuanced data set from which to draw their conclusions. Researchers exploring the factors influencing musical preferences combined EDA data with ECG and facial electromyography (fEMG) signals to assess how listeners reacted to familiar and unfamiliar musical stimuli. Data from all three signals were fed to an MP36 data acquisition and analysis system. The study found a strong correlation between musical preferences and familiarity with material as reflected by the subjects’ emotional responses.

These examples only scratch the surface of how psychophysiological research is being aided by an array of signals, all made accessible with available technology. To learn more about how to implement these signals in your next study, see BIOPAC’s Psychophysiology Applications webpage.


Contact your BIOPAC sales representative to learn more about the wide range of data-gathering tools available to help you construct your next psychophysiology study.

Skin Deep: Using EDA to Measure Affective Response

We say something “gets under our skin” when it elicits an unpleasant or irritating emotional response. This connection between our skin and emotion runs deeper than a simple idiomatic expression, however. Along with performing several critical functions—protective, regulatory, and sensory—our skin provides a window into our physiological and emotional states as we respond to a range of stimuli. Electrodermal Activity (EDA) is the mechanism providing these insights.

EDA, also known as galvanic skin response (GSR), measures eccrine activity resulting from the sympathetic nervous system’s response to environmental stimulation. As a function of the autonomic nervous system, it is an involuntary response to a range of sensory inputs, including touch, sight, sound, odor, and taste. EDA regulates the rate of sweat produced by sweat glands in the extremities, particularly in the fingertips, palms, and soles of the feet.

EDA increases in conjunction with the level of stress or nervousness experienced by an individual. For this reason, it provides researchers with a valuable means of measuring affective response to external stimuli. As we explored in a previous post, affect is the measurable physiological expression of emotion. While there are numerous physiological signals that researchers can employ to measure affect, EDA in particular functions as an indicator of arousal. For this reason, EDA has become one of the most relied upon signals employed by researchers exploring psychophysiological phenomena.

Violence StudyA recent Slovakian study published in Adaptive Human Behavior and Physiology illustrates how EDA is commonly employed in such research. Researchers studying the influence of gender differences on reaction to violent imagery used skin conductivity response (SCR), the mechanism behind EDA, to measure levels of arousal when participants were shown images of war and sports. The goal of the study was to test the “male warrior hypothesis” (MWH). The theory suggests that men have evolved psychological mechanisms to form aggressive alliances with the goal of acquiring or protecting reproductive resources in war and that team sports stimulate that same impulse. EDA was measured using BIOPAC electrodes and leads feeding data to an MP36 data acquisition unit. While the study found that visual perception of team sports and war imagery stimulated different levels of excitement as measured by EDA in men and women, it was inconclusive in showing that sports provide a substitute for war in the sample of participants.

A study conducted at the University of Ottawa and published in the Journal of Behavior Therapy and Experimental Psychiatry used EDA to examine whether response-focused emotion regulation (RF-ER) strategies provided an effective way to control evoked emotions—specifically, does smiling make one feel better in times of heightened stress? EDA data was gathered from participants using a BIOPAC skin conductance transducer and amplifier connected to a BIOPAC data acquisition unit while participants were shown images designed to evoke both arousal and negative responses. Participants were asked to either suppress their emotional response to images or employ expressive dissonance (e.g., smile when disturbed). The results of the study shed doubt on previously held assumptions that RF-ER strategies were effective in controlling emotion.

These are just a sampling of the ways in which EDA is being used in psychophysiological research. For additional information on the background, tools, and techniques for using EDA in your studies, visit our EDA Resource Directory, read our EDA Introductory Guide. and watch Electrodermal Activity: Intro to Recording and Analysis or any of our EDA webinars.


For additional information on how BIOPAC can assist you with your research using EDA and a range of other physiological signals, contact your local sales representative.

Silent Partner: Autonomic Function Testing in Research

Like the inner workings of an intricate machine, most of our bodily functions operate with little or no conscious effort. That task falls to the autonomic nervous system, a sort of control system that regulates a wide range of processes, including digestion, heart rate, respiration, urination, and sexual arousal, to name a few. The autonomic nervous system also controls physiological responses to stimuli—the fight-or-flight response, and critical reflex actions like vomiting, swallowing, coughing, and sneezing.

The ability to effectively and accurately test autonomic function allows clinicians to diagnose and treat a range of ailments. Such tests can non-invasively evaluate the severity and distribution of autonomic failure, for example. Beyond these clinical applications, autonomic function testing provides valuable insight into how the body regulates and manages various critical functions and how the autonomic nervous system affects our physical and psychological health.

adolescent depressionAutonomic function testing has been employed to examine the impact childhood trauma has on cognitive function as it relates to adolescent depression. A 2020 study published in Development and Psychopathology looked at whether economic deprivation and threat influenced cognitive processes and autonomic nervous system function connected to the severity of depression. Researchers measured study participants’ electrodermal activity (EDA), respiratory sinus arrhythmia (RSA), and electrocardiogram (ECG) data via an MP150 system. EDA was gathered using a BioNomadix wireless BN-PPGED amplifier set, while ECG and respiration (RSP) recordings were obtained with a BioNomadix wireless BN-RSPEC amplifier set. The study’s findings supported the assumption that a history of trauma and economic deprivation can lead to risk factors for youth depression.

Continuing with the theme of applying autonomic function testing to measure the effects of trauma, a 2021 study publish in Neurobiology of Stress examines autonomic function related to sex differences among individuals with posttraumatic stress disorder (PTSD). Skin conductance, blood pressure (BP), heart rate (HR), and high-frequency heart rate variability (HF-HRV) were recorded with an MP150 data acquisition system among male and female emergency personnel following trauma exposure. The results, which showed notable sex differences in autonomic functioning among trauma-exposed individuals, have implications for predicting cardiovascular risk in those with PTSD.

These are just a few examples of how autonomic function testing is being used outside of the clinical setting to shed new light on several research areas. Check out Part 1 and Part 2 of our webinars demonstrating how to use BIOPAC equipment and software in autonomic function research.


For additional information on how BIOPAC can assist you with a wide range of research and educational applications, contact your local sales representative.

Choosing the Right Signal: Easy as 1, 2, 3

In physiology and life sciences, researchers rely on a wide range of signals to gather data from humans and animals. These signals provide critical insight into how complex organisms function under a myriad of conditions. However, this wealth of potential data sources can also present a challenge for researchers: choosing the right signals on which to focus their data gathering. For those lacking a background in the disciplines and mechanisms behind these signals, sifting through the available methodology can be overwhelming. The best place to begin is by considering one or a combination of the “Big Three” physiological signals: ECG, EDA, and respiration.

In physiology and life sciences, researchers rely on a wide range of signals to gather data from humans and animals. These signals provide critical insight into how complex organisms function under a myriad of conditions. However, this wealth of potential data sources can also present a challenge for researchers: choosing the right signals on which to focus their data gathering. For those lacking a background in the disciplines and mechanisms behind these signals, sifting through the available methodology can be overwhelming. The best place to begin is by considering one or a combination of the “Big Three” physiological signals: ECG, EDA, and respiration.

One from the Heart

Changes in heart rate can provide information on both the physiological and psychological state of a research participant. Electrocardiography (ECG or EKG) is a biopotential measurement that provides direct metrics on electrical voltage changes in the heart. With the help of simple hardware and software, it is possible to record these voltage variations as waveforms to track how the heart responds to stimuli. Additional data can be provided by creating reoccurring reference points in the waveform, measuring the intervals between beats, and calculating heart rate variability to track changes over time or in response to stimuli.

Skin Deep

Electrodermal Activity (EDA) provides one of the best measurements of how the body responds to psychological stress and anxiety. It can be simply understood as a measure of changes in the electrical conductance of the skin in relation to the production of sweat. The physiological process of EDA comprises two components, skin conductance level (SCL) and skin conductance response (SCR). SCL is a tonic level that slowly changes over time, measuring the period for response to a stimulus to occur, from its onset to its peak. SCR reflects the phasic response to an arousing stimulus that is shown in faster changes of the skin conductance level. As an example of the application of EDA and ECG measurements in psycho-physiological research, a recent study applied both signals in measuring the cognitive states of gamers during human-computer interaction (HCI).

Breathe Easy

ArachnophobiaAs with changes in heart rate, variations in breathing cycle reveal how subjects respond to a wide range of stimuli and conditions. The signal produced by the respiratory cycle is a transduced physiological signal. As such we can apply mechanisms to create a voltage potential to measure phases of inhalation and exhalation in this cycle. This data can be represented in waveforms, providing data on respiratory rate, amplitude, and respiratory sinus arrhythmia (RSA). The latter combines respiratory data with ECG signal data to show changes in heart rate in response phases in the respiratory cycle. A 2020 machine learning study for the development of virtual reality applications combined respiration, EDA, and ECG signals to measure participant’s fear response to spiders, an example of how all three signals can be simultaneously utilized in psychophysiology research.

Choosing the right signal shouldn’t be the biggest hurdle to designing your next research project. Applying one or more of these “Big Three” can cover a wide range of data gathering goals.


For additional assistance, consult BIOPACS online resources on Life Science and Physiological Signals or contact your local BIOPAC representative.

‘Tis the Season for Stress: Research Tools for Anxious Times

Holiday-related stress is as much of a seasonal tradition as family gatherings, frantic shopping forays, and over-indulgence in food and drink. Add to this potent mixture nearly two years of pandemic-induced tension and we have a volatile cocktail of emotions and anxiety awaiting us in November and December. What better time to study the causes and effects of stress?

Research has established strong links between stress and our moods and sense of well-being, not to mention overall mental and physical health. While certain types of stress during development can teach individuals to adapt to life’s many challenges, excessive and prolonged stress is shown to contribute to chronic disease and a range of psychological disorders. According to the American Psychological Association, which conducts an annual survey monitoring stress, the COVID pandemic has had an unprecedented impact on stress levels across all demographics, particularly among young people.

The pandemic is just one of many factors driving demand for new approaches to stress research. Thankfully, researchers now have access to a myriad of technologies to support any experiment design. In a recent webinar on techniques for measuring physiological changes related to stress, BIOPAC head of European Sales, Alex Dimov, outlined a range of stress-connected physiological responses that can be measured in the lab with available technologies. These include heart rate, heart rate variability (HRV), trans-radial-ulnar electrical bioimpedance velocimetry (TREV), cardiac output, blood pressure, EDA, pulse, respiration, EMG, EEG, and functional near infrared spectroscopy (fNIRS).

One of the challenges of measuring stress in a natural environment is finding the right data gathering tools to support the mobility of test participants. A 2019 study tackled this by examining a variety of techniques for measuring stress in day-to-day life using mobile phones and wearable sensors. Settings included the lab, automobile, office, school, and other daily life locations. Along with consumer products like smartphones, smartwatches, and fitness bands, researchers also employed wearable sensors, including the BioNomadix wireless PPG transmitter to measure blood volume pulse (BVP) using a photo plethysmogram (PPG) signal. Researchers found that the BIOPAC device provided a high level of accuracy (80%) when employed outside of the traditional lab environment.

Smelling RosesStress research technologies are not limited to data gathering. Stimulus presentation tools offer researchers options for both inducing and alleviating stress in the lab. A 2019 University of Wisconsin study investigating the role scents can play in reducing stress utilized EDA, heart rate, and respiratory rate to measure how rose scent reduced anxiety among students taking a difficult test. Respiratory rate was measured using a BIOPAC respiratory transducer while EDA data was collected with an EDA finger transducer. Data was collected and analyzed via the Biopac Student Lab System. While rose scent was delivered using scented lotion, it should be noted that BIOPAC offers a new modular scent delivery system that is capable of delivering up to eight scents per experiment, with more than 120 scent options.

With so many data gathering tools available, planning your next experiment should not leave you feeling on edge. Let your BIOPAC sales rep help you take the stress out of stress research.


BIOPAC offers a wide array of wired and wireless equipment that can be used in your research. To find more information on solutions for recording and analyzing signals such as ECG, heart rate, respiration, and more using any platforms mentioned in this blog post, you can visit the individual application pages on the BIOPAC website.

THE BIG 3: Crucial Signals for Interdisciplinary Psychophysiology Research

This guest post was written by Michael Hogan, BIOPAC’s Southeast Regional Representative. Contact him at michaelh@biopac.com

Even trained psychologists can be daunted by the interdisciplinary applications involved with recording objective physiological data. However, it is not necessary to learn the intricacies of bio-medical engineering, physics, statistics and underlying physiological mechanisms of the body just to incorporate these objective measures into your research. With just a few key signals of interest, and a simple hardware and software setup, a trained researcher can record and interpret the objective physiological responses of participants in a physiology study.

How to get started? Begin with a protocol you are already studying and incorporate “THE BIG 3”

  1. ECG: Electrocardiography is a biopotential, meaning direct measurement of the electrical voltage potential changes of the heart as it completes its “cardiac cycle.” Since we can record these voltage changes and graphically repECG Signals in AcqKnowledgeresent them as a waveform through analog to digital conversion, we are able to identify changes in the behavior of the heart in response to the presented stimulus. We can then establish a recurring reference point in the “R-Peak” of the QRS complex, we are able to measure the distance between these R-Peaks and establish an R-to-R interval, this measure tells us the time in-between cycles or “beats” of the heart. From one beat to the next, we can establish the participant’s heart rate. Once we have established a heart rate, we are able to extract valuable measures, such as Heart Rate Variability: how the heart rate changes over an observed set of time intervals or in response to the correlated stimulus.
  1. Respiration: The respiration cycle is what is known as a transduced physiological signal. This means we utilize a mechanical apparatus to create a voltage potential in response to the inhalation and exhalation phases of the respiratory cycle. These voltage changes can then be measured and graphically represented as a waveform for further analysis. The respiratory cycle waveform can tell us the following:
    • Respiratory rate: the number of cycles that occur within a given time interval or changes in response to a stimulus.
    • Amplitude: What is the change in magnitude of the cycle, shallow vs. deep breathing.
    • Respiratory Sinus Arrythmia (RSA): When collected along with an ECG signal, this analysis accounts for the changes in the participant’s heart rate as a response to the inhalation and exhalation phases of the respiratory cycle. For example, the heart rate elevates when the participant inhales and decreases when the participant exhales.
  1. EDA: Electrodermal Activity has been adopted as the newest nomenclature for Galvanic Skin Response “GSR.” To this day EDA is touted as the best measure of sympathetic nervous system “activation.” As a derivative physiological measure, we pass a small, imperceptible current (0.5 V) into the participant’s body and measure the change from this known value as the participant responds.

As the autonomic nervous system responds to stimuli, it stimulates the eccrine glands to produce sweat. The sweat produced lowers the impedance to the current passing into the participant. We can then measure the change and extract meaningful data regarding how the participant responded to the chosen stimulus.

  • Skin Conductance Response (SCR): The magnitude of the response that occurred as a result of the stimulus from its onset to its peak.
  • Skin Conductance Level (SCL): How long it took for the response to occur following the chosen stimulus from its onset to its peak.
  • Recovery time: How long it takes the response to diminish and return to “baseline/normal” values.

With these “BIG 3” physiological measures we can perform hundreds of research protocols and objectively correlate patterns of behavior. Once these measures have been employed, we can integrate other measures for more comprehensive studies, such as:

  • EEG and fNIR for cognitive processing and learning metrics
  • Non Invasive Blood Pressure (NIBP) for stress and cardiovascular metrics
  • Facial EMG, fEMG, or Facial Coding Software for affective emotional states metrics

Visit us at www.biopac.com or click the following links for information on:

Signal-Specific Webinars
Detailed Application Notes
Signal Specific Analysis Video Tutorials
Physiological Recording Knowledge Base
Signal guides for ECG and EDA


BIOPAC Systems, Inc. provides life science researchers and educators with data acquisition and analysis systems that inspire people and enable greater discovery about life.

T4 Conference Wrap-up

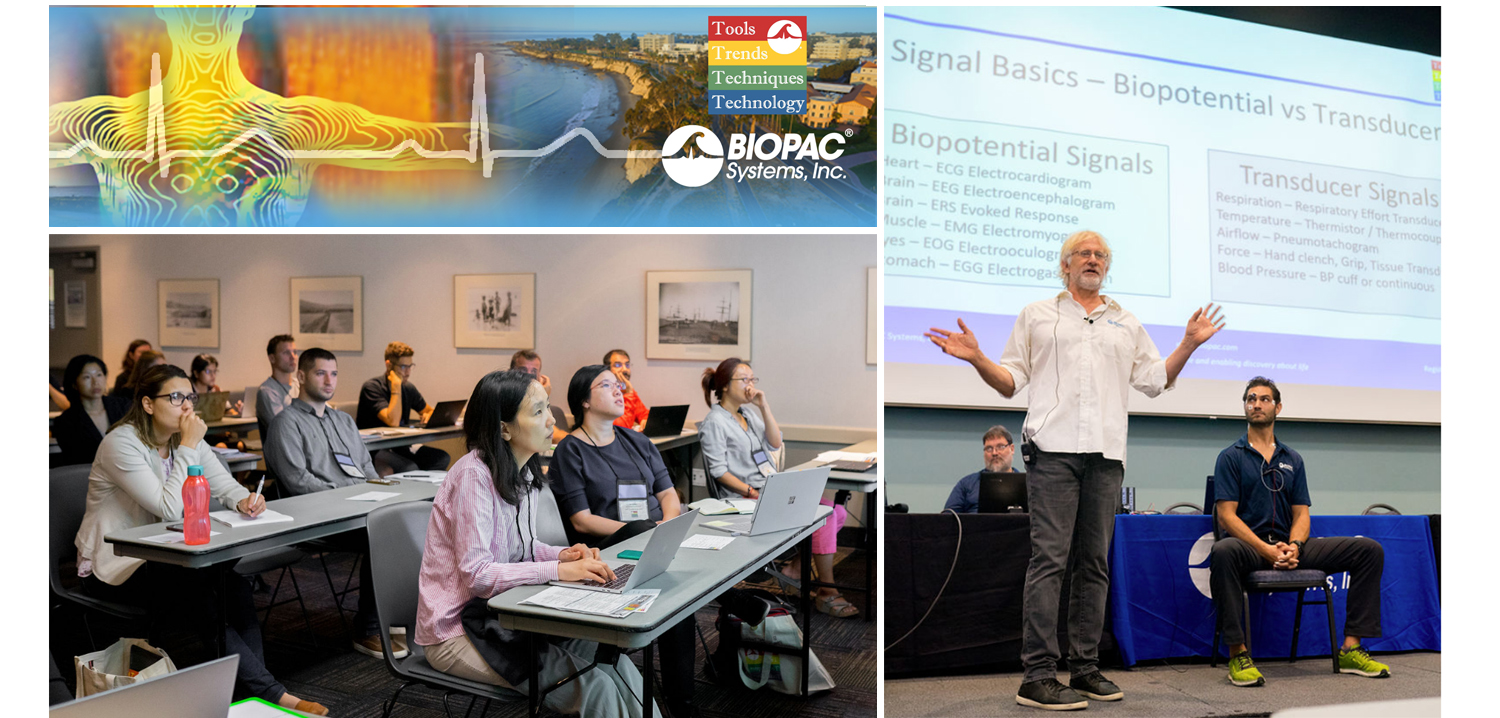
August is a month of barbecues, baseball, and last-minute vacations against the backdrop of a fading summer, and the eighth month of 2019 proved to be an equally exciting time at BIOPAC, with something of a pleasant vacation thrown in. On August 12-14, BIOPAC hosted its 2nd Biennial “Tools, Trends, Techniques, and Technology” Human Physiology Conference, known as “T4” to our friends and partners around the world. This three-day event, first held in 2017, featured lively, informative sessions hosted by BIOPAC staff, partners, noted academics, and industry experts, and covered a wide range of physiological techniques and disciplines. Over 150 attendees joined BIOPAC at the 2019 T4 Conference staged once again at the beautiful University of California at Santa Barbara campus. Participants and instructors winged in from China, Australia, Germany, Sweden, Italy, Spain, U.K., Ireland, and Egypt, as well as from wide regions of the U.S and Canada to soak up the idyllic surroundings of this ocean-side campus.

The focus of BIOPAC’s T4 Conference was to provide a fun, relaxed environment while hosting nearly 40 hands-on, human physiology training workshops chaired by over 20 distinguished instructors from around the globe. One of the many conference highlights was the “Mindfulness, Meditation, and Measurement: Mindfulness Exercises in Physiological Monitoring” session, hosted by Dr. Allan Weiss of the University of Southern California and  BIOPAC Co-founder and Director of R & D Alan Macy. These sessions, conducted in two parts over a two day period were booked beyond capacity, even though the early morning fog hadn’t yet lifted from the campus skyline.

The varied additional sessions covered a range from the basics, “Setting Up Your Lab, Getting Great Data and Troubleshooting,” (hosted by Dr. Terry Blumenthal of Wake Forest University, and BIOPAC’s Alan Macy and Tim Cook), and “Creating Your Own Lessons Using BSL PRO,” (hosted by Dr. Taffeta Elliot of the New Mexico Institute of Mining and Technology), to exciting new technologies such as “Integrating Screen-based Eye Trackers with AcqKnowledge,” with Keith Jackson of BIOPAC partner company EyeTech, BIOPAC CEO Frazer Findlay, and BIOPAC Engineering Manager Ed Peterlin. Additional wide-ranging physiological disciplines were also covered, including MRI techniques, stimulation, and exercise physiology. All sessions were conducted using BIOPAC hardware and software systems, as well as platforms provided by BIOPAC partners such as Cedrus, fNIR, WorldViz, Psychology Software Tools, and CNSystems. At the end of each day, it was time to relax and unwind with a beverage of choice, a a walk along the beach, and some good conversation. Each evening featured excellent meals and camaraderie in the relaxed yet elegant environment of some of Santa Barbara and Goleta’s most stunning surroundings. After three great days of immersive sessions, it came time for everyone to part ways, having forged new collaborative partnerships and an enhanced knowledge about the full potential of BIOPAC and BIOPAC partner products.

You don’t have to wait for T4 2021 to learn more about life science data—watch Fundamentals of Physiological Data Recording now!

For a closer look at T4, and a preview of what is sure to be an exciting 2021 event, we invite you to visit our T4 Human Physiology Conference page.

Looking for additional resources, tips, tricks, and expert advice on BIOPAC and BIOPAC Partner products? Please also visit our Webinars and Video Tutorial pages.


BIOPAC offers a wide array of wired and wireless equipment that can be used in your research. To find more information on solutions for recording and analyzing signals such as ECG, heart rate, respiration and more using any platforms mentioned in this blog post, you can visit the individual application pages on the BIOPAC website.

Understanding Stimulus Presentation Studies

Stimulus presentation studies are an important aspect of modern research that record and organize a participant’s reactions and physiological data to various inputs. These studies are commonly used in neuromarketing or psychophysiological experiments. First off, what is stimulus exactly? Put simply, a stimulus is a sensory input delivered to a participant with the purpose of eliciting a particular response. These stimuli can consist of images, words, lights, sounds, virtual reality, scent, or even mild electrical impulses.

The idea is to present varying types of stimulus to a participant at expected or unexpected intervals and record his/her response. For example, a collection of images might be presented (one at a time) ranging from pleasant (say an impressive vista) to neutral (say a street scene) to unpleasant (possibly a striking snake or other “fight or flight” image). Programmable stimulus systems (such as E-Prime or SuperLab) to present the stimuli, and can be used with a Chronos or M-Pod response keypad that the participant presses, each key representing a different response (e.g., pleasant image = press Key 1, unpleasant = press Key 2, etc.). A physiological signal commonly gathered from the participant is electrodermal activity (EDA), which measures the perspiration generated in a participant’s palms or fingertips. This “eccrine activity” has a strong correlation with emotional responses. For studies involving visual stimuli, a camera may be used to record the participant’s facial expressions. The expressions are simultaneously recorded and categorized using software such as FaceReader.

Stimulus experiments are generally set up using the hardware and software of the stimulus system and the resulting physiological data and stimulus markers recorded using a data acquisition system, such as BIOPAC’s MP160 with STP100C, MP36, or Smart Center Systems. These systems include AcqKnowledge or Biopac Student Lab life science software and the MP data acquisition units that interface with the stimulus hardware.

In practice, setting up stimulus studies is easier than it sounds on paper. The parameters and stimulus types are set up via drag-and-drop-interfaces in the E-Prime or SuperLab software, and the hardware interface set up using an I/O or USB connection between the stim hardware and the computer. The stimulus and BIOPAC data acquisition software can easily reside on the same computer, as can all stimulus and BIOPAC data acquisition hardware.

Stimulus studies can range from a simple setup, such as a participant responding to a sound for reaction time studies, to more randomized studies utilizing different types of stimulus delivered at varying pre-programmed intervals.

When the study is completed, data can be analyzed in AcqKnowledge software, and the various stimulus/responses organized automatically using AcqKnowledge’s automated Stim-Response Analysis routine.

For more information about conducting Stimulus studies using E-Prime, SuperLab, and AcqKnowledge software, we invite you to view the following free webinars and video tutorials:

Stimulus Presentation and Event Mark Up with E-Prime

Stimulus Presentation and Event Mark Up with SuperLab

AcqKnowledge Stim Synchronization and Analysis

Focus Areas – Automatically Create Using Define Between Events

BIOPAC offers a wide array of wired and wireless equipment that can be used in your research. To find more information on solutions for recording and analyzing signals such as ECG, heart rate, respiration and more using any platforms mentioned in this blog post, you can visit the individual application pages on the BIOPAC website.

Holiday Happiness Part 2: Sounds, Smells, and Self-Reflection

In a previous post, we discussed the stress-reducing benefits of loving interactions with close friends and family during the holiday season. In addition to family, there are many mood-shaping habits and activities that characterize the holidays: the smell of home-cooked meals, seasonal music, and reflection on the past year, to name a few. But do these have a real impact on happiness?

In a psychophysiology study, Matsunaga, et al., tested odor effects on autobiographical memory recall. The researchers introduced several odor stimuli to participants and measured their psychological and physiological reactions. Heart rate and skin conductance were recorded throughout the experiment with a BIOPAC data acquisition system. The odor stimuli resulted in decreased heart rate, increased skin conductance level, and an increase in positive mood states.

Another article tested the effects of meditation on emotional regulation. Participants completed emotional measures before and after a meditation intervention, and had their ECG, respiration, and blood pressure recorded using a BIOPAC MP unit. The meditation correlated with greater participant emotional regulation, as suggested by lower heart rate and respiration.

In addition to meditation and smell, Harmat and Eerola have found music to also be emotionally significant. Participants listened to a musical piece, and then responded to a questionnaire about their emotional state. In addition to measuring pulse rate and facial expressions, the BIOPAC Research System and EDA Amplifier were used to record skin conductance while participants listened to the stimulus. The results found that music samples evoked several emotions, including nostalgia and happiness.

This research suggests that we can affect happiness using subtle techniques that are part of everyday living. To read more studies about psychophysiology and stress reduction, visit the BIOPAC publication page.

BIOPAC offers a variety of equipment that can be used in studies similar to the ones presented. To find more information on solutions for recording and analyzing signals such as skin conductance, ECG, heart rate, respiration, and EDA using the MP160/MP150, and other platforms, you can visit the individual application pages on the BIOPAC website. 

error: Content is protected !!