Neuroergonomics: Measuring Cognitive Workload in Real-World Tasks

In some high-stakes jobs, the pressure can feel overwhelming. From air traffic controllers tracking dozens of aircraft simultaneously to surgeons guiding robotic instruments through delicate procedures, many modern occupations require people to process extraordinary amounts of information while maintaining accuracy and focus. As workplaces become more automated and technologically sophisticated, understanding how the brain and body respond to these demands has become a central challenge for ergonomics researchers. A growing area of study, known as neuroergonomics, combines neuroscience, physiology, and human factors research to better understand how people perform in complex real-world environments.

In human factors research, neuroergonomics conintues to gain traction by offering a more comprehensive picture of cognitive workload than traditional measures. Two individuals may perform a task equally well while experiencing dramatically different levels of mental effort. Excessive cognitive workload can contribute to fatigue, stress, errors, and reduced situational awareness, while insufficient workload can lead to disengagement and decreased vigilance. Researchers are therefore concentrating attention on measuring not only what people do but also how their brains and bodies respond as they do it.

Among the most valuable tools for studying cognitive workload are physiological signals that provide objective measurements of mental state. Electroencephalography (EEG) can reveal changes in neural activity associated with attention and cognitive effort, while functional near-infrared spectroscopy (fNIRS) measures changes in cortical blood oxygenation linked to mental workload. Electrocardiography (ECG) and heart rate variability (HRV) offer insight into autonomic nervous system activity, and eye-tracking measures such as pupil diameter and gaze behavior can indicate shifts in attention and cognitive demand. More often, researchers are combining multiple synchronized signals to create a more complete view of how people interact with demanding tasks and environments.

A team of researchers from Drexel University and Lockheed Martin investigated how multiple physiological signals can be combined to measure cognitive workload across a range of mental activities. Participants completed tasks involving working memory, vigilance, risk assessment, attention shifting, situation awareness, and inhibitory control while researchers simultaneously monitored EEG, fNIRS, ECG, photoplethysmography (PPG), electrooculography (EOG), and eye tracking. Brain activity was measured using an fNIR Devices system alongside other physiological monitoring technologies. The researchers found that different physiological measures varied in their sensitivity to specific task demands, with neuroimaging measures providing particularly valuable insight into changes in workload. The findings demonstrate the value of combining signals from the brain, heart, and eyes to create a broader perspective of cognitive effort in complex environments.

Researchers at Loughborough University in the United Kingdom examined how rising task complexity influences cognitive workload in modern manufacturing environments. Participants performed a series of assembly tasks while researchers recorded pupil diameter with Tobii eye-tracking and measured HRV with wearable ECG sensors. By comparing physiological responses across low-, medium-, and high-complexity tasks, the team identified significant changes in both pupillometry and cardiac indicators of cognitive load. Their findings suggest that physiological monitoring can provide an objective means of evaluating cognitive ergonomics in highly digitalized manufacturing environments and may help support the design of more sustainable, human-centered workplaces.
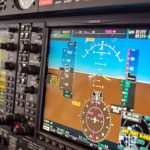
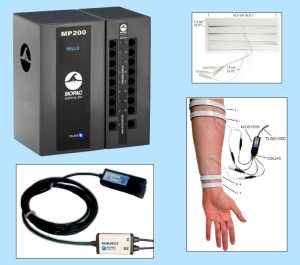
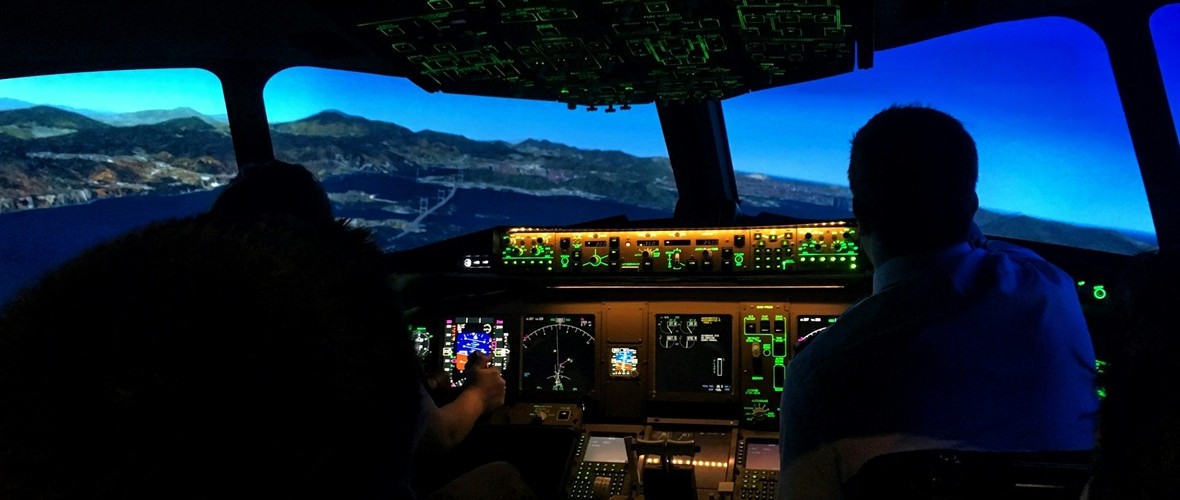
flight simAnother important challenge in neuroergonomics is determining which physiological measurements provide the most reliable indicators of mental workload. A collaborative team of researchers from France investigated how physiological measurements can be used to establish standardized levels of mental workload during aviation-inspired tasks. Using the Multi-Attribute Task Battery (MATB-II), participants performed simulated flight-related tasks under varying levels of demand while researchers measured EEG, eye-tracking, electrodermal activity, and cardiac activity. ECG and EDA signals were acquired using a BIOPAC data acquisition and analysis system running AcqKnowledge software. The study found that several cardiac, ocular, and electroencephalographic measures successfully distinguished high-workload conditions and correlated with subjective workload ratings. The researchers found that several physiological measures, particularly EEG, eye tracking, and cardiovascular metrics, reliably distinguished between different workload levels and closely tracked participants’ subjective assessments of task difficulty. Their findings suggest that multimodal physiological monitoring could support the development of adaptive systems that detect cognitive overload in real time, improving both performance and safety in demanding operational environments.

These studies highlight the increasingly multimodal nature of neuroergonomics research. Eye tracking provides insight into attention and visual processing, cardiovascular measures reveal how the autonomic nervous system responds to mental demands, and brain-imaging techniques such as EEG and fNIRS offer direct windows into neural workload. By combining these complementary perspectives, researchers are moving beyond simple measures of task performance toward a deeper understanding of how people think, adapt, and perform in complex environments. As workplaces continue to evolve alongside automation and intelligent technologies, neuroergonomics is helping researchers design systems that better support human capabilities, improve safety, and reduce the hidden costs of cognitive overload.


Are you planning a multimodal neuroergonomics study? Our team of experts can help you plan your research and identify the tools that will provide the best possible data.


The Nose Knows: Brain-Body Research and the Science of Olfactory Cognition

“Smell is a potent wizard that transports you across thousands of miles and all the years you have lived.” — Helen Keller

There is something uniquely intimate about the sense of smell. Unlike vision or hearing, olfactory signals travel a remarkably direct neural route from receptors in the nasal epithelium through the olfactory bulb, and straight into the brain’s limbic system, the seat of emotion and memory. A single scent can transport us instantly to a childhood kitchen, sharpen our alertness, or dissolve stress within seconds. Yet for all its power, olfaction has historically been one of the most understudied human senses. That landscape is changing. A new generation of multimodal brain-body research platforms, capable of simultaneously recording signals from the brain and the body, is giving scientists insight into how smell shapes thought, emotion, and cognition.

The olfactory system is the only sensory system that bypasses the thalamus, the brain’s central relay station, and connects directly to the amygdala and hippocampus, two structures critical to emotional processing (affect) and memory. This anatomical shortcut explains why odors are so potent at triggering emotional memories, often more vividly than visual or auditory cues. Beyond memory, researchers are increasingly interested in how odor exposure alters measurable physiological and neurological states in real time, ranging from modulating cognitive performance and stress to the early detection of neurodegenerative disease, in which olfactory dysfunction often appears years before other symptoms emerge.

What makes this research technically challenging is also what makes it scientifically rich: the olfactory experience simultaneously engages the central nervous system and the autonomic nervous system, meaning that studying it well requires capturing signals from both brain and body at once. Electroencephalography (EEG) provides direct data on the brain’s electrical activity with millisecond-level temporal resolution, making it well-suited to detecting rapid shifts in cognition and arousal following odor exposure. Functional near-infrared spectroscopy (fNIRS) offers a complementary picture, using near-infrared light to detect changes in cortical oxygenation, a measure of the brain’s metabolic response to stimulation. Wearable and tolerant of movement, fNIRS is particularly well-suited to naturalistic experimental designs. Electrodermal activity (EDA), or skin conductance, captures the autonomic nervous system’s arousal response through sweat gland activity, while electrocardiography (ECG) and heart rate variability (HRV) add a cardiovascular layer that can distinguish sympathetic from parasympathetic activity in fine detail. Today’s lab setups use a range of sophisticated scent delivery systems to integrate precise, controllable olfactory stimuli into experiments. The real power of modern multimodal platforms lies in their ability to synchronize all these channels within a single setup, time-locking each physiological response to a specific odor event and revealing the full brain-body picture that no single signal could show alone.

A research team at the All India Institute of Medical Sciences in Jodhpur investigated whether citrus odor could buffer the cognitive and physiological impact of working memory load. Thirty participants completed a demanding working memory test under both control and citrus-odor conditions, with the odor delivered via an aroma diffuser. ECG, photoplethysmography (PPG), and EDA were recorded using a BIOPAC data acquisition system with AcqKnowledge software for analysis, and dual-signal BioNomadix wireless EDA and PPG module. For EDA recording, disposable silver/silver chloride disc electrodes were applied to the hypothenar and thenar eminences, and the PPG sensor was placed on the index finger. Citrus odor significantly improved task accuracy while suppressing the rise in skin conductance typically associated with cognitive load. HRV measures, including pNN50, RMSSD, and HF power, shifted toward parasympathetic dominance, indicating a calmer, more regulated physiological state. The findings, published in the Annals of Neurosciences, suggest that citrus odor acts as a cognitive stress buffer and point to practical applications in educational, occupational, and clinical settings with high sustained cognitive demands.

A counterintuitive question motivated a study at Nagaoka University of Technology in Japan: could black pepper, widely known as a stimulant, actually calm the body’s stress response? A group of university students performed a 30-minute arithmetic calculation task under three aroma conditions: black pepper, ginger, and a scentless control. Scents were delivered at precise, reproducible intervals through an olfactometer. A BIOPAC data acquisition system recorded continuous ECG and skin conductance level (SCL) at 200 Hz with 16-bit resolution, with high-frequency HRV (HF-HRV) derived as a measure of cardiac parasympathetic activity. Electrodes were placed beneath the right clavicle and on the lower left abdomen following the Lead II placement protocol for ECG measurements using multi-lead ECG cables. SCL was recorded using skin conductance sensors placed on the palmar side of the middle phalanx of the index and ring fingers of the participant’s non-dominant hand. The results, published in the Journal of Physiological Anthropology, found that black pepper aroma reduced the stress-induced rise in heart rate by 38.9% compared to the scentless control, attenuated the decline in HRV by 32.9%, and blunted the increase in SCL compared to ginger. Crucially, subjective stress ratings did not differ across conditions, demonstrating that the body can respond to olfactory stimuli at a physiological level even when conscious perception does not register a difference. These findings have meaningful implications for workplace wellness and aromatherapy research.

lavenderA French consortium of researchers from the Université Bourgogne Franche-Comté and the Université Grenoble Alpes tested whether music, lavender odor, or their combination would accelerate autonomic recovery following acute cognitive stress. Ninety-nine participants completed a battery of cognitively demanding tasks. They were then randomly assigned to one of four 30-minute recovery conditions: silence, relaxing classical music, lavender essential oil, or music and lavender together. A data acquisition system running AcqKnowledge continuously recorded ECG and EDA using Ag-AgCl finger electrodes, with HF-HRV as an index of parasympathetic activity and EDA as a measure of sympathetic arousal. Published in Psychophysiology, the study found that both music and lavender independently facilitated autonomic recovery. The surprising finding, however, was the absence of any multisensory advantage: combining the two stimuli produced no greater benefit than either alone, suggesting that when multiple sensory channels converge on the same relaxation goal, they may share rather than combine their neural resources. The study underscores both the value of multimodal physiological recording in parsing the mechanisms of stress recovery and the importance of rigorously testing assumptions about how the senses work together.

These studies illustrate how much remains to be discovered at the intersection of smell, brain, and body, and how essential it is to measure all three at once. As synchronized multimodal platforms continue to evolve, the science of olfactory cognition continues to shape our fundamental understanding of how the brain works and the development of practical tools to support cognitive health and wellbeing. To learn more about the convergence of olfaction with brain-body research, be sure to check out our webinar on how scents influence cognition.


If you are planning a brain-body study that integrates multimodal data collection with stimulus presentation like scent delivery, our expert staff is ready to help find everything you need to get started.

Tick, Tock: Pulse Transit Time Offers Noninvasive Physiological Insights

A split second can reveal much about the cardiovascular system and the other physiological systems it influences. Pulse Transit Time (PTT) captures one of those critical moments, the brief interval it takes for the pressure wave generated by contraction of the left ventricle to travel from the heart to a peripheral site in the body. That tiny stretch of time tells us something important about the arteries—namely, how stiff or flexible they are in that moment. When blood pressure rises and the vessel walls tighten, the pulse wave travels more quickly, so PTT gets shorter. When the vessels are relaxed and more elastic, the wave slows down, and PTT becomes longer. Because of this back-and-forth relationship, PTT gives researchers a simple, noninvasive way to track changes in vascular tone, blood flow dynamics, and autonomic nervous system activity.

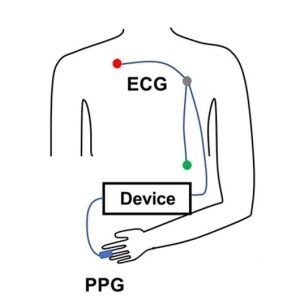
PTT is determined by measuring the volume or pressure pulse at a proximal artery (such as the carotid or brachial) and at a distal artery (such as the finger or toe). To prevent confusion in PTT nomenclature across different methods, some researchers use labels formed from the first one or two letters of the starting and arrival signals. PTT-PP refers to PTT recorded using PPG between a proximal and a distal artery, PTT-EP refers to PTT measured between electrocardiogram (ECG) proximally and photoplethysmogram (PPG) distally and PTT-IP refers to PTT recorded between Impedance Cardiogram proximally and PPG distally.

PTT-EP is recorded by simultaneously recording ECG and PPG. PPG is usually recorded at the finger using a small infrared light to detect changes in blood flow with each heartbeat. As blood pulses into the area, the amount of light absorbed changes, creating a waveform with a clear rise and peak. To calculate PTT-EP, researchers measure the time between the ECG spike and a specific point on the PPG wave, typically the point at which the wave first rises or reaches its peak. Strictly speaking PTT-EP is not a true PTT as it includes pre-ejection period, a short delay between electrical activation of the ventricles and actual ejection of blood. For that reason, it is sometimes referred to as Pulse Arrival Time (PAT). Even so, the ECG-to-PPG approach remains widely used because it is noninvasive, reliable, relatively inexpensive, and straightforward to implement across a range of study designs.

Typical lab configurations focus on integrated, multimodal data acquisition systems that allow researchers to record ECG and PPG signals simultaneously using dedicated amplifier modules, with analysis performed via software. These systems enable precise channel synchronization, automated waveform feature detection, beat-by-beat PTT computation, and data export for statistical analysis. In some studies, researchers also integrate noninvasive blood pressure (NIBP) modules to directly examine the relationship between PTT and systolic or mean arterial pressure, strengthening the interpretation of vascular changes.

Obtaining high-quality PTT data requires attention to detail and careful planning. Participants should rest in a quiet, temperature-controlled room, since vascular tone can be affected by stress, ambient temperature, and sympathetic activation. Avoid testing immediately after meals or the consumption of caffeine or nicotine, which can alter cardiovascular dynamics. Proper sensor placement and stable contact pressure are critical for minimizing motion artifacts and waveform distortion. Consistent measurement timing, accounting for diurnal variation, helps ensure consistent data quality across sessions. Signal processing choices also matter. Careful filtering (see example study below), accurate event marking, and careful peak or foot detection are essential to ensure that the measured interval truly reflects physiological timing rather than processing artifacts.

When these best practices are followed, PTT becomes a versatile research tool. It has been used to study stress reactivity, autonomic regulation, arterial stiffness, posture-related hemodynamics, exercise physiology, sleep physiology, and the development of cuffless blood pressure estimation technologies. Recent studies illustrate both the promise and the practical considerations of PTT measurement.PTT Diagram

At the Georgia Institute of Technology, researchers explored whether noninvasive nerve stimulation applied at the ear, neck, or wrist could reduce acute stress responses in healthy young adults. During laboratory sessions that included mental arithmetic and cold exposure tasks, cardiovascular signals were recorded using a BIOPAC MP data acquisition unit and a PPG100C to capture ECG and fingertip PPG. PTT served as a key marker of sympathetic (“fight-or-flight”) activation. The research team found that stimulation at the ear and wrist significantly reduced stress-related cardiovascular changes compared to a sham condition, supporting the potential for wearable systems that integrate neuromodulation and real-time cardiovascular monitoring.

In another study published in Nature, researchers at Columbia University tackled a common problem in cuffless blood pressure monitoring: when wearable sensors sit above or below heart level, changes in arm position create hydrostatic pressure errors that skew estimates based on PTT. Cuffless systems frequently use PTT to estimate blood pressure, but arm movements can distort that timing and reduce accuracy. To investigate this, the team collected synchronized physiological data using a BIOPAC data acquisition system to record high-resolution ECG signals via a BIOPAC ECG amplifier and fingertip PPG signals via BIOPAC PPG100C, while a BIOPAC NIBP module measured reference blood pressure using upper-arm and finger cuffs. Participants also wore wrist and upper-arm inertial sensors (IMUs) to track how the arm was positioned relative to the heart. The research team then developed a method called IMU-Track, which uses motion data and deep learning to correct PTT for arm height effects, improving the accuracy of blood pressure predictions across different postures. Their findings showed that accounting for sensor position dramatically reduced errors in cuffless blood pressure estimation, suggesting that combining motion tracking with PTT measurements could make wearable BP monitoring more reliable in everyday use.

When applied correctly, PTT provides a potent, noninvasive tool for assessing cardiovascular function—one measured in milliseconds but capable of revealing meaningful physiological change. For more information on integrating PTT into research, see our PTT webinar.


If you are planning to use PTT in your next study, don’t hesitate to reach out for our highly capable team of experts for assistance in identifying the equipment and procedures to ensure your success.

TREV Q&A: Unpacking Trans-radial Electrical Bioimpedance Velocimetry

As researchers look for cleaner, more direct ways to capture sympathetic nervous system (SNS) activity, Trans-radial Electrical Bioimpedance Velocimetry (TREV) has emerged as a powerful new approach for measuring beat-by-beat changes in cardiac contractility to index sympathetic drive.headshot To explain how the technique works and where it fits alongside more established measures, we sat down with Viktoriya Babenko, PhD, BIOPAC’s in-house TREV expert and research specialist. Babenko helps researchers implement advanced cardiovascular and autonomic measurements, combining her extensive hands-on experience with bioimpedance technologies and a strong grounding in the interpretation of physiological signals. In the Q&A below, she describes the physiological principles behind TREV, how it differs from traditional electrodermal activity (EDA), electrocardiogram (ECG), and impedance cardiography (ICG) approaches, and why it offers a uniquely direct and practical window into sympathetic drive for both laboratory and neuroimaging research.
At a high level, what is Trans-radial Electrical Bioimpedance Velocimetry (TREV), and what does it measure?

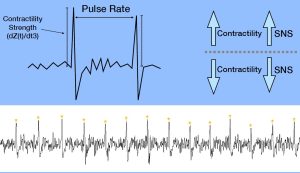
TREV is a noninvasive method for estimating cardiac contractility as a continuous, beat-by-beat index of SNS activity. Rather than measuring bioimpedance across the chest like traditional ICG, TREV measures impedance changes across the radial and ulnar arteries of the forearm.

As the heart contracts, it generates a pressure wave that travels through the arterial system and causes red blood cells to momentarily align. This alignment reduces electrical resistance in the blood, which TREV continuously tracks. The impedance signal measured by TREV provides velocity, acceleration, and ultimately a contractility index, where stronger contractions reflect greater sympathetic drive.

Why is cardiac contractility such a useful index of SNS activity?

Cardiac contractility reflects the vigor with which the heart contracts during each heartbeat and is strongly modulated by sympathetic tone, either through direct neural innervation or circulating catecholamines like epinephrine. Increased sympathetic activation leads to stronger, faster contractions, while reduced sympathetic drive results in weaker contractile force.

Because of this close physiological relationship, contractility is considered one of the most direct and objective noninvasive measures of SNS activity. Unlike heart rate alone, which reflects both sympathetic and parasympathetic influences, contractility provides a more targeted window into sympathetic drive specifically.

How does TREV differ from traditional ICG- or ECG-based approaches?

Traditional approaches for indexing sympathetic drive, such as combining ECG and thoracic ICG to extract the pre-ejection period (PEP), are powerful but complex. They typically require 10 electrodes placed across the neck, chest, and torso, along with careful preprocessing and time-based feature extraction between both ICG and ECG to get PEP.waveform

TREV dramatically simplifies this process by using just four strip electrodes placed on the forearm. The resulting contractility waveform produces a single sharp peak per heartbeat, where the amplitude directly reflects contractile strength. Analysis is as simple as extracting peak amplitudes, rather than identifying precise timing relationships across ECG and ICG signals, making TREV faster to set up and easier to analyze.

What is the physiological rationale for using the forearm and radial and ulnar arteries as the measurement site?

The radial and ulnar arteries provide a relatively simple and accessible vascular model that is well-suited for bioimpedance measurements. When the heart contracts, a pressure wave propagates rapidly through the arterial tree and reaches the forearm, aligning red blood cells even before bulk blood flow arrives.

This pressure-wave-driven alignment is sufficient to cause measurable drops in impedance, allowing TREV to estimate cardiovascular dynamics without the anatomical and physiological complexity of the thorax. Measuring at the forearm also reduces sensitivity to respiratory and pulmonary effects that complicate thoracic impedance measurements.

What cardiovascular or hemodynamic parameters can be derived from TREV?

TREV provides estimates of blood velocity, acceleration, and the integral of velocity (blood position) derived from the impedance waveform. Most importantly, the second derivative of the impedance signal yields a contractility index (blood flow “jerk”) that reflects sympathetic modulation of the heart on a beat-by-beat basis.

While multiple parameters are available, BIOPAC primarily recommends TREV as a tool for tracking cardiac contractility over time, particularly in studies interested in stress, arousal, motivation, and cognitive or emotional processes linked to sympathetic activation.

What does a typical TREV measurement session look like, from setup to data output?equipment

Once the arm is clean and dry, four hydrogel strip electrodes (EL526) are placed on the forearm and connected via the CBL246 adapter to the NICO100D system. I recommend watching the TREV Webinar titled “A Simple Next-Gen Method for Stress Research: TREV” for step-by-step guidance on electrode placement.

During data collection, the participant’s arm must remain fully supported and relaxed, ideally with the elbow and forearm stabilized through the wrist to minimize muscle activity. When collected under proper conditions, TREV produces a clean, continuous contractility waveform with one peak per heartbeat, allowing for straightforward beat-by-beat analysis of sympathetic drive.

What advantages does TREV offer compared to ECG, EDA, or other stress-related measures?

Many commonly used physiological signals, such as heart rate, blood pressure, or heart rate variability, are influenced by multiple factors, including hydration, temperature, respiration, and both branches of the autonomic nervous system (parasympathetic and sympathetic nervous systems). EDA provides a sympathetic index, but it is relatively slow, delayed, and indirect, reflecting eccrine sweat gland activity modulated by the SNS rather than cardiovascular dynamics.

TREV fills an important gap by offering a fast, dynamic, and more direct measure of sympathetic drive through cardiac contractility. It combines the physiological specificity of ICG-derived measures with a much simpler setup and analysis pipeline, making it especially attractive for experimental and applied research settings

What are the main challenges in acquiring clean, interpretable TREV data?

The primary challenge with TREV is its sensitivity to motion artifact. Muscle activity in the forearm generates electromyography (EMG) signals that are much larger than the impedance changes of interest and can easily overwhelm the TREV signal.

For this reason, careful experimental control is essential. The participant’s arm should be fully supported, relaxed, and free from movement or strain, while other body movements are generally permissible. When these conditions are met, TREV data quality is excellent, but the method does demand attention to posture and comfort.

In what research or applied settings is TREV showing the most promise?

TREV is particularly well-suited for research at the intersection of stress, cognition, emotion, and autonomic physiology. It has been successfully used in laboratory studies examining sympathetic responses to cognitive and emotional stressors, as well as in MRI environments to enable the simultaneous study of neural activity and SNS dynamics.

Across both standard laboratory settings and neuroimaging environments, TREV provides a continuous, beat-by-beat index of sympathetic activity, making it especially valuable for event-related experimental designs where precise timing and dynamic changes in autonomic responses are of interest. In the MRI specifically, this temporal resolution allows researchers to directly link moment-to-moment fluctuations in sympathetic drive with neural processes measured using functional MRI (fMRI), offering a powerful framework for studying how brain activity and cardiovascular sympathetic responses interact during task performance, affective processing, or stress-related appraisals. As with most MRI-based physiological measurements, specific hardware configurations and safety considerations apply, and researchers should contact the BIOPAC support team before data collection to ensure proper setup and compliance.

How does TREV perform in dynamic or real-world conditions, such as movement or exercise?

At present, TREV performs best in controlled conditions where the forearm can remain fully supported and at rest. Simple movements while seated may be permissible, provided that the arm containing the TREV electrodes remains immobile and relaxed. Due to its sensitivity to motion, TREV is not currently recommended for continuous data collection during active movement or exercise.

That said, TREV can still be extremely valuable in movement- or exercise-related research by comparing pre- and post-task states. This approach allows researchers to quantify sympathetic changes associated with physical or psychological challenges without collecting data during movement itself.

Looking ahead, how do you see the TREV method evolving over the next five to ten years?

As validation studies continue and more researchers adopt the method, TREV is likely to become a standard tool for indexing sympathetic drive in both basic and applied research. Ongoing work, including peer-reviewed publications, will further refine interpretation, best practices, and experimental design considerations.

In the longer term, improvements in signal processing, hardware integration, and multimodal data collection may expand TREV’s use into more naturalistic settings, helping bridge the gap between controlled laboratory studies and real-world physiological monitoring.


If you are planning a study and would like to learn more about integrating TREV, our team of experts can help guide you to the right equipment and strategies.

Related posts: Body Electrictric: Bioimpedance in Physiology Research and ‘Tis the Season for Stress: Research Tools for Anxious Times

Game On: Applying Physiological Data in Video Game Design and Research

Ever since players first started feeding quarters into arcade games and began plugging in home systems in the late twentieth century, researchers have looked for practical tools for both shaping video game design and measuring their effects on players. Physiological signals filled this niche area of research. Researchers began investigating the connection between physiological science and gaming in the 1980s and 1990s, when early studies explored the effects of video games on heart rate and arousal. These first studies focused on issues such as aggression and overstimulation, but research has since expanded to encompass the cognitive and emotional aspects of gameplay. An early research project by NASA, for example, examined how biofeedback could be applied to game design to enhance traditional game control methods while also improving players’ cognitive abilities.

Today, physiological monitoring is not only a method for psychological inquiry but also a vital asset in improving user experience (UX) research, game accessibility, and even driving therapeutic game development. As wearable sensors and game engines grow more sophisticated, the integration of physiological signals into game design is opening new frontiers for immersive, responsive, and health-conscious gaming. By analyzing real-time bodily signals, such as heart rate (HR), electroencephalography (EEG), electromyography (EMG), electrodermal activity (EDA), respiration, photoplethysmography (PPG), and electrooculography (EOG), researchers and developers can gain a deeper understanding of how players emotionally and physically respond to game elements.

A study published in the International Journal of Human-Computer Studies investigated whether players’ self-reported preferences for first-person shooter (FPS) game dynamics match their emotional reactions during both gameplay and viewing. Researchers recruited 24 active gamers and divided them into two groups: those who enjoyed the fast-paced action of FPS games and those who didn’t. While participants played an FPS game and later watched a recording of it, the team measured electrodermal activity (EDA), heart rate, and facial muscle responses, specifically expressions associated with frowning (corrugator supercilii) and smiling (zygomaticus major), to capture emotional arousal and valence. Physiological signal data were recorded using BIOPAC EDA, PPG, and EMG amplifiers, which were connected to a data acquisition and analysis system running AcqKnowledge software. Although both groups reported more positive feelings and higher excitement after actively playing rather than watching, the data revealed a deeper story: players who disliked the game showed more substantial rises in arousal during play. Those who favored the dynamics, however, showed steadier emotional responses across both conditions. Muscle activity patterns also differed. Those who enjoyed FPS dynamics exhibited sharper increases in frowning-related muscle activity during play than watchers, indicating nuanced emotional engagement. Overall, the study found that what people say they prefer does reflect in their bodies’ emotional reactions. Still, those preferences also shape whether playing or spectating feels more intense, highlighting how combining self-reports with physiological signals can deepen an understanding of game design and player experience.

controllerA team of researchers from Bournemouth University’s Centre for Digital Entertainment investigated how players’ bodies react during intense engagement, or flow, in virtual reality (VR) games. The goal was to capture objective physiological signals, such as heart rate and eye-blink patterns, alongside subjective self-reports to see how well a game’s design induced flow versus boredom or anxiety. The researchers had participants play a custom VR “tower defense” game while monitored with BIOPAC equipment, including a two-channel Biopac Student Lab (BSL) data acquisition system and physiological modules to record HRV via ECG, as well as EOG and EEG signals. The team then utilized clustering and machine-learning classifiers to decode flow states with high accuracy. The research team also successfully identified that high flow correlated with fewer blinks and longer blink intervals, indicating a state of deep concentration. The study not only demonstrates the value of combining physiological and self-report data but also shows how wearable sensors can inform design decisions in VR games by providing real-time feedback on player experience.
Beyond game design, a primary area of research focus has been on the long-term psychological, neurological, and physiological impact that games have on players. A study published in the Journal of Media Psychology explored how experiences with violent video games might reduce prosocial behavior, such as the motivation to help others, through physiological changes. Researchers recruited 155 Chinese college students who reported their exposure to violent games (in terms of violence, bloodiness, and duration) and completed simple self-reports measuring their willingness to help and the time they took to help others in controlled scenarios. Researchers used a BIOPAC data acquisition unit running AcqKnowledge software to record relevant physiological data. A three-lead ECG amplifier, respiration module, and respiration belt were used to record ECG and breathing signals across baseline, violent-film task, and during recovery periods. Researchers calculated the reduction in respiratory sinus arrhythmia (RSA), a marker of parasympathetic nervous system engagement. They found that higher levels of violent-game experience predicted less RSA reduction during stress, which in turn was linked to reduced prosocial behavior. The study’s findings suggest that playing violent video games may impair physiological readiness to respond in an empathetic manner to others, showing RSA reduction to be a key influence. The study’s findings demonstrate how physiological and psychophysiological signals provide a deeper understanding of the impacts of video games, while also guiding design decisions.

Physiological signals help researchers identify moments of excitement, stress, immersion, or frustration. Such insights are increasingly being used to refine gameplay mechanics, balance difficulty, and enhance player engagement through adaptive or personalized game experiences. They also reveal the short- and long-term effects gameplay has on both individuals and society. For more ideas on how to apply these signals in your research, visit our Webinars page for information on wearable devices, mobile data acquisition, and other helpful topics.


Are you planning a research project related to video games? Reach out to our customer service specialists to get all the help you need in mapping out and equipping your study team.

A System of Systems: Network Physiology Connects the Dots

In the field of physiology, it is tempting to see the human body as a collection of independent systems performing a range of functions—converting food to energy, protecting us from harm and disease, and helping us react to and interact with our environments, to name a few. It is easy to overlook that these systems often work together and are interconnected. The field of network physiology does just that—look at how these systems (nervous, cardiovascular, muscular, etc.) work together, seeing them as part of a dynamic network rather than a collection of independent parts.

The author of the article linked above, Boston University research professor of physics Plamen Ivanov, first coined the term “network physiology” in 2006. Through his work as director of the Keck Laboratory of Network Physiology, Ivanov and his team pioneered research in this new and rapidly growing field. The latest research methods, breakthroughs, and ideas in network physiology will take center stage this summer at the Fourth International Summer Institute on Network Physiology (ININP) hosted at the Lake Como School of Advanced Studies in Italy.

Researchers are exploring various ways to apply the concepts of network physiology, including how stress affects both the brain and the body. Medical researchers are looking into how to identify early warning signs of future health problems in how various physiological systems interact when developing treatments that address multiple bodily systems. While this may sound like the multimodal approach to physiology—collecting data simultaneously and synchronously from multiple systems—the two terms are not synonymous. Network physiology uses multimodal methods to collect data, but goes further by connecting the dots between the various systems.

A study by a team of researchers from the University of New York and the University of Houston demonstrated how combining data from different body systems can give a more complete picture of how the brain and body work together, specifically in response to music and mental effort. The study explored how different types of music—either calming or exciting—affect a person’s working memory (the ability to retain and use information for short periods) and overall brain and body arousal. During the experiment, participants completed memory tasks while listening to either calming or exciting music. Researchers collected detailed data from the body using a set of BIOPAC sensors and electrodes, including general-purpose electrodes for gathering electrocardiogram (ECG) signals, a respiratory effort transducer, a wireless skin temperature sensor, a wireless pulse transducer for photoplethysmogram (PPG) data, and electrodes to measure electrodermal activity (EDA), blood flow in the finger, and muscle activity in the shoulders. These multimodal signals were gathered using a BIOPAC data acquisition and analysis system. The data was collected at 2 kHz to capture even small changes in the body’s responses. The research team found that while the difficulty of the memory tasks didn’t significantly impact arousal levels, the type of music did. Exciting music helped participants feel more alert and even improved their performance on some tasks.

connected manA 2024 South Korean study investigated how the autonomic nervous system (ANS) responds differently to social pain (such as emotional distress from losing a loved one) versus physical pain (like discomfort from a pressure cuff). Researchers used a BIOPAC 16-channel data acquisition and analysis system running AcqKnowledge software to collect a range of signals from 73 healthy young adult participants. The following signals were gathered synchronously using a variety of sensors and transducers: ECG electrodes placed on both wrists and the left ankle to monitor heart activity, EDA sensors attached to the index and middle fingers to assess skin conductance (indicating stress levels), PPG sensor on the thumb to measure blood volume changes, chest-wrapped sensor to track breathing patterns, and a temperature sensor on the ring finger to monitor peripheral temperature changes. Participants experienced social pain via a 60-second grief-themed film clip and physical pain through a blood pressure cuff inflated to 250 mmHg. Social pain increased heart rate and skin conductance, while lowering blood volume pulse, pulse transit time, breathing rate, and finger temperature, reflecting a mix of sympathetic and parasympathetic nervous system activity. Physical pain, on the other hand, raised heart rate variability and skin conductance, reduced blood volume pulse and pulse transit time, but left finger temperature unchanged, suggesting activation of the body’s stress response system. These distinct patterns show how different types of pain trigger unique responses across interconnected body systems.

A multimodal approach was employed in a study by researchers from several institutions including the University of Southern California, University of California, Irvine, Rutgers University, Vanderbilt University, and Wayne State University School of Medicine to examine how daily heart rate variability (HRV) biofeedback training influences brain function, emotional regulation, and physiological responses in both younger and older adults. In the study, 193 participants were randomly assigned to either increase or decrease their heart rate oscillations through daily biofeedback sessions over five weeks. Before and after the intervention, participants underwent various assessments, including MRI scans, psychological evaluations, and sleep monitoring using wristband sensors. During the MRI sessions, physiological data such as blood pressure, pulse, respiration (using a BIOPAC MRI-safe respiration transducer and module), and end-tidal CO₂ were continuously recorded. During stress tasks, blood pressure and hemodynamic measurements were taken using a noninvasive blood pressure monitor and transferred to a BIOPAC data acquisition and analysis system. The study’s findings suggest that HRV biofeedback can positively impact both brain function and physiological health, highlighting the interconnected nature of bodily systems, a central concept in network physiology.

These are just a few examples of how network physiology is being applied in research today. For more information on the topic, including links to related webinars, citations, and events, see our Network Physiology applications page.


Are you planning to integrate a range of signals for your next network physiology study? Our customer service specialists can help identify the best equipment and strategies for the synchronous collection of high-quality multimodal data.

Mind-Body Connection: Biofeedback in Research

The connection between the mind and body has long intrigued scientists, driving research into how our thoughts, emotions, and mental states can influence physical health and well-being. Biofeedback has become a recognized approach for helping people manage stress, reduce pain, and even enhance cognitive and physical performance. Biofeedback involves using sensors and real-time data to monitor physiological functions that are typically automatic, such as heart rate, breathing, muscle tension, and skin conductance. With this information, individuals can learn to gain greater awareness and, in some cases, voluntarily control these bodily processes.

Common physiological signals used in biofeedback include electrodermal activity (EDA), which reflects sweat gland activity and emotional arousal; electroencephalogram (EEG), which measures electrical activity in the brain; electrocardiogram (ECG), which measures heart electrical activity; heart rate variability (HRV), an index of autonomic nervous system flexibility; and respiration rate, among others. These signals offer researchers a window into the body’s stress responses, regulatory mechanisms, and even aspects of cognition and emotional control.

To complement physiological monitoring, researchers are increasingly integrating tools like stimulus presentation systems, virtual reality (VR) environments, and eye tracking technology into biofeedback studies. These tools allow scientists to study how people react to controlled stimuli, immerse participants in realistic scenarios, and track where and how long someone focuses visually, all while collecting detailed data on their physiological responses. This combination of immersive experiences and real-time monitoring helps researchers investigate how the body responds to stress or cognitive challenges and whether individuals can be trained to influence those responses.

Swiss researchers at ETH Zurich investigated whether individuals could voluntarily control their arousal states using real-time feedback on their pupil size. Pupil size is a physiological marker closely linked to the brain’s arousal systems, particularly the locus coeruleus. Study participants employed mental strategies to adjust their pupil diameter, receiving visual feedback through a dynamically changing circle that reflected their pupil size. The participants’ cardiovascular data, including ECG and respiration, were recorded to provide insights into the physiological effects of pupil self-regulation. The research team employed a BIOPAC data acquisition and analysis system running AcqKnowledge software to record ECG data continuously at a sampling rate of 1,000 Hz. Additionally, a BIOPAC respiratory effort transducer was used to measure respiration, although these respiratory data were not reported in the publication. The study’s findings demonstrated that pupil-based biofeedback enabled participants to modulate not only their pupil size but also associated neural activity and cardiovascular responses, such as heart rate. The results suggest a non-invasive method for individuals to control their autonomic functions, with potential applications in managing stress and anxiety disorders.

mind-bodyVagally mediated heart rate variability (vmHRV) refers to the natural changes in the time between heartbeats that are controlled by the vagus nerve, which is closely tied to how well a person can adapt to stress and regulate their body. Researchers from Université Paris Cité explored whether a brief session of vmHRV biofeedback could help people better control their memory, specifically whether it could help them tell the difference between real and false memories. In the study, 71 healthy young adults completed a VR memory task after receiving either vmHRV biofeedback or a simple breathing exercise. To track their physiological responses, the team used a BIOPAC data acquisition and analysis system and recorded heart activity via a three-lead ECG configured according to Einthoven’s triangle using Lead II. The results showed that this short biofeedback session had no immediate effect on memory accuracy or on vmHRV levels during the task. This suggests that a single session of HRV biofeedback may not be enough to influence memory-related brain functions, underlining the complex relationship between the body’s stress responses and cognitive control.

​A study published in the Journal of Human Kinetics looked at whether just one 10-minute session of HRV biofeedback, using a special breathing technique called resonance frequency breathing, could affect the level of activity of certain nerve cells. Researchers measured this by looking at a reflex in the lower leg muscle (the soleus) called the Hoffman reflex (H-reflex). Twelve healthy men took part in both the HRV biofeedback session and a regular breathing session in a random order. To measure muscle activity, researchers used a BIOPAC surface electrode on the leg and a reference electrode on the hand. The signals were recorded with a BIOPAC data acquisition system and analyzed with AcqKnowledge software, which helped line up the timing of muscle activity with electrical stimulation. The results showed that HRV biofeedback lowered the strength of the reflex and a related ratio (Hmax/Mmax), suggesting the spinal nerve cells were less excitable. These findings point to the potential of short HRV biofeedback sessions to affect the nervous system in ways that could be useful for physical therapy or improving movement control.

To learn more about how to integrate biofeedback techniques into your next research project, check out BIOPAC’s webinar, Biofeedback: Theory, Techniques, and Tools for Research.


Are you planning a research project that will utilize biofeedback data? Our expert customer service representatives can help you find the right tools for all your biofeedback needs.


Only the Lonely: The Human Impact of Social Isolation

Humans by their nature are social creatures. A sense of community, daily interactions, and shared experiences are tied to our overall mental and physical well-being. Few events in modern history have shut down such interactions more thoroughly than the outbreak of COVID-19, which forced millions into prolonged isolation. As lockdowns and social distancing became the norm, an increasing number of people reported heightened feelings of loneliness, anxiety, and depression. Beyond the pandemic, other modern social factors contribute to isolation, including the growing reliance on social media and virtual interactions in place of face-to-face connections. While technology offers new ways to stay in touch, excessive screen time and digital communication can sometimes deepen feelings of loneliness by reducing meaningful, in-person social engagement. In the wake of these societal shifts, researchers are working to understand the long-term consequences of social isolation on both mental and physical health.

Studies suggest that loneliness isn’t just an emotional experience—it has measurable physiological effects on the body. Using advanced biometric signals, researchers are trying to uncover how isolation influences our nervous system, stress responses, and overall wellness. Heart rate variability (HRV) provides insights into autonomic nervous system balance, while electrodermal activity (EDA) reflects changes in stress and emotional arousal. Respiration patterns, electromyography (EMG) readings, and other physiological markers help paint a complete picture of how isolation affects both mind and body. By combining psychological assessments with physiological data, scientists aim to better understand how chronic loneliness can contribute to conditions such as cardiovascular disease, weakened immune function, and mental health disorders.

In one such study published in Britain’s Royal Society Open Science journal in 2024, researchers looked at the effect of social isolation on human adolescents, specifically their ability to learn to perceive threats. Study participants between the ages of 16 and 19 underwent sessions of complete isolation and isolation combined with virtual social interaction, as well as baseline sessions. Following each session, study participants reported their psychological state and completed a threat learning task (participants learned to associate neutral shapes with an aversive sound) to measure physiological response to learned threats and safety cues. During these sessions, researchers recorded participants’ EDA signals using BIOPAC EDA finger transducers connected to an MP36R data acquisition and analysis system running AcqKnowledge software. Results showed heightened EDA levels during threat extinction following isolation compared to the baseline. Researchers reported that their findings suggest that isolation and loneliness among adolescents might increase vulnerability and increase the instances of emotional disorders such as phobias, anxiety, and obsessive-compulsive disorder (OCD).

A team of researchers in Brazil compared how giving and receiving of social touch as well as heart rate variability serve as accurate predictors of loneliness in college-age adults. Participant loneliness levels were measured using the UCLA Loneliness Scale. Participants completed a psychiatric screening questionnaire that reported loneliness, social support, and social touch levels. Participant HRV measurements were taken via electrocardiographic (ECG) signal processing using a BIOPAC ECG amplifier connected to a 16-channel MP data acquisition and analysis system running AcqKnowledge. According to the researchers’ published findings, “social support and social touch, specifically receiving touch, accounted for a significant proportion of the variance in loneliness. However, neither giving touch nor resting HRV was a significant predictor of loneliness.”alone

A study by researchers from the University of Bonn examined the link between loneliness and how males and females process trauma and react to fear-inducing stimuli. Over three days, participants were exposed to experimental trauma and evoked intrusive thoughts. Researchers employed functional magnetic resonance imaging (fMRI) scans to assess neural habituation to fearful faces and fear learning (conditioning and extinction) before trauma exposure. Fear conditioning and extinction tasks used a BIOPAC MP system to deliver stimulus in the form of electric impulses. EDA and respiration data were recorded using the BIOPAC data acquisition and analysis system. Study results revealed “a significant interaction between loneliness and sex such that loneliness is associated with more intrusions in men, but not in women.” The implication is, according to the study’s authors, “that loneliness may confer vulnerability to intrusive memories after trauma exposure in healthy men and that this phenotype relates to altered limbic processing of fear signals.”

As the physiological and psychological effects of the COVID-19 pandemic continue to resonate and we grapple with the isolating influence of technology, increasing numbers of research studies are being launched to measure these impacts. Studies into human isolation and loneliness represent just one small corner of a broad spectrum of research on the topic. For information on how BIOPAC equipment is being used in such research areas, check out our on-demand webinars for additional ideas on how to deploy BIOPAC resources in your next study.


Are you planning a research project investigating the effects of isolation, loneliness, or other related subjects? Reach out to our team of experts to help you get started with the right resources and equipment.


Everybody Hurts: Studying the Physiological and Neurological Components of Pain

A Buddhist saying states, “Pain is inevitable, but suffering is optional.” Pain’s dual nature has presented a conundrum for philosophy and the sciences. As a warning system, it protects us from harm, but it can also be the source of profound psychological and emotional damage. Pain is a complex and deeply subjective experience, yet it is one of the most critical areas of study in neuroscience.

Understanding pain involves not only exploring its physical origins but also decoding the neural circuits and physiological signals that contribute to its perception and regulation. Neuroscientific research into pain aims to answer fundamental questions about how pain is processed in the brain, how it varies from person to person, and how we can develop better treatments for chronic conditions.

This research uses various physiological signals to provide insights into pain mechanisms. Electroencephalography (EEG) captures brainwave activity, revealing how different regions of the brain respond to painful stimuli. Photoplethysmography (PPG) tracks blood flow changes, while electrocardiography (ECG) and skin conductance response (SCR) measure autonomic nervous system activity, offering clues about how the body reacts to stress and discomfort. Respiration patterns, too, are key indicators, as breathing can change in response to pain. Together, these signals help scientists map the body’s response to pain, shedding light on the underlying neural pathways and guiding the development of more effective pain management strategies. Understanding these physiological markers is a critical step toward personalized pain care and improving the quality of life for millions worldwide.

Pain research commonly focuses on the neurological mechanisms of pain to better understand its causes and how it can be treated. Researchers publishing their findings in the Journal of Biomedical and Health Informatics developed a device for studying pain perception biomarkers using thermal stimulation. Their device generates minutely controlled thermal stimuli using a computer-driven Peltier cell while simultaneously capturing EEG and PPG signals. Researchers identified the heat pain threshold (HPT) for each subject, defined as the maximum the subject can withstand when the Peltier cell gradually increases the temperature. The team used two-dimensional spectral entropy (SE) obtained from both the EEG and PPG signals to differentiate the condition of pain. EEG and PPG signals were fed to a BIOPAC MP36 data acquisition and analysis system running Biopac Student Lab (BSL) software. The study concluded that hemodynamics, brain dynamics, and their interactions can be used to discriminate thermal pain perception, which could have practical applications in monitoring pain perception. Possible applications include the study and treatment of “pathologies that affect the peripheral nervous system, such as small fiber neuropathies, fibromyalgia, or painful diabetic neuropathy.”

The pain mechanism associated specifically with fibromyalgia, one of the most common chronic pain disorders, was the focus of a study at the University of Jae´n in Spain. Despite its prevalence, much is still unknown about the underlying cause of this condition. Clinical and experimental studies of individuals diagnosed with fibromyalgia syndrome (FMS) have revealed autonomic nervous system (ANS) deficiencies. While both the parasympathetic and sympathetic components of the ANS have been studied, less is known about the sympathetic component as it relates to FMS. In this study, researchers used SCR as an indirect measure of the sweat response, which is controlled by the sympathetic mechanisms of the ANS. Researchers used a BIOPAC MP36 running AcqKnowledge to collect SCR data via an EDA lead set connected to participants’ fingers. The study found reduced skin conductance levels (SCL) and SCR in FMS patients compared to the non-FMS control group, indicating lower levels of sweating and reduced sympathetic activity in the skin. These factors provided the research team with a better understanding of the sympathetic nervous system’s role in FMS, with the potential for revealing new routes to better pain management and treatment.

For several decades, researchers and clinicians have studied the use of hypnosis to treat chronic pain. More recently, new technologies such as virtualpills reality have been incorporated into these techniques. A team of researchers from the University of Strasbourg in France studied the application of virtual reality hypnosis (VRH) to regulate HPT in healthy adult participants. Researchers used several physiological signals to measure autonomic function during the experiment, including ECG, respiration, SCR, and EEG. ECG signals were recorded using the BIOPAC ECG amplifier, while respiration rate was measured by a thermistor transducer that determined the difference in temperature between inhaled and exhaled air. SCRs were measured from the index and middle fingers of the dominant hand with a BIOPAC skin conductance transducer. Physiological signals were fed into a BIOPAC data acquisition system for analysis. A computer-generated immersive environment was created in VR and combined with a hypnotic auditory script. As with classical hypnosis treatments, the VRH scheme in this study began with an “induction period” followed by a “dissociation” period (separation between the mental state and the environment), followed by suggestions of pain reduction as analgesia. The study results supported a positive correlation between VRH and an increase in the participants’ pain threshold with promising implications for new non-pharmacological approaches to pain management and treatment.

These are just some of the ways that BIOPAC equipment is being used to explore the frontier of pain research and help ease the suffering of millions who deal with chronic pain and its physical and psychological effects. See our webinars page for additional information on how physiological signals can be applied to your next study.


Are you planning a study on pain or any related neurological or physiological area of research? Our team of experts is ready to help you find the tools to ensure success.

Speak Up: Physiological Signals for Speech Research

In the symphony of human communication, speech is the principal instrument. Behind every uttered word lies a complex interplay of physiological and psychological signals, each telling a unique story about the speaker’s state of mind and physical well-being. The critical data provided by these signals has become a pivotal focus in both speech research and therapy, offering useful insights into the mechanisms of verbal communication and its disorders while enhancing speech ability and overall health.

Electromyography (EMG), a technique used to measure muscle activity, plays an invaluable role in speech research by revealing the interaction of facial muscles involved in articulation. By monitoring EMG signals from muscles such as the lips, tongue, and jaw, researchers can elucidate the precise movements and coordination required for speech production, shedding light on the underlying mechanisms of speech disorders like dysarthria or apraxia.

A French study published in the 2024 edition of Science Reports used EMG to establish the role tongue reflex plays in speech posture control. The presence of a tongue reflex in maintaining tongue posture, the proper positioning of the tongue in the mouth, has been a matter of debate among speech researchers. The study team employed an unorthodox recording technique that involved attaching EMG electrodes to the base of the tongue “to record activation of the anterior genioglossus, which is responsible for the control of the anterior part of the tongue.” A robotic arm was used to rapidly stretch the tongue while researchers measured muscular reflex EMG data during the formation of various vowel sounds, which were fed to a BIOPAC EMG amplifier for signal amplification and filtering. According to the research team, the study results “represent the first physiological demonstration in humans that the tongue is driven by reflex in response to a sudden stretch.”

Electrocardiography (ECG), which measures the electrical activity of the heart, offers insights into the intricate relationship between emotion and speech. Research has shown that changes in heart rate variability (HRV) correlate with emotional arousal and cognitive load during speech tasks. By integrating ECG data with speech analysis, researchers can explore the complex connection between emotional states and linguistic expression, paving the way for emotion-aware speech synthesis systems or interventions for social communication disorders.microphone

A 2023 study by researchers at Vanderbilt University used ECG to examine the relationship between respiratory sinus arrhythmia (RSA) on the persistence of stuttering and, specifically, the role emotional regulation plays in stuttering. Researchers measured potential differences in RSA in preschool-age children with persistent stuttering, children who recovered from stuttering, and children who do not stutter. RSA, an index of parasympathetic nervous system activity, was measured during the viewing of both neutral (baseline) and emotionally stimulating video clips and during subsequent speaking tasks. To obtain RSA for each study participant, ECG data was gathered via a BIOPAC data collection and analysis system running AcqKnowledge. A low RSA baseline is often associated with difficulty regulating emotion and, according to the study’s main hypothesis, plays a role in speech disorders like stuttering. The study’s findings supported this hypothesis, with some caveats, but the overall result demonstrated that emotional regulation could provide a promising avenue for speech therapy.

Electroencephalography (EEG), a noninvasive method for recording brain activity, offers insight into neural underpinnings of speech processing and comprehension. By analyzing EEG signals, researchers can map the spatiotemporal dynamics of neural networks involved in language processing, from phonological encoding to semantic integration. EEG-based studies offer insights into the neural signatures of speech disorders like aphasia or developmental language disorders, informing targeted therapeutic interventions and neurorehabilitation strategies. EEG has presented challenges with regard to artifacts created by participant movement during speech, but recent studies have shown promise in EEG as a speech research tool.

This is just an introduction to the signals that are being used to provide researchers with a better understanding of speech and speech pathology. For additional information on how BIOPAC products are being integrated into the study of speech, see our application note on Speech Motor Control.


Are you planning a research project focusing on speech? Our regional sales representatives are ready to help you find the right tools for your study.

error: Content is protected !!