Tick, Tock: Pulse Transit Time Offers Noninvasive Physiological Insights

A split second can reveal much about the cardiovascular system and the other physiological systems it influences. Pulse Transit Time (PTT) captures one of those critical moments, the brief interval it takes for the pressure wave generated by contraction of the left ventricle to travel from the heart to a peripheral site in the body. That tiny stretch of time tells us something important about the arteries—namely, how stiff or flexible they are in that moment. When blood pressure rises and the vessel walls tighten, the pulse wave travels more quickly, so PTT gets shorter. When the vessels are relaxed and more elastic, the wave slows down, and PTT becomes longer. Because of this back-and-forth relationship, PTT gives researchers a simple, noninvasive way to track changes in vascular tone, blood flow dynamics, and autonomic nervous system activity.

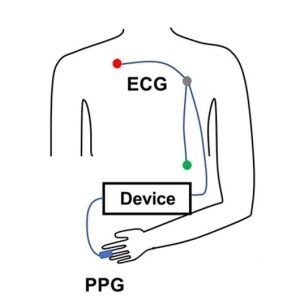
PTT is determined by measuring the volume or pressure pulse at a proximal artery (such as the carotid or brachial) and at a distal artery (such as the finger or toe). To prevent confusion in PTT nomenclature across different methods, some researchers use labels formed from the first one or two letters of the starting and arrival signals. PTT-PP refers to PTT recorded using PPG between a proximal and a distal artery, PTT-EP refers to PTT measured between electrocardiogram (ECG) proximally and photoplethysmogram (PPG) distally and PTT-IP refers to PTT recorded between Impedance Cardiogram proximally and PPG distally.

PTT-EP is recorded by simultaneously recording ECG and PPG. PPG is usually recorded at the finger using a small infrared light to detect changes in blood flow with each heartbeat. As blood pulses into the area, the amount of light absorbed changes, creating a waveform with a clear rise and peak. To calculate PTT-EP, researchers measure the time between the ECG spike and a specific point on the PPG wave, typically the point at which the wave first rises or reaches its peak. Strictly speaking PTT-EP is not a true PTT as it includes pre-ejection period, a short delay between electrical activation of the ventricles and actual ejection of blood. For that reason, it is sometimes referred to as Pulse Arrival Time (PAT). Even so, the ECG-to-PPG approach remains widely used because it is noninvasive, reliable, relatively inexpensive, and straightforward to implement across a range of study designs.

Typical lab configurations focus on integrated, multimodal data acquisition systems that allow researchers to record ECG and PPG signals simultaneously using dedicated amplifier modules, with analysis performed via software. These systems enable precise channel synchronization, automated waveform feature detection, beat-by-beat PTT computation, and data export for statistical analysis. In some studies, researchers also integrate noninvasive blood pressure (NIBP) modules to directly examine the relationship between PTT and systolic or mean arterial pressure, strengthening the interpretation of vascular changes.

Obtaining high-quality PTT data requires attention to detail and careful planning. Participants should rest in a quiet, temperature-controlled room, since vascular tone can be affected by stress, ambient temperature, and sympathetic activation. Avoid testing immediately after meals or the consumption of caffeine or nicotine, which can alter cardiovascular dynamics. Proper sensor placement and stable contact pressure are critical for minimizing motion artifacts and waveform distortion. Consistent measurement timing, accounting for diurnal variation, helps ensure consistent data quality across sessions. Signal processing choices also matter. Careful filtering (see example study below), accurate event marking, and careful peak or foot detection are essential to ensure that the measured interval truly reflects physiological timing rather than processing artifacts.

When these best practices are followed, PTT becomes a versatile research tool. It has been used to study stress reactivity, autonomic regulation, arterial stiffness, posture-related hemodynamics, exercise physiology, sleep physiology, and the development of cuffless blood pressure estimation technologies. Recent studies illustrate both the promise and the practical considerations of PTT measurement.PTT Diagram
At the Georgia Institute of Technology, researchers explored whether noninvasive nerve stimulation applied at the ear, neck, or wrist could reduce acute stress responses in healthy young adults. During laboratory sessions that included mental arithmetic and cold exposure tasks, cardiovascular signals were recorded using a BIOPAC MP data acquisition unit and a PPG100C to capture ECG and fingertip PPG. PTT served as a key marker of sympathetic (“fight-or-flight”) activation. The research team found that stimulation at the ear and wrist significantly reduced stress-related cardiovascular changes compared to a sham condition, supporting the potential for wearable systems that integrate neuromodulation and real-time cardiovascular monitoring.

In another study published in Nature, researchers at Columbia University tackled a common problem in cuffless blood pressure monitoring: when wearable sensors sit above or below heart level, changes in arm position create hydrostatic pressure errors that skew estimates based on PTT. Cuffless systems frequently use PTT to estimate blood pressure, but arm movements can distort that timing and reduce accuracy. To investigate this, the team collected synchronized physiological data using a BIOPAC data acquisition system to record high-resolution ECG signals via a BIOPAC ECG amplifier and fingertip PPG signals via BIOPAC PPG100C, while a BIOPAC NIBP module measured reference blood pressure using upper-arm and finger cuffs. Participants also wore wrist and upper-arm inertial sensors (IMUs) to track how the arm was positioned relative to the heart. The research team then developed a method called IMU-Track, which uses motion data and deep learning to correct PTT for arm height effects, improving the accuracy of blood pressure predictions across different postures. Their findings showed that accounting for sensor position dramatically reduced errors in cuffless blood pressure estimation, suggesting that combining motion tracking with PTT measurements could make wearable BP monitoring more reliable in everyday use.

When applied correctly, PTT provides a potent, noninvasive tool for assessing cardiovascular function—one measured in milliseconds but capable of revealing meaningful physiological change. For more information on integrating PTT into research, see our PTT webinar.


If you are planning to use PTT in your next study, don’t hesitate to reach out for our highly capable team of experts for assistance in identifying the equipment and procedures to ensure your success.

Silent Partner: Autonomic Function Testing in Research

Like the inner workings of an intricate machine, most of our bodily functions operate with little or no conscious effort. That task falls to the autonomic nervous system, a sort of control system that regulates a wide range of processes, including digestion, heart rate, respiration, urination, and sexual arousal, to name a few. The autonomic nervous system also controls physiological responses to stimuli—the fight-or-flight response, and critical reflex actions like vomiting, swallowing, coughing, and sneezing.

The ability to effectively and accurately test autonomic function allows clinicians to diagnose and treat a range of ailments. Such tests can non-invasively evaluate the severity and distribution of autonomic failure, for example. Beyond these clinical applications, autonomic function testing provides valuable insight into how the body regulates and manages various critical functions and how the autonomic nervous system affects our physical and psychological health.

adolescent depressionAutonomic function testing has been employed to examine the impact childhood trauma has on cognitive function as it relates to adolescent depression. A 2020 study published in Development and Psychopathology looked at whether economic deprivation and threat influenced cognitive processes and autonomic nervous system function connected to the severity of depression. Researchers measured study participants’ electrodermal activity (EDA), respiratory sinus arrhythmia (RSA), and electrocardiogram (ECG) data via an MP150 system. EDA was gathered using a BioNomadix wireless BN-PPGED amplifier set, while ECG and respiration (RSP) recordings were obtained with a BioNomadix wireless BN-RSPEC amplifier set. The study’s findings supported the assumption that a history of trauma and economic deprivation can lead to risk factors for youth depression.

Continuing with the theme of applying autonomic function testing to measure the effects of trauma, a 2021 study publish in Neurobiology of Stress examines autonomic function related to sex differences among individuals with posttraumatic stress disorder (PTSD). Skin conductance, blood pressure (BP), heart rate (HR), and high-frequency heart rate variability (HF-HRV) were recorded with an MP150 data acquisition system among male and female emergency personnel following trauma exposure. The results, which showed notable sex differences in autonomic functioning among trauma-exposed individuals, have implications for predicting cardiovascular risk in those with PTSD.

These are just a few examples of how autonomic function testing is being used outside of the clinical setting to shed new light on several research areas. Check out Part 1 and Part 2 of our webinars demonstrating how to use BIOPAC equipment and software in autonomic function research.


For additional information on how BIOPAC can assist you with a wide range of research and educational applications, contact your local sales representative.

Holiday Happiness Part 2: Sounds, Smells, and Self-Reflection

In a previous post, we discussed the stress-reducing benefits of loving interactions with close friends and family during the holiday season. In addition to family, there are many mood-shaping habits and activities that characterize the holidays: the smell of home-cooked meals, seasonal music, and reflection on the past year, to name a few. But do these have a real impact on happiness?

In a psychophysiology study, Matsunaga, et al., tested odor effects on autobiographical memory recall. The researchers introduced several odor stimuli to participants and measured their psychological and physiological reactions. Heart rate and skin conductance were recorded throughout the experiment with a BIOPAC data acquisition system. The odor stimuli resulted in decreased heart rate, increased skin conductance level, and an increase in positive mood states.

Another article tested the effects of meditation on emotional regulation. Participants completed emotional measures before and after a meditation intervention, and had their ECG, respiration, and blood pressure recorded using a BIOPAC MP unit. The meditation correlated with greater participant emotional regulation, as suggested by lower heart rate and respiration.

In addition to meditation and smell, Harmat and Eerola have found music to also be emotionally significant. Participants listened to a musical piece, and then responded to a questionnaire about their emotional state. In addition to measuring pulse rate and facial expressions, the BIOPAC Research System and EDA Amplifier were used to record skin conductance while participants listened to the stimulus. The results found that music samples evoked several emotions, including nostalgia and happiness.

This research suggests that we can affect happiness using subtle techniques that are part of everyday living. To read more studies about psychophysiology and stress reduction, visit the BIOPAC publication page.

BIOPAC offers a variety of equipment that can be used in studies similar to the ones presented. To find more information on solutions for recording and analyzing signals such as skin conductance, ECG, heart rate, respiration, and EDA using the MP160/MP150, and other platforms, you can visit the individual application pages on the BIOPAC website. 

Ensuring Error-free NIBP Measurements & Accurate Data

Correct subject set-up of upper arm cuff, CNAP® NIBP finger sensor and CNAP® controller is essential to ensure accurate data reading and collection of continuous blood pressure and hemodynamics with the NiBP 100D throughout the measurement.

By Dr. Jürgen Fortin, CEO, CNSystems

The NIBP100D provides proven accuracy for blood pressure and, using the  NIBP100-HD, full hemodynamics with validation in a number of settings and against research and clinical gold standards. Subject setup with the NIBP100D upper arm cuff and reusable finger sensor is extremely easy, however, please keep the following practical tips in mind to ensure accurate data collection:

1. Upper arm Cuff: Sizing and placement

Over the years, upper arm cuffs have become a standard measurement in basic research setup providing brachial pressure intermittently (timed intervals) rather than continuously (for every heart beat).

The NIBP100D has an upper arm cuff (Suntech Medical) integrated to provide calibration for the continuous finger sensor. For accurate calibration please mind the following steps:

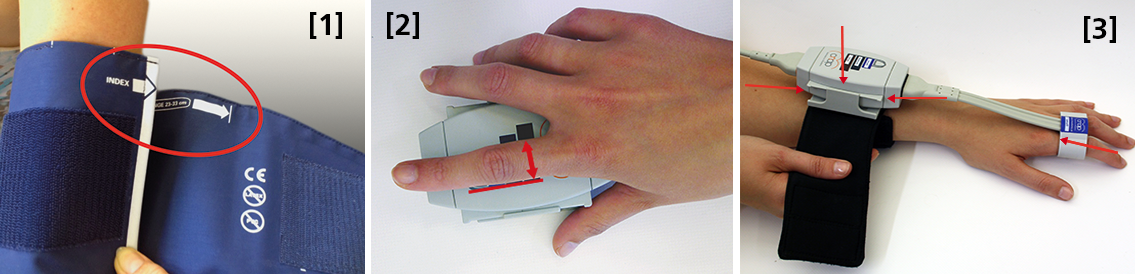
 Size: using a too small or too big upper arm cuff can lead to significant over- /or under- reading of blood pressure. Always ensure you choose the right size ( four sizes are provided with the NIBP100D) by using the range marker on the inside of the cuff–see image #3 in the photo above or review setup procedures here:

  • When wrapping the cuff around the upper arm before fixing the Velcro, ensure the white “index” arrow points into the indicated range area. If it does not, use the bigger or the smaller cuff! 
  • Placement: always align the artery marker (white arrow) on the cuff with the brachial artery (in the crook of the arm). The cuff can be placed ipsilaterally or contralaterally to the arm with the CNAP finger sensor on.
  • Wrapping: pull the upper arm cuff so tight that you could still get about 2 fingers under the wrapped cuff (air volume).

SunTech has developed a short video on the basics of measuring blood pressure. Although designed for a clinical audience, the video provides good information for researchers. Watch the SunTech NBP training video here.

2. CNAP finger sensor: Sizing and placement

Using a too small or too big finger sensor cuff can distort the continuous blood pressure readings. Avoid placing the sensor on finger joints, which may lead to a poor or even no signal. 

Size: Choose the right size from three different sizes by using the size indicator on the top of the CNAP Controller:

  • Put the proximal phalanx of the index finger on the indicator align with the grey line on the left. Choose the sensor size indicated on the shortest bar which is still visible.
  • Always use the larger sensor if you are in doubt about the size.
  • In some subjects it may be difficult to place the finger sensors on the proximal limb (i.e. finger-arthrosis, too short finger joints). In these cases, try placing the finger sensors on the middle limbs. However, make sure that the sensors are not placed over the finger joints. Hold the sensor in place or use medical tape until the sensor is inflated (start of measurement).

With the CNAP Software V5.2, sensor sizing becomes even easier—the size of the finger sensor is checked automatically upon start and the software gives notice if it does not fit. 

  • Placement: The finger sensor is placed on two neighboring fingers and slid back fully to the proximal limb!
  • Make sure not to place them on the finger joints!

3. CNAP Controller:  correct placement

The slide for the CNAP Controller allows for slight hand movement without dislocating the CNAP finger sensor. It is very important that the CNAP Controller is correctly placed:

  • Placement: Make sure that the CNAP Controller is placed in central position of the slide.
  • If the CNAP Controller is not placed correctly, the CNAP finger sensor might be pushed forward on the finger joints. 
  • View detailed pictures of CNAP Monitor Set Up Overview here.

4. Further recommendations

4.1. Start of measurement

  • Make sure that the subject keeps still and does not move his/her hand.
  • Do not change body posture during until a continuous signal is displayed!

4.2. Improving signal quality if signal is poor

  • Warm up fingers to improve blood flow (cover hand, hold hand in warm water prior to measurement, use disposable exam glove)
  • Check position of CNAP finger sensor: the sensor must not be placed on the finger joints.
  • Check if CNAP finger sensor size is correct.
  • Try to measure on the other hand.

4.3 Manual calibration with NBP

  • Trigger a manual NBP after moving or repositioning the subject/the subject’s hand or whenever hydrostatic change/offset happens.
  • Trigger a manual NBP whenever you feel that an update to the NBP reading may be beneficial
  • Triggering a manual NBP is possible at any time and in any mode. 
  • Additional information—view the CNAP NIBP100D operator’s manual here.

4.4 Removal of CNAP finger sensor

  • Do not remove the CNAP finger sensor when a measurement is still in progress. Stop measurement first, then remove the sensor!

 4.5. Battery

  • Never completely discharge the battery.
  • Immediately connect to power supply if battery charge status is below 25%.

To read a recent study which evaluated the agreement of the continuous noninvasive cardiac output measurements by CNAP in comparison with cardiac output measurements obtained invasively using transpulmonary thermodilution (TDCO), go here.

The NIBP100D provides validated, proven accuracy for blood pressure and, with the NIBP100-HD model, full hemodynamics. To ensure the acquisition of good data and accurate readings, researchers should follow the setup procedures outlined above.
For more information on BIOPAC’s Noninvasive Blood Pressure monitoring and measurement systems and advanced functionality in the area of cardiovascular hemodynamics, to include CNAP noninvasive blood pressure systems, visit BIOPAC’s NIBP page or view BIOPAC’s NIBP amplifiers (small animal applications are also supported) and related equipment for a wide variety of research applications.

BIOPAC Systems, Inc. provides life science researchers and educators with data acquisition and analysis systems that inspire people and enable greater discovery about life. Visit us at www.biopac.com.

CNAP HD: Noninvasive Hemodynamic Monitoring in Research

Cardiac Output (CNCO® ) and further essential hemodynamic parameters calculated from the continuous non-invasive arterial pressure curve (CNAP®) by means of the Pulse Contour Analysis shows high accuracy and high trending ability (precision) compared to invasive clinical standards (e.g. thermodilution and PiCCO) with valuable benefit for scientific and clinical research.

By Dr. Jürgen Fortin, CEO, CNSystems

Pulse Contour Analysis (PCA) for deriving complete Hemodynamics from continuous blood pressure wave (CNAP)

Pulse Contour Analysis (PCA)[1] derives important physiological information on preload, contractility, afterload and compliance of the heart from the well validated CNAP® Continuous Noninvasive Arterial Pressure Curve[2],[3]. By adding biometric patient data Stroke Volume (SV) and therefrom Continuous Noninvasive Cardiac Output (CNCO®), both essential hemodynamic markers, are calculated. Further hemodynamic parameters such as Systemic Vascular Resistance (SVR) as well as all indexed values SI, CI or SVRI are derived completing the hemodynamic picture.

Validation: CNCO® is clinically validated against invasive methods

Non-invasive continuous CNCO® is the non-invasive continuous cardiac output calculated from CNAP® Arterial Pressure as described above.

Accuracy of CNCO® compared to clinical standards such as invasive thermodilution (TD) or PiCCO is expressed as percentage error. In 1999, Critchley and Critchley suggested a percentage error of 30% or less[4]. In clinical practice, however, percentage errors of 40-45% are more realistic for the interchangeability between two CO-measurement methods (meta-analysis by Peyton and Chong[5]).

Trending ability is the precise tracking of changes in CO. According to Critchley, Lee and Ho, reliable trending ability[6] is indicated by concordance rates of > 90%. Vincent and colleagues state that following hemodynamic trends may be more important than absolute values[7].

CNCO® shows both high accuracy as well as high trending ability (precision) compared to the invasive clinical standards thermodilution and PiCCO fulfilling all Critchley criteria:

Bland-Altman plots show

  • Small bias and narrow limits of agreement
  • Percentage errors ≤ 30% (according to strict Critchley standard [8],[9])
  • Concordance rates ≥ 90% (according to standard [10])

Read more on CNAP accuracy here and here.

Benefit of continuous BP, CO & SVR in research (examples)

Blood pressure, cardiac output and vascular resistance are used to differentiate between challenge and threat states (positive and negative stress)[11],[12] and to quantify emotional response[13] in psychophysiological studies. A challenging situation causes a far bigger rise in cardiac output than a threating state. Total peripheral resistance rises in threat state but shows strong decrease in the challenging situation.

CNCO® is available with the CNAP® HD feature, currently only available in Europe.

For more information on CNAP, to include references to studies and research and plots, click here.

[1] https://en.wikipedia.org/wiki/Cardiac_output#Pulse_Pressure_methods
[2] Jeleazcov C et. al. Precision and accuracy of a new device (CNAP®) for continuous noninvasive arterial blood pressure monitoring: assessment during general anaesthesia. BJA. 2010; 105(3):264-272
[3] Biais, M. et. al. Continuous non-invasive arterial pressure measurement: Evaluation of CNAPTM device during vascular surgery Ann Fr Anesthesia
[4] Critchley, L. A., & Critchley, J. A. (1999). A meta-analysis of studies using bias and precision statistics to compare cardiac output measurement techniques. Journal of clinical monitoring and computing, 15(2), 85–91
[5] Peyton PJ, Chong SW: Minimally invasive measurement of cardiac output during surgery and critical care. Anesthesiology 2010; 113:1220-35

[6] Critchley LA, Lee A, Ho AMH: A critical review of the ability of continuous cardiac output monitors to measure trends in cardiac output. Anesth Analg 2010; 111:1180-92.

[7] Vincent JL et al.: Clinical review: Update on hemodynamic monitoring – a consensus of 16. Critical Care 2011, 15:229.

[8] Critchley, L. A., & Critchley, J. A. (1999). A meta-analysis of studies using bias and precision statistics to compare cardiac output measurement techniques. Journal of clinical monitoring and computing, 15(2), 85–91

[9] Peyton PJ, Chong SW: Minimally invasive measurement of cardiac output during surgery and critical care. Anesthesiology 2010; 113:1220-35.

[10] Critchley LA, Lee A, Ho AMH: A critical review of the ability of continuous cardiac output monitors to measure trends in cardiac output. Anesth Analg 2010; 111:1180-92.

[11] Kirby, L. D., & Wright, R. A. (2003). Cardiovascular correlates of challenge and threat appraisals: A critical examination of the Biopsychosocial Analysis. Personality and Social Psychology Bulletin, 7, 216-233.

[12] Tomaka, J., Blascovich, J., Kelsey, R. M., & Leitten, C. L. (1993). Subjective, physiological, and behavioral effects of threat and challenge appraisal. Journal of Personality and Social Psychology, 65, 248-260.

[13] Lackner, H. K., Weiss, E. M., Schulter, G., Hinghofer-Szalkay, H., Samson, A. C., & Papousek, I. (2013). I got it! Transient Cardiovascular Response to the Perception of Humor. Biological Psychology, 93, 33–40.

For more information on BIOPAC’s Noninvasive Blood Pressure monitoring and measurement systems and advanced functionality in the area of cardiovascular hemodynamics, to include CNAP noninvasive blood pressure systems, visit BIOPAC’s NIBP page or view BIOPAC’s NIBP amplifiers (MRI and small animal applications are also supported) and related equipment for a wide variety of research applications.

BIOPAC Systems, Inc. provides life science researchers and educators with data acquisition and analysis systems that inspire people and enable greater discovery about life.  Visit us at www.biopac.com.

CNAP Noninvasive Blood Pressure Technology – An Overview

The interaction of an easy-to-use finger sensor with unique control loops and algorithms as well as with NBP provides high accuracy of the BP signal – equivalent to invasive arterial line.

By Dr. Jürgen Fortin, CEO, CNSystems

Continuous noninvasive arterial blood pressure measurement (CNAP®) is the technique for measuring blood pressure (BP) that is, as the title describes, both continuous and noninvasive. CNAP combines the advantages of the following two clinical “gold standards:” it measures blood pressure (BP) continuously in real time like the invasive arterial catheter system (IBP) and it is noninvasive, like the standard upper arm sphygmomanometer (NBP).

The CNAP principle is the intelligent interaction and synergy of IP-protected features and functions based on the well-known Vascular Unloading Principle by Penaz (with significant improvement over the past 15 years) [1], on unique control algorithms (e.g. VERIFI) [2] and on calibration mechanisms, making it a reliable and accurate method with results comparable to the intra-arterial measurement.

Pulsating blood flow detected by infrared light sensors is kept constant by the counter pressure exerted on the artery through inflating or deflating the integrated cuff. The resulting pressure in the finger sensor corresponds to the real arterial pressure [1]. The pressure system is controlled by multiple digital feedback loops. The “VERIFI-algorithm” is used for high fidelity signal processing and artifact rejection. This is a superior method for filtering vasomotoric influences, in contrast to Standard methods based on Vascular Unloading Principle, which can show false BP shifts due to influence of vasomotoric tone.

In terms of calibration, CNAP is the only available technology calibrating to directly measured upper arm values, providing blood pressure variations in absolute values at heart-level. The interaction of finger sensor with NBP provides high accuracy of the BP signal – equivalent to invasive arterial line.

Use of CNAP provides researchers with several benefits, including: 

  •  NBP Cuff – Automated scaling to brachial pressure (gold standard) at start of measurement and user programmable
  • Double finger sensor – Quick and error-free application
  • Continuous waveform – Continuous tracing of hemodynamic changes without interruptions to recalibrate; beat-to-beat systolic, diastolic, mean BP values
  • Connectivity – Plug-and-play integration into all common data acquisition systems and patient monitors
  • Data storage and analysis – Unlimited data storage via USB interface. Data format (*.csv) for import into all common data analysis software packages (e.g. BIOPAC’s AcqKnowledge®, Matlab, MS Excel, SPSS, etc.)
  • Accuracy – Reliably equivalent to invasive blood pressure (IBP) [3], [4]

Notes:

[1]  Jan Penaz, Brno, Czech Republic 1973.

[2]  Fortin J et al.: Continuous non-invasive blood pressure monitoring using concentrically interlocking control loops. Comput in BiolMed 36 (2006) 941 – 957.

[3]  Jeleazcov C et. al. Precision and accuracy of a new device (CNAP) for continuous noninvasive arterial blood pressure monitoring: assessment during general anaesthesia. BJA. 2010; 105(3):264-272.

[4]Biais, M. et. al. Continuous non-invasive arterial pressure measurement: Evaluation of CNAP device during vascular surgery Ann Fr Anesthesia.

Studies documenting the CNAP device’s performance can be found below:

Arterial stiffness is higher in older adults with increased perceived fatigue and fatigability during walking

Does conscious intention to perform a motor act depend on slow cardiovascular rhythms?

The Effect of Mainstream Media on Body Image and Stress Reactivity in Latina Females

For more information on BIOPAC’s Noninvasive Blood Pressure monitoring and measurement and cardiology research solutions, to include CNAP noninvasive blood pressure systems, visit BIOPAC’s NIBP page or view BIOPAC’s NIBP amplifiers (MRI and small animal applications are also supported) and related equipment for a wide variety of research applications.

BIOPAC Systems, Inc. provides life science researchers and educators with data acquisition and analysis systems that inspire people and enable greater discovery about life.  Visit us at www.biopac.com.

error: Content is protected !!