
Tick, Tock: Pulse Transit Time Offers Noninvasive Physiological Insights

A split second can reveal much about the cardiovascular system and the other physiological systems it influences. Pulse Transit Time (PTT) captures one of those critical moments, the brief interval it takes for the pressure wave generated by contraction of the left ventricle to travel from the heart to a peripheral site in the body. That tiny stretch of time tells us something important about the arteries—namely, how stiff or flexible they are in that moment. When blood pressure rises and the vessel walls tighten, the pulse wave travels more quickly, so PTT gets shorter. When the vessels are relaxed and more elastic, the wave slows down, and PTT becomes longer. Because of this back-and-forth relationship, PTT gives researchers a simple, noninvasive way to track changes in vascular tone, blood flow dynamics, and autonomic nervous system activity.

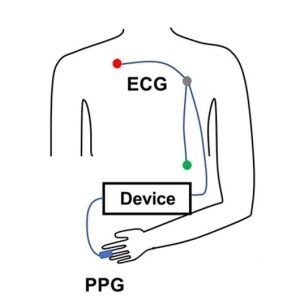
PTT is determined by measuring the volume or pressure pulse at a proximal artery (such as the carotid or brachial) and at a distal artery (such as the finger or toe). To prevent confusion in PTT nomenclature across different methods, some researchers use labels formed from the first one or two letters of the starting and arrival signals. PTT-PP refers to PTT recorded using PPG between a proximal and a distal artery, PTT-EP refers to PTT measured between electrocardiogram (ECG) proximally and photoplethysmogram (PPG) distally and PTT-IP refers to PTT recorded between Impedance Cardiogram proximally and PPG distally.

PTT-EP is recorded by simultaneously recording ECG and PPG. PPG is usually recorded at the finger using a small infrared light to detect changes in blood flow with each heartbeat. As blood pulses into the area, the amount of light absorbed changes, creating a waveform with a clear rise and peak. To calculate PTT-EP, researchers measure the time between the ECG spike and a specific point on the PPG wave, typically the point at which the wave first rises or reaches its peak. Strictly speaking PTT-EP is not a true PTT as it includes pre-ejection period, a short delay between electrical activation of the ventricles and actual ejection of blood. For that reason, it is sometimes referred to as Pulse Arrival Time (PAT). Even so, the ECG-to-PPG approach remains widely used because it is noninvasive, reliable, relatively inexpensive, and straightforward to implement across a range of study designs.

Typical lab configurations focus on integrated, multimodal data acquisition systems that allow researchers to record ECG and PPG signals simultaneously using dedicated amplifier modules, with analysis performed via software. These systems enable precise channel synchronization, automated waveform feature detection, beat-by-beat PTT computation, and data export for statistical analysis. In some studies, researchers also integrate noninvasive blood pressure (NIBP) modules to directly examine the relationship between PTT and systolic or mean arterial pressure, strengthening the interpretation of vascular changes.

Obtaining high-quality PTT data requires attention to detail and careful planning. Participants should rest in a quiet, temperature-controlled room, since vascular tone can be affected by stress, ambient temperature, and sympathetic activation. Avoid testing immediately after meals or the consumption of caffeine or nicotine, which can alter cardiovascular dynamics. Proper sensor placement and stable contact pressure are critical for minimizing motion artifacts and waveform distortion. Consistent measurement timing, accounting for diurnal variation, helps ensure consistent data quality across sessions. Signal processing choices also matter. Careful filtering (see example study below), accurate event marking, and careful peak or foot detection are essential to ensure that the measured interval truly reflects physiological timing rather than processing artifacts.

When these best practices are followed, PTT becomes a versatile research tool. It has been used to study stress reactivity, autonomic regulation, arterial stiffness, posture-related hemodynamics, exercise physiology, sleep physiology, and the development of cuffless blood pressure estimation technologies. Recent studies illustrate both the promise and the practical considerations of PTT measurement.PTT Diagram
At the Georgia Institute of Technology, researchers explored whether noninvasive nerve stimulation applied at the ear, neck, or wrist could reduce acute stress responses in healthy young adults. During laboratory sessions that included mental arithmetic and cold exposure tasks, cardiovascular signals were recorded using a BIOPAC MP data acquisition unit and a PPG100C to capture ECG and fingertip PPG. PTT served as a key marker of sympathetic (“fight-or-flight”) activation. The research team found that stimulation at the ear and wrist significantly reduced stress-related cardiovascular changes compared to a sham condition, supporting the potential for wearable systems that integrate neuromodulation and real-time cardiovascular monitoring.

In another study published in Nature, researchers at Columbia University tackled a common problem in cuffless blood pressure monitoring: when wearable sensors sit above or below heart level, changes in arm position create hydrostatic pressure errors that skew estimates based on PTT. Cuffless systems frequently use PTT to estimate blood pressure, but arm movements can distort that timing and reduce accuracy. To investigate this, the team collected synchronized physiological data using a BIOPAC data acquisition system to record high-resolution ECG signals via a BIOPAC ECG amplifier and fingertip PPG signals via BIOPAC PPG100C, while a BIOPAC NIBP module measured reference blood pressure using upper-arm and finger cuffs. Participants also wore wrist and upper-arm inertial sensors (IMUs) to track how the arm was positioned relative to the heart. The research team then developed a method called IMU-Track, which uses motion data and deep learning to correct PTT for arm height effects, improving the accuracy of blood pressure predictions across different postures. Their findings showed that accounting for sensor position dramatically reduced errors in cuffless blood pressure estimation, suggesting that combining motion tracking with PTT measurements could make wearable BP monitoring more reliable in everyday use.

When applied correctly, PTT provides a potent, noninvasive tool for assessing cardiovascular function—one measured in milliseconds but capable of revealing meaningful physiological change. For more information on integrating PTT into research, see our PTT webinar.


If you are planning to use PTT in your next study, don’t hesitate to reach out for our highly capable team of experts for assistance in identifying the equipment and procedures to ensure your success.

Speak Up: Physiological Signals for Speech Research

In the symphony of human communication, speech is the principal instrument. Behind every uttered word lies a complex interplay of physiological and psychological signals, each telling a unique story about the speaker’s state of mind and physical well-being. The critical data provided by these signals has become a pivotal focus in both speech research and therapy, offering useful insights into the mechanisms of verbal communication and its disorders while enhancing speech ability and overall health.

Electromyography (EMG), a technique used to measure muscle activity, plays an invaluable role in speech research by revealing the interaction of facial muscles involved in articulation. By monitoring EMG signals from muscles such as the lips, tongue, and jaw, researchers can elucidate the precise movements and coordination required for speech production, shedding light on the underlying mechanisms of speech disorders like dysarthria or apraxia.

A French study published in the 2024 edition of Science Reports used EMG to establish the role tongue reflex plays in speech posture control. The presence of a tongue reflex in maintaining tongue posture, the proper positioning of the tongue in the mouth, has been a matter of debate among speech researchers. The study team employed an unorthodox recording technique that involved attaching EMG electrodes to the base of the tongue “to record activation of the anterior genioglossus, which is responsible for the control of the anterior part of the tongue.” A robotic arm was used to rapidly stretch the tongue while researchers measured muscular reflex EMG data during the formation of various vowel sounds, which were fed to a BIOPAC EMG amplifier for signal amplification and filtering. According to the research team, the study results “represent the first physiological demonstration in humans that the tongue is driven by reflex in response to a sudden stretch.”

Electrocardiography (ECG), which measures the electrical activity of the heart, offers insights into the intricate relationship between emotion and speech. Research has shown that changes in heart rate variability (HRV) correlate with emotional arousal and cognitive load during speech tasks. By integrating ECG data with speech analysis, researchers can explore the complex connection between emotional states and linguistic expression, paving the way for emotion-aware speech synthesis systems or interventions for social communication disorders.microphone

A 2023 study by researchers at Vanderbilt University used ECG to examine the relationship between respiratory sinus arrhythmia (RSA) on the persistence of stuttering and, specifically, the role emotional regulation plays in stuttering. Researchers measured potential differences in RSA in preschool-age children with persistent stuttering, children who recovered from stuttering, and children who do not stutter. RSA, an index of parasympathetic nervous system activity, was measured during the viewing of both neutral (baseline) and emotionally stimulating video clips and during subsequent speaking tasks. To obtain RSA for each study participant, ECG data was gathered via a BIOPAC data collection and analysis system running AcqKnowledge. A low RSA baseline is often associated with difficulty regulating emotion and, according to the study’s main hypothesis, plays a role in speech disorders like stuttering. The study’s findings supported this hypothesis, with some caveats, but the overall result demonstrated that emotional regulation could provide a promising avenue for speech therapy.

Electroencephalography (EEG), a noninvasive method for recording brain activity, offers insight into neural underpinnings of speech processing and comprehension. By analyzing EEG signals, researchers can map the spatiotemporal dynamics of neural networks involved in language processing, from phonological encoding to semantic integration. EEG-based studies offer insights into the neural signatures of speech disorders like aphasia or developmental language disorders, informing targeted therapeutic interventions and neurorehabilitation strategies. EEG has presented challenges with regard to artifacts created by participant movement during speech, but recent studies have shown promise in EEG as a speech research tool.

This is just an introduction to the signals that are being used to provide researchers with a better understanding of speech and speech pathology. For additional information on how BIOPAC products are being integrated into the study of speech, see our application note on Speech Motor Control.


Are you planning a research project focusing on speech? Our regional sales representatives are ready to help you find the right tools for your study.

2023 in Review: The Best of Research Using BIOPAC

As another year winds to a close, it is a holiday tradition to look back on the last 12 months and take stock. ‘Tis the season of “top 10” lists, “best of” articles, and “year in review” segments in the media. So, not to be left out, we here at BIOPAC have been assessing 2023 from our own unique vantage point. We have put together a brief list of some of our favorite research studies from the year that relied on BIOPAC products to gather and analyze data. We have nervous passengers in driverless cars, killer clowns, and individuals giving us conspicuous side-eye, all for your reading pleasure.

Backseat Drivers

While the advent of self-driving vehicles offers considerable potential for increasing the convenience of transportation and travel, this developing technology is not without controversy. Both passengers and those who would potentially share the road with autonomous vehicles worry about safety issues. A recent study funded by the French National Research Agency examined how passengers in self-driving vehicles reacted when navigating shared-space areas with large concentrations of pedestrians. The study defined shared spaces as “areas where all forms of segregation between pedestrians and vehicles (e.g., road markings, traffic signals, signs, curbs, and barriers) are minimized or eliminated.” Study participants were seated in front of a computer-based driving simulator. EDA data was gathered via a BioNomadix wireless  EDA transmitter and amplifier connected to a BIOPAC data acquisition and analysis system. Data was gathered across a variety of variables including changes in vehicle speed, concentrations of pedestrians, and proximity. Among the study’s conclusions was the suggestion that cognitive processes involved in collision risk assessments may lead to physiological adaptations that allow passengers to cope with stress related to vehicle-pedestrian interactions in shared spaces.

Send in the (Demonic) Clowns

VR HMDAnother study that caught our attention in 2023 examined how stressors created in a virtual reality (VR) environment are manifested in measurable physiological stress reactions. VR has seen a growth of applications beyond entertainment in recent years. It is being used for a wide range of applications such as training in simulated environments where it is necessary to create stressful conditions that mimic real-world experiences. A team of German researchers examined a variety of physiological signals, including electroencephalography (EEG), electrodermal activity (EDA), and peripheral skin temperature (ST) to determine which are most reliable for accurately measuring the stress levels of participants while they experienced cinematic horror scenarios in a VR environment. Study participants wore a VR headset that displayed four-minute episodic horror movies featuring demonic clowns. EEG data was gathered with an SS2L electrode lead set and general-purpose electrodes connected to the left temporal lobe. ECG recording was conducted with a second lead using an SS2L electrode lead set. The research team used an SS3LA EDA transducer to collect EDA data. All data was fed to an MP36 system running Biopac Student Lab (BSL) software. The study successfully demonstrated that stress can be triggered in VR and leads to a physiological and measurable stress reaction.

Are You Looking at Me?

The third study that sparked our interest in 2023 looked at how individuals react to the gaze of another person. A team of researchers from Finland and China used facial electromyography (EMG), skin conductance response (SCR), and heart rate (HR) to measure affective and attentional responses to faces with a direct and averted gaze. The study sought to measure both vicarious responses to watching two individuals who were looking at each other as well as individuals looking directly at the participant. SCR was recorded using a BIOPAC EDA100C amplifier connected to an MP data acquisition system. The participant’s facial muscle activity was measured and amplified with an EMG100C amplifier. The electrocardiogram (ECG) signal was measured with electrodes placed on the left and right inner forearm and amplified with an ECG100C amplifier. While the study did not find significant vicarious eye contact response, it did measure considerable affective response from direct gaze from one or more individuals. The study’s results could provide a better understanding of the role physiology plays in non-verbal communication between individuals and groups.

This is just a small sampling of the many studies that relied on BIOPAC equipment to gather and analyze data in 2023. For more ideas on how BIOPAC is leading the way in physiology, psychophysiology, neurology, and other areas of research, check out our webinars or watch one of our many online training videos. See you in 2024!


Start 2024 right by leveraging BIOPAC products in your next research study. Reach out to your regional sales representative to learn more.

A Heartbeat Away: HRV Unlocks Autonomic Insights

The beating of the heart holds the key to a myriad of physiological questions that are of interest to researchers. The measured variation in time intervals between consecutive heartbeats, otherwise known as Heart Rate Variability (HRV), provides valuable insights into the activity of the autonomic nervous system, reflecting the balance between sympathetic and parasympathetic influences on the heart.

HRV allows researchers to assess cardiac health, stress levels, and overall autonomic function, making it an invaluable component of physiological studies to investigate numerous areas such as cardiovascular health, mental health, stress, and exercise physiology to name just a few.

A recent study applied HRV to examine the effectiveness of yoga and Ayurveda, a form of alternative medicine traditionally practiced in India and Nepal, to regulate and treat lymphedema. Lymphedema is tissue swelling caused by an accumulation of protein-rich fluid that’s usually drained through the body’s lymphatic system. Because lymph drainage has been connected to autonomic function, researchers postulated that HRV would provide meaningful insight into the effectiveness of yoga and Ayurveda programs in treating lymphedema. A BIOPAC two-channel BSL data acquisition system was employed to gather HRV and respiration data of participants who underwent an intensive regimen of yoga exercise, limb soaking, herbal baths, and manual lymph drainage. Initial comparisons of HRV data between both the test and control groups showed significant improvement in the lymphedema patients following treatment.

beating heartIn many cases, researchers choose to combine HRV with other signals to provide a more detailed picture of a participant’s autonomic response to stimuli. A 2020 study sought to identify an effective noninvasive measure of how the sympathetic nervous system (SNS) responds to stimuli. Typically, such measurements involve the invasive recording of muscle sympathetic neural activity at the peroneal nerve. This study examined HRV and electrodermal activity (EDA), both separately and in combination, to see which provided the most effective measurement of SNS activity. Researchers measured participants’ SNS response to both a cold-pressor test (submerging hand in ice water) and while viewing emotionally challenging video images. Throughout both tests, continuous ECG and EDA signals were acquired and analyzed using a BIOPAC four-channel data acquisition system. An ECG100C and EDA100C were used to acquire the ECG and EDA signals, respectively. From their results, researchers concluded that the combination of HRV and EDA provided a better metric for SNS activity than HRV alone.

Whether alone or in combination with other signals, HRV offers researchers a powerful tool for measuring how the autonomic nervous system responds to a wide range of stimuli and conditions with applications across a broad spectrum of fields. Visit our Webinars page for multiple examples of how HRV is being used in research and check our HRV citations as well.


Are you designing a study that features HRV? BIOPAC’s regional sales reps can help you access the right tools for the job to ensure the best possible results. Contact us today!

Faster, Stronger, Further—Unlocking the Body’s Potential with Exercise Physiology

Every athlete seeks the winning formula that will make them more competitive. Add coaches, trainers, weekend warriors, and everyday health enthusiasts to the mix, all looking for an edge to improve fitness, shorten recovery times, and avoid injuries. Exercise physiology plays a key role in gaining such advantages and insights.

Exercise physiology encompasses the scientific study of how the body responds and adapts to exercise and physical activity. It covers a wide spectrum of systems including the cardiovascular, respiratory, and musculoskeletal as well as metabolic function and overall performance. Today’s exercise physiologists benefit from a range of tools and techniques to measure, collect, and analyze such responses and acquire a better understanding of the ways in which exercise affects both humans and other animals, including solutions that integrate the latest virtual reality and eye tracking technology.

This type of research is not without its challenges. Study participants are often required to be physically active during data acquisition. The tools employed in such instances must allow participants to move freely without introducing signal artifacts or noise into the data. A 2021 study into the physiological progression of fatigue shows how researchers can resolve such problems by employing wireless devices such as BIOPAC mobile EMG amplifiers, used in this case to measure strain to the biceps and triceps during exercise. Researchers successfully gathered a range of EMG data with no negative effects from the physical exertion of the study participants.heavy lifting

Exercise physiology research has also been applied to the treatment and management of exercise- and sports-related injuries, both acute and chronic. Additionally, studies have investigated the connection between physical activity and pathology, revealing new ways to prevent or reduce the progress of certain diseases.

A 2020 study by researchers at the University of Udine examined the effects of both exercise alone and exercise combined with a high-protein diet on patients with late-onset Pompe disease, a neuromuscular disorder that degrades a person’s tolerance to physical activity. The study explored which routine had the greatest impact, if any, on a patient’s exercise tolerance, muscle and pulmonary functions, and quality of life. A BIOPAC isometric dynamometer measured muscle force generated by the right leg and arm during flex and extension tests. Data gathered with a BIOPAC data acquisition and analysis system running AcqKnowledge software demonstrated that the combination of exercise and a high-protein diet did improve exercise tolerance, muscle enzymes, pulmonary function, and quality of life for the patients.

Exercise physiology research also sheds light on the ways in which exercise impacts mental and physical wellness. A study published at the Ho Chi Minh University of Technology used heart rate variability (HRV) to evaluate the influence of stress, both physical and mental, on the performance of stationary bike trainees. During the experiment, electrocardiogram (ECG) signal data was gathered from participants using an MP36 data acquisition unit running Biopac Student Lab (BSL) software over a two-month exercise regimen. Based on the results of the study, researchers concluded that HRV provided a useful window into how stress impacts performance and that HRV data could be used as a management tool to monitor stress levels during training.

The techniques and tools available to today’s exercise physiology researchers are as diverse and varied as the areas in which they are being employed, from athletic performance monitoring and enhancement to wellness studies. For more information on how such tools can benefit your exercise physiology research, watch BIOPAC’s webinar on Recording Great Data from Exercising and Mobile Subjects.


Our regional BIOPAC sales reps are ready to help you find the right tools to design your next exercise physiology study. Contact them today to learn more.

Eye-Catching: Mobile Tech Enhances Immersive Experiments

Freed from the limitations of stationary eye tracking technology, mobile eye tracking enables researchers to study their subjects while they perform a wide range of immersive tasks in natural settings.

Sixteenth-century pediatrician Thomas Phaer mused that “the eyes are the windows to the soul.” These sensory organs and their movements certainly provide a wealth of information to researchers studying the interaction of mind and body. Eye tracking has long been a key tool of physiological and psychophysiological research, and recent developments in mobile eye tracking take this valuable data resource out of the confines of the lab and into the real world.

Freed from the limitations of stationary eye tracking technology, mobile eye tracking enables researchers to study participants while they perform a wide range of immersive tasks in natural settings. These self-contained devices come in a variety of form factors including wearable glasses that provide untethered eye tracking data acquisition in real time that can be combined with other physiological data collected during live experiments.

Today’s lightweight mobile devices can record a broad spectrum of eye tracking data, including pupil size and position, gaze path, vergence angle, and areas of interest (AOI). The latter connects stimuli to eye-movement metrics, providing data on the participant’s psychophysiological response to stimuli within their field of vision. In previous blog posts and webinars, we have explored how mobile eye tracking technology gathers this data. Numerous studies have been published that demonstrate its potential in physiological and psychophysiological research. Settings and applications include user experience, sports and physical therapy, public safety and law enforcement, driving and equipment operation, and work environments from the office to the factory floor.

Mobile eye tracking technology allowed researchers at The University of Sheffield to take their experiments to the city streets for a 2020 study into how different lighting affects cyclists navigating urban environments at night. Mobile eye tracking provided data on the gaze behavior of nocturnal cyclists in parallel with skin conductance response (SCR) to better understand how obstacle detection is influenced by variations in type, location, and level of lighting. Bicycles and their riders were equipped with a BIOPAC data acquisition unit and audio stimulation units along with a BioNomadix EDA transmitter and electrodes to record the participants’ SCR. Eye tracking data, including AOI, were synchronized with SCR data and analyzed using AcqKnowledge software to determine how the riders reacted to a variety of lighting conditions. Researchers concluded that lighting plays a significant role in riders’ comfort levels at night and that improved lighting could increase urban bicycle use.

VGM playerLess intrusive by design, mobile eye tracking can provide indoor experiments with a heightened degree of immersion. A study at the University of British Columbia used mobile eye tracking glasses to create a more natural environment to investigate how the immersive effects of electronic gaming machines (EGM) impact gambling addiction. The study looked at how machine design triggered psychophysiological responses in participants by assigning various AOI to EGM screens. ECG data were recorded along with respiration effort via a BIOPAC respiration effort transducer and amplifier, which were fed to a data acquisition unit and synchronized with AOI data recorded via mobile eye tracking glasses. The study was able to successfully identify several key markers for game immersion using AOI that suggest behavioral links between immersion and gambling addiction.

Possible applications for mobile eye tracking in research continue to expand with the evolution of the technology. To learn more about recent developments in mobile eye tracking, check out our latest webinar on mobile eye tracking glasses with AcqKnowledge integration.


Learn more about how to integrate mobile eye tracking into your next research project by contacting your local BIOPAC sales representative.

Balancing Act: HRV Provides Critical Marker for Psychophysiological Health

Two college wrestlers square off on the mat awaiting the signal that will begin their match. To the casual observer, the outcome seems impossible to predict. Their coach, however, knows one competitor has a clear advantage—a heart rate variability level (HRV) that is higher than his opponent’s. Examining HRV data provides more than insight into athletic performance, it offers a window into a broad spectrum of functions that influence psychophysiological health.

HRV balanceIn simple terms, HRV is the natural variation in the intervals between each heartbeat over time. Unlike a ticking clock, our hearts do not beat at a constant rate. As such, variations in heart rate can provide a wide range of valuable information on our bodily systems. This is because HRV represents a balancing act between our sympathetic and parasympathetic nervous systems, which together make up the autonomic nervous system. As we have discussed in previous posts, the autonomic nervous system controls nearly all the body’s involuntary functions.

The sympathetic nervous system is activated in times of stress or danger (i.e., the fight-or-flight response), during which our bodies sweat, our heart rates increase, and the interval between beats decreases. Conversely, the parasympathetic nervous system acts as a sort of switch, shutting down the sympathetic nervous system and activating a relaxed state (i.e., rest and digest). To do this, it releases acetylcholine, a neurotransmitter that makes the heart beat slower and at greater intervals.

When these two systems are in balance, they produce higher HRV through a more variable heart rate. Greater variability has been associated with the body’s ability to switch between these systems. Thus, HRV is used as a health marker, such that high HRV is associated with better cardiovascular health, mental focus, emotional health, stress management, and ability to recover from exercise, while low HRV is associated with inflammation, chronic fatigue, increased stress, depression, and chronic pain.

HRV has also been connected to willpower and is a predictor of persistence and self-control. HRV increases during periods of self-regulation sometimes called the “pause and plan response.” As such, HRV has been particularly useful in research into the mechanism associated with addiction. A 2019 study used HRV to explore how chronic pain patients treated with opioids could regulate drug cravings and depression through dispositional mindfulness. Electrocardiogram (ECG) data were sampled with a BIOPAC data acquisition unit while HRV was calculated with AcqKnowledge software.HRV chart

Because HRV plays such a critical role in physical and psychological health, several studies have investigated how to self-regulate HRV, including examining how it is affected by posture. A 2020 study used a  2-channel BSL data acquisition unit to gather ECG data to calculate HRV for a variety of bodily positions to determine their impact.

A similar study examined the link between HRV and resilience, i.e., the individual’s ability to return to stable physical and psychological equilibrium after experiencing stress. HRV calculations were made from data gathered via a BIOPAC ECG100C ECG amplifier, RSP100C respiratory amplifier, and EDA/GSR amplifier. The study identified possible trends connecting resilience factors and HRV levels during specific stress-inducing simulations.

Calculating HRV with BIOPAC hardware and software solutions provides researchers with a myriad of psychophysiological insights for their lab work. Learn more about HRV from our Knowledge Base entry, as well as application notes on data preparation for analysis and statistical and geometric measures.


For additional information on how BIOPAC can assist you with a wide range of research and educational applications, contact your local sales representative.


Silent Partner: Autonomic Function Testing in Research

Like the inner workings of an intricate machine, most of our bodily functions operate with little or no conscious effort. That task falls to the autonomic nervous system, a sort of control system that regulates a wide range of processes, including digestion, heart rate, respiration, urination, and sexual arousal, to name a few. The autonomic nervous system also controls physiological responses to stimuli—the fight-or-flight response, and critical reflex actions like vomiting, swallowing, coughing, and sneezing.

The ability to effectively and accurately test autonomic function allows clinicians to diagnose and treat a range of ailments. Such tests can non-invasively evaluate the severity and distribution of autonomic failure, for example. Beyond these clinical applications, autonomic function testing provides valuable insight into how the body regulates and manages various critical functions and how the autonomic nervous system affects our physical and psychological health.

adolescent depressionAutonomic function testing has been employed to examine the impact childhood trauma has on cognitive function as it relates to adolescent depression. A 2020 study published in Development and Psychopathology looked at whether economic deprivation and threat influenced cognitive processes and autonomic nervous system function connected to the severity of depression. Researchers measured study participants’ electrodermal activity (EDA), respiratory sinus arrhythmia (RSA), and electrocardiogram (ECG) data via an MP150 system. EDA was gathered using a BioNomadix wireless BN-PPGED amplifier set, while ECG and respiration (RSP) recordings were obtained with a BioNomadix wireless BN-RSPEC amplifier set. The study’s findings supported the assumption that a history of trauma and economic deprivation can lead to risk factors for youth depression.

Continuing with the theme of applying autonomic function testing to measure the effects of trauma, a 2021 study publish in Neurobiology of Stress examines autonomic function related to sex differences among individuals with posttraumatic stress disorder (PTSD). Skin conductance, blood pressure (BP), heart rate (HR), and high-frequency heart rate variability (HF-HRV) were recorded with an MP150 data acquisition system among male and female emergency personnel following trauma exposure. The results, which showed notable sex differences in autonomic functioning among trauma-exposed individuals, have implications for predicting cardiovascular risk in those with PTSD.

These are just a few examples of how autonomic function testing is being used outside of the clinical setting to shed new light on several research areas. Check out Part 1 and Part 2 of our webinars demonstrating how to use BIOPAC equipment and software in autonomic function research.


For additional information on how BIOPAC can assist you with a wide range of research and educational applications, contact your local sales representative.

Measuring Moods: Signals for Insight into Emotion

“Do you ever look at someone and wonder what is going on inside their head?”

Joy, an anthropomorphized manifestation of happiness, delivers this line at the opening of Pixar’s 2015 animated hit “Inside Out,” a film that explores the emotional struggles of its young protagonist. She could have been speaking for generations of researchers who have plumbed the depths of the human psyche for a better understanding of the mechanisms behind our feelings, moods, and emotions.

When today’s researchers talk about emotion, they typically do so in terms of affect, the underlying physiological and psychological experience of feelings and emotions as a reaction to stimuli. Affect and emotion are not the same thing, per se, but are fundamentally connected. While the feelings we describe as fear, joy, love, hate, etc. remain abstract, affect is more concrete. BIOPAC co-founder and head of R&D describes it as “the measurable quality or manifestation of emotion in the human body.”

This manifestation can be measured in the human nervous system’s response to stimuli. Depending on the nature of the stimuli and how this sensory data is interpreted by the central nervous system, an array of physiological responses can take place: heart rate changes, the stomach and muscle groups tense, skin temperature responds, triggering sweat glands, among others.

The signals corresponding to these reactions provide researchers with valuable data to help them better understand affect and emotion. These signals—electroencephalogram (EEG), electrodermal activity (EDA), electromyogram (EMG), heart rate, and respiratory rate, to name a few—can be recorded and measured using a range of currently available sensing technologies.

As an example, a 2019 study published through the Queensland University of Technology used respiration signals as a means of classification for human emotions such as happiness, sadness, surprise, disgust, fear, and anger. In the study, breathing signals, including airflow rate and volume, were acquired and recorded using a BIOPAC MP36 data acquisition unit while participants were shown seven film clips, each associated with a different emotion. The study concluded that the respiratory data was 80% effective in accurately classifying affective responses to the film stimuli.

A team of researchers at the Khwaja Fareed University of Engineering and Information Technology in Pakistan took their investigation into the connection between physiological signals and emotion a step further. They used a similar approach by measuring participant response to movie clips, however this time, four types of physiological signals were acquired, including ECG, EMG, respiration, and skin conductivity (SC). The data was acquired with a wide range of signal sensors and analyzed via a BIOPAC MP160 DAQ System.Signals for Emotion

Signal sensing technology also allows researchers to study emotion in multiple participants simultaneously, as was the case in a 2020 dyadic study of how a parent’s stress and emotional suppression affects their children. The study measured physiological responses of both parents and children using ECG and impedance cardiography (ICG) via a BIOPAC MP150 data acquisition unit.

The mysteries of human emotion are being unlocked through a growing understanding of the affective response to stimuli. For more information on how physiological signals can be gathered and analyzed for this purpose, see our app note on emotional state physiology as well as our webinar Emotion and Objective Physiological Measures.


Contact BIOPAC for the latest information on how we can help you measure affect in the lab.

Choosing the Right Signal: Easy as 1, 2, 3

In physiology and life sciences, researchers rely on a wide range of signals to gather data from humans and animals. These signals provide critical insight into how complex organisms function under a myriad of conditions. However, this wealth of potential data sources can also present a challenge for researchers: choosing the right signals on which to focus their data gathering. For those lacking a background in the disciplines and mechanisms behind these signals, sifting through the available methodology can be overwhelming. The best place to begin is by considering one or a combination of the “Big Three” physiological signals: ECG, EDA, and respiration.

In physiology and life sciences, researchers rely on a wide range of signals to gather data from humans and animals. These signals provide critical insight into how complex organisms function under a myriad of conditions. However, this wealth of potential data sources can also present a challenge for researchers: choosing the right signals on which to focus their data gathering. For those lacking a background in the disciplines and mechanisms behind these signals, sifting through the available methodology can be overwhelming. The best place to begin is by considering one or a combination of the “Big Three” physiological signals: ECG, EDA, and respiration.

One from the Heart

Changes in heart rate can provide information on both the physiological and psychological state of a research participant. Electrocardiography (ECG or EKG) is a biopotential measurement that provides direct metrics on electrical voltage changes in the heart. With the help of simple hardware and software, it is possible to record these voltage variations as waveforms to track how the heart responds to stimuli. Additional data can be provided by creating reoccurring reference points in the waveform, measuring the intervals between beats, and calculating heart rate variability to track changes over time or in response to stimuli.

Skin Deep

Electrodermal Activity (EDA) provides one of the best measurements of how the body responds to psychological stress and anxiety. It can be simply understood as a measure of changes in the electrical conductance of the skin in relation to the production of sweat. The physiological process of EDA comprises two components, skin conductance level (SCL) and skin conductance response (SCR). SCL is a tonic level that slowly changes over time, measuring the period for response to a stimulus to occur, from its onset to its peak. SCR reflects the phasic response to an arousing stimulus that is shown in faster changes of the skin conductance level. As an example of the application of EDA and ECG measurements in psycho-physiological research, a recent study applied both signals in measuring the cognitive states of gamers during human-computer interaction (HCI).

Breathe Easy

ArachnophobiaAs with changes in heart rate, variations in breathing cycle reveal how subjects respond to a wide range of stimuli and conditions. The signal produced by the respiratory cycle is a transduced physiological signal. As such we can apply mechanisms to create a voltage potential to measure phases of inhalation and exhalation in this cycle. This data can be represented in waveforms, providing data on respiratory rate, amplitude, and respiratory sinus arrhythmia (RSA). The latter combines respiratory data with ECG signal data to show changes in heart rate in response phases in the respiratory cycle. A 2020 machine learning study for the development of virtual reality applications combined respiration, EDA, and ECG signals to measure participant’s fear response to spiders, an example of how all three signals can be simultaneously utilized in psychophysiology research.

Choosing the right signal shouldn’t be the biggest hurdle to designing your next research project. Applying one or more of these “Big Three” can cover a wide range of data gathering goals.


For additional assistance, consult BIOPACS online resources on Life Science and Physiological Signals or contact your local BIOPAC representative.

error: Content is protected !!






