Brain and Body: SPA-fNIRS Solves Physiological Signal Noise

Functional near-infrared spectroscopy (fNIRS) offers researchers a powerful noninvasive tool for studying brain activity by measuring changes in blood oxygen levels. These changes reflect how various brain regions respond to stimuli such as tasks that involve thinking, emotion, movement, and social interaction. These are often in natural, real-world settings that are not possible with other brain imaging methods. However, fNIRS is not without its own limitations. Systemic fluctuations in the body, such as breathing patterns, cardiovascular changes, and autonomic responses, can result in signal noise that is misinterpreted as brain activity by traditional fNIRS. The solution: a visit to the SPA.

Systemic Physiology Augmented fNIRS (SPA-fNIRS) is an advanced approach to fNIRS that goes beyond measuring local changes in cerebral oxygenation. While standard fNIRS measures cortical hemodynamics by tracking oxygenated (HbO) and deoxygenated (HbR) hemoglobin, noise originating from systemic physiological changes can corrupt those signals. Combining data from both neural and systemic physiological signals, SPA-fNIRS provides researchers with a more diverse and accurate view of how the brain and body interact in real time.

The method is being applied across various fields, including psychophysiology, cognitive neuroscience, exercise physiology, mental health, and human performance research. Studies have utilized SPA-fNIRS to investigate a range of topics, including meditation and emotional regulation, movement control, and social interaction. The broader goal is to move beyond studying the brain in isolation and to understand it as part of an integrated mind-body system. This holistic view is transforming how scientists interpret brain-function data, opening new paths for applied research in education, rehabilitation, and human-machine interface design.

soundResearchers in India investigated the impact of a traditional sound-based meditation technique, known as the Mind-Sound Resonance Technique (MSRT), on both brain and heart activity. Using fNIRS to track changes in oxygen levels in the prefrontal cortex, and a BIOPAC data acquisition and analysis system with AcqKnowledge software to record and analyze heart rate variability (HRV), the study employed a SPA-fNIRS design, integrating neural and physiological data in a single, synchronized dataset. HRV analysis allowed the researchers to quantify shifts in autonomic balance during and after meditation. The results showed increased oxygenation in the right prefrontal cortex and enhanced low-frequency HRV components, reflecting greater parasympathetic regulation. Together, these findings suggest that sound-based meditation not only improves brain oxygenation but also promotes calmer, more balanced heart-brain dynamics, illustrating how SPA-fNIRS methods can reveal the comprehensive physiological impact of mindfulness practices.

In her doctoral research at the Université de Lille in France, neuroscientist Aurore Guérin examined how the brain controls movement speed using a multimodal combination of fNIRS and physiological data recording systems. Participants performed repetitive arm movements at fast, natural, and slow tempos. At the same time, the study captured oxygenation in the prefrontal and motor cortices using fNIRS, alongside heart rate and respiration signals collected with a BIOPAC data acquisition system. A respiratory effort transducer measured breathing patterns, while a BioNomadix ECG module recorded cardiac activity for HRV analysis. All physiological signals were synchronized and analyzed in AcqKnowledge software, allowing the team to identify and remove systemic influences (e.g., heartbeat and breathing rhythms) from the fNIRS signals, following a SPA-fNIRS approach. The results revealed that faster movements primarily engaged motor regions, while slower, more deliberate pacing resulted in higher prefrontal activation, reflecting greater cognitive control. By integrating physiological monitoring with fNIRS, the study provided a clearer picture of how the brain and body coordinate timing and control during movement.

These studies illustrate how SPA-fNIRS is reshaping the way scientists investigate the interaction between brain and body. By combining neural and physiological data in a single synchronized system, researchers can separate brain activity from systemic noise and uncover the interplay between cognition, emotion, and autonomic regulation. For more information on this topic, watch our webinar on Multimodal SPA-fNIRS and check our our latest multimoldal fNIRS research products.


Are you planning a study that blends fNIRS with other physiological signals? Contact your local BIOPAC customer service representative to learn more about how SPA-fNIRS can benefit your research.

Body Electric: Bioimpedance in Physiology Research

With nearly 70 percent of our bodies made up of water as well as a variety of dissolved salts, humans are natural conductors of electrical current. However, various elements of the human body restrict or impede the flow of electrical current, a phenomenon termed “bioimpedance.” Variations in restrictiveness to the flow of electrical current through an organism can provide researchers with a wealth of information on a range of physiological conditions.

Bioimpedance can be defined as the response of an organism to an externally applied electrical current. For more than a century, researchers have used bioimpedance as a safe and noninvasive metric for a range of physiological data, from measuring body composition through bioimpedance analysis (BIA) to investigating various biological systems such as cardiovascular function via impedance cardiography.

While not new, breakthroughs in technology and techniques for recording and analyzing bioimpedance have made it increasingly accessible to researchers. Through impedance cardiography and cardiac output, researchers gain access to a wide range of cardiovascular and hemodynamic data, including heart rate (HR), cardiac output (CO), acceleration index (AI), mean blood pressure (MBP), stroke index (IA), stroke volume (SV), and systemic vascular resistance, to name just a few.

The recent development of trans-radial electrical bioimpedance velocimetry (TREV) has provided researchers with a heightened level of accessibility when attempting to record high-quality data. Unlike traditional transthoracic methods of recording impedance cardiography signals, TREV measures blood movement through the radial and ulnar arteries of the forearm. The approach streamlines electrode placement, making it less prone to complications associated with other impedance cardiography methods.

bioimpedanceOne example of the practical application of impedance cardiography is in research on stress as it relates to coronary health. A 2019 study published by researchers at the University of Illinois at Urbana-Champaign compared the stress response of a group of young participants to that of participants over the age of 55 who had been diagnosed with coronary artery disease (CAD). Researchers recorded physiological signals, including electrocardiogram (ECG), impedance cardiogram (ICG), and continuous BP during rest, stress, and recovery. ECG and ICG signals were collected using BIOPAC BN-NICO wireless amplifiers and BN-EL50-LEAD4 leads. Researchers found ICG provided a reliable metric for stress response.

Recently, a team from the University of California, Santa Barbara (UCSB) employed TREV to demonstrate how this newer bioimpedance metric can be used to track event-related contractility in a maximal grip force experiment. The experiment employed TREV electrodes attached to the participant’s forearm and amplified by a NICO100D smart amplifier. Additionally, ECG electrodes were amplified by an ECG100D while the respiration cycle was recorded via a TSD221-MRI respiration belt. All data signals were acquired and analyzed using an MP160 system running AcqKnowledge software. The experiment confirmed the effectiveness of TREV as a reliable metric for connecting the cardio-sympathetic drive to other physiological conditions, such as force production.

While not new to physiological research, the application of bioimpedance continues to flourish and evolve. To learn more about how bioimpedance is being applied in the research setting as well as new techniques, check out BIOPAC’s webinar on bioimpedance and cardiac output focusing on TREV.


To learn more about incorporating impedance cardiography and TREV in your study, contact your regional BIOPAC sales representative today.

T4 Conference Wrap-up

August is a month of barbecues, baseball, and last-minute vacations against the backdrop of a fading summer, and the eighth month of 2019 proved to be an equally exciting time at BIOPAC, with something of a pleasant vacation thrown in. On August 12-14, BIOPAC hosted its 2nd Biennial “Tools, Trends, Techniques, and Technology” Human Physiology Conference, known as “T4” to our friends and partners around the world. This three-day event, first held in 2017, featured lively, informative sessions hosted by BIOPAC staff, partners, noted academics, and industry experts, and covered a wide range of physiological techniques and disciplines. Over 150 attendees joined BIOPAC at the 2019 T4 Conference staged once again at the beautiful University of California at Santa Barbara campus. Participants and instructors winged in from China, Australia, Germany, Sweden, Italy, Spain, U.K., Ireland, and Egypt, as well as from wide regions of the U.S and Canada to soak up the idyllic surroundings of this ocean-side campus.

The focus of BIOPAC’s T4 Conference was to provide a fun, relaxed environment while hosting nearly 40 hands-on, human physiology training workshops chaired by over 20 distinguished instructors from around the globe. One of the many conference highlights was the “Mindfulness, Meditation, and Measurement: Mindfulness Exercises in Physiological Monitoring” session, hosted by Dr. Allan Weiss of the University of Southern California and  BIOPAC Co-founder and Director of R & D Alan Macy. These sessions, conducted in two parts over a two day period were booked beyond capacity, even though the early morning fog hadn’t yet lifted from the campus skyline.

The varied additional sessions covered a range from the basics, “Setting Up Your Lab, Getting Great Data and Troubleshooting,” (hosted by Dr. Terry Blumenthal of Wake Forest University, and BIOPAC’s Alan Macy and Tim Cook), and “Creating Your Own Lessons Using BSL PRO,” (hosted by Dr. Taffeta Elliot of the New Mexico Institute of Mining and Technology), to exciting new technologies such as “Integrating Screen-based Eye Trackers with AcqKnowledge,” with Keith Jackson of BIOPAC partner company EyeTech, BIOPAC CEO Frazer Findlay, and BIOPAC Engineering Manager Ed Peterlin. Additional wide-ranging physiological disciplines were also covered, including MRI techniques, stimulation, and exercise physiology. All sessions were conducted using BIOPAC hardware and software systems, as well as platforms provided by BIOPAC partners such as Cedrus, fNIR, WorldViz, Psychology Software Tools, and CNSystems. At the end of each day, it was time to relax and unwind with a beverage of choice, a a walk along the beach, and some good conversation. Each evening featured excellent meals and camaraderie in the relaxed yet elegant environment of some of Santa Barbara and Goleta’s most stunning surroundings. After three great days of immersive sessions, it came time for everyone to part ways, having forged new collaborative partnerships and an enhanced knowledge about the full potential of BIOPAC and BIOPAC partner products.

You don’t have to wait for T4 2021 to learn more about life science data—watch Fundamentals of Physiological Data Recording now!

For a closer look at T4, and a preview of what is sure to be an exciting 2021 event, we invite you to visit our T4 Human Physiology Conference page.

Looking for additional resources, tips, tricks, and expert advice on BIOPAC and BIOPAC Partner products? Please also visit our Webinars and Video Tutorial pages.


BIOPAC offers a wide array of wired and wireless equipment that can be used in your research. To find more information on solutions for recording and analyzing signals such as ECG, heart rate, respiration and more using any platforms mentioned in this blog post, you can visit the individual application pages on the BIOPAC website.

CNAP HD: Noninvasive Hemodynamic Monitoring in Research

Cardiac Output (CNCO® ) and further essential hemodynamic parameters calculated from the continuous non-invasive arterial pressure curve (CNAP®) by means of the Pulse Contour Analysis shows high accuracy and high trending ability (precision) compared to invasive clinical standards (e.g. thermodilution and PiCCO) with valuable benefit for scientific and clinical research.

By Dr. Jürgen Fortin, CEO, CNSystems

Pulse Contour Analysis (PCA) for deriving complete Hemodynamics from continuous blood pressure wave (CNAP)

Pulse Contour Analysis (PCA)[1] derives important physiological information on preload, contractility, afterload and compliance of the heart from the well validated CNAP® Continuous Noninvasive Arterial Pressure Curve[2],[3]. By adding biometric patient data Stroke Volume (SV) and therefrom Continuous Noninvasive Cardiac Output (CNCO®), both essential hemodynamic markers, are calculated. Further hemodynamic parameters such as Systemic Vascular Resistance (SVR) as well as all indexed values SI, CI or SVRI are derived completing the hemodynamic picture.

Validation: CNCO® is clinically validated against invasive methods

Non-invasive continuous CNCO® is the non-invasive continuous cardiac output calculated from CNAP® Arterial Pressure as described above.

Accuracy of CNCO® compared to clinical standards such as invasive thermodilution (TD) or PiCCO is expressed as percentage error. In 1999, Critchley and Critchley suggested a percentage error of 30% or less[4]. In clinical practice, however, percentage errors of 40-45% are more realistic for the interchangeability between two CO-measurement methods (meta-analysis by Peyton and Chong[5]).

Trending ability is the precise tracking of changes in CO. According to Critchley, Lee and Ho, reliable trending ability[6] is indicated by concordance rates of > 90%. Vincent and colleagues state that following hemodynamic trends may be more important than absolute values[7].

CNCO® shows both high accuracy as well as high trending ability (precision) compared to the invasive clinical standards thermodilution and PiCCO fulfilling all Critchley criteria:

Bland-Altman plots show

  • Small bias and narrow limits of agreement
  • Percentage errors ≤ 30% (according to strict Critchley standard [8],[9])
  • Concordance rates ≥ 90% (according to standard [10])

Read more on CNAP accuracy here and here.

Benefit of continuous BP, CO & SVR in research (examples)

Blood pressure, cardiac output and vascular resistance are used to differentiate between challenge and threat states (positive and negative stress)[11],[12] and to quantify emotional response[13] in psychophysiological studies. A challenging situation causes a far bigger rise in cardiac output than a threating state. Total peripheral resistance rises in threat state but shows strong decrease in the challenging situation.

CNCO® is available with the CNAP® HD feature, currently only available in Europe.

For more information on CNAP, to include references to studies and research and plots, click here.

[1] https://en.wikipedia.org/wiki/Cardiac_output#Pulse_Pressure_methods
[2] Jeleazcov C et. al. Precision and accuracy of a new device (CNAP®) for continuous noninvasive arterial blood pressure monitoring: assessment during general anaesthesia. BJA. 2010; 105(3):264-272
[3] Biais, M. et. al. Continuous non-invasive arterial pressure measurement: Evaluation of CNAPTM device during vascular surgery Ann Fr Anesthesia
[4] Critchley, L. A., & Critchley, J. A. (1999). A meta-analysis of studies using bias and precision statistics to compare cardiac output measurement techniques. Journal of clinical monitoring and computing, 15(2), 85–91
[5] Peyton PJ, Chong SW: Minimally invasive measurement of cardiac output during surgery and critical care. Anesthesiology 2010; 113:1220-35

[6] Critchley LA, Lee A, Ho AMH: A critical review of the ability of continuous cardiac output monitors to measure trends in cardiac output. Anesth Analg 2010; 111:1180-92.

[7] Vincent JL et al.: Clinical review: Update on hemodynamic monitoring – a consensus of 16. Critical Care 2011, 15:229.

[8] Critchley, L. A., & Critchley, J. A. (1999). A meta-analysis of studies using bias and precision statistics to compare cardiac output measurement techniques. Journal of clinical monitoring and computing, 15(2), 85–91

[9] Peyton PJ, Chong SW: Minimally invasive measurement of cardiac output during surgery and critical care. Anesthesiology 2010; 113:1220-35.

[10] Critchley LA, Lee A, Ho AMH: A critical review of the ability of continuous cardiac output monitors to measure trends in cardiac output. Anesth Analg 2010; 111:1180-92.

[11] Kirby, L. D., & Wright, R. A. (2003). Cardiovascular correlates of challenge and threat appraisals: A critical examination of the Biopsychosocial Analysis. Personality and Social Psychology Bulletin, 7, 216-233.

[12] Tomaka, J., Blascovich, J., Kelsey, R. M., & Leitten, C. L. (1993). Subjective, physiological, and behavioral effects of threat and challenge appraisal. Journal of Personality and Social Psychology, 65, 248-260.

[13] Lackner, H. K., Weiss, E. M., Schulter, G., Hinghofer-Szalkay, H., Samson, A. C., & Papousek, I. (2013). I got it! Transient Cardiovascular Response to the Perception of Humor. Biological Psychology, 93, 33–40.

For more information on BIOPAC’s Noninvasive Blood Pressure monitoring and measurement systems and advanced functionality in the area of cardiovascular hemodynamics, to include CNAP noninvasive blood pressure systems, visit BIOPAC’s NIBP page or view BIOPAC’s NIBP amplifiers (MRI and small animal applications are also supported) and related equipment for a wide variety of research applications.

BIOPAC Systems, Inc. provides life science researchers and educators with data acquisition and analysis systems that inspire people and enable greater discovery about life.  Visit us at www.biopac.com.

CNAP Noninvasive Blood Pressure Technology – An Overview

The interaction of an easy-to-use finger sensor with unique control loops and algorithms as well as with NBP provides high accuracy of the BP signal – equivalent to invasive arterial line.

By Dr. Jürgen Fortin, CEO, CNSystems

Continuous noninvasive arterial blood pressure measurement (CNAP®) is the technique for measuring blood pressure (BP) that is, as the title describes, both continuous and noninvasive. CNAP combines the advantages of the following two clinical “gold standards:” it measures blood pressure (BP) continuously in real time like the invasive arterial catheter system (IBP) and it is noninvasive, like the standard upper arm sphygmomanometer (NBP).

The CNAP principle is the intelligent interaction and synergy of IP-protected features and functions based on the well-known Vascular Unloading Principle by Penaz (with significant improvement over the past 15 years) [1], on unique control algorithms (e.g. VERIFI) [2] and on calibration mechanisms, making it a reliable and accurate method with results comparable to the intra-arterial measurement.

Pulsating blood flow detected by infrared light sensors is kept constant by the counter pressure exerted on the artery through inflating or deflating the integrated cuff. The resulting pressure in the finger sensor corresponds to the real arterial pressure [1]. The pressure system is controlled by multiple digital feedback loops. The “VERIFI-algorithm” is used for high fidelity signal processing and artifact rejection. This is a superior method for filtering vasomotoric influences, in contrast to Standard methods based on Vascular Unloading Principle, which can show false BP shifts due to influence of vasomotoric tone.

In terms of calibration, CNAP is the only available technology calibrating to directly measured upper arm values, providing blood pressure variations in absolute values at heart-level. The interaction of finger sensor with NBP provides high accuracy of the BP signal – equivalent to invasive arterial line.

Use of CNAP provides researchers with several benefits, including: 

  •  NBP Cuff – Automated scaling to brachial pressure (gold standard) at start of measurement and user programmable
  • Double finger sensor – Quick and error-free application
  • Continuous waveform – Continuous tracing of hemodynamic changes without interruptions to recalibrate; beat-to-beat systolic, diastolic, mean BP values
  • Connectivity – Plug-and-play integration into all common data acquisition systems and patient monitors
  • Data storage and analysis – Unlimited data storage via USB interface. Data format (*.csv) for import into all common data analysis software packages (e.g. BIOPAC’s AcqKnowledge®, Matlab, MS Excel, SPSS, etc.)
  • Accuracy – Reliably equivalent to invasive blood pressure (IBP) [3], [4]

Notes:

[1]  Jan Penaz, Brno, Czech Republic 1973.

[2]  Fortin J et al.: Continuous non-invasive blood pressure monitoring using concentrically interlocking control loops. Comput in BiolMed 36 (2006) 941 – 957.

[3]  Jeleazcov C et. al. Precision and accuracy of a new device (CNAP) for continuous noninvasive arterial blood pressure monitoring: assessment during general anaesthesia. BJA. 2010; 105(3):264-272.

[4]Biais, M. et. al. Continuous non-invasive arterial pressure measurement: Evaluation of CNAP device during vascular surgery Ann Fr Anesthesia.

Studies documenting the CNAP device’s performance can be found below:

Arterial stiffness is higher in older adults with increased perceived fatigue and fatigability during walking

Does conscious intention to perform a motor act depend on slow cardiovascular rhythms?

The Effect of Mainstream Media on Body Image and Stress Reactivity in Latina Females

For more information on BIOPAC’s Noninvasive Blood Pressure monitoring and measurement and cardiology research solutions, to include CNAP noninvasive blood pressure systems, visit BIOPAC’s NIBP page or view BIOPAC’s NIBP amplifiers (MRI and small animal applications are also supported) and related equipment for a wide variety of research applications.

BIOPAC Systems, Inc. provides life science researchers and educators with data acquisition and analysis systems that inspire people and enable greater discovery about life.  Visit us at www.biopac.com.

Impedance Cardiography

By Alan Macy, BIOPAC Systems, Inc.

ICG is a measurement method that is primarily used to determine aspects of Cardiac Output (CO).   CO is the total amount of blood, pumped from both the left and right ventricles of the heart for each of its successive systolic phases, over the course of one minute.  The systolic phase, or systole, is when the heart muscle contracts and pumps blood from the chambers (left and right ventricles) into the arteries.  Typical resting cardiac output is 4.9 liters/minute for an adult human female and 5.6 liters/min for an adult human male.

Left ventricular cardiac output is the CO from the left ventricle only and can be estimated via a non-invasive technique called Impedance Cardiography (ICG), which provides an approximation of Stroke Volume (SV).  If SV and Heart Rate (HR) are known, then CO can be determined by:


SV * HR = Cardiac Output


ICG is measured by introducing a constant current (I) through the thoracic volume and then measuring the resulting voltage (V).   The following equation is used to determine thoracic impedance (Z).

 Z = V/I

 Where V and I are the root mean square (rms) values of the measured voltage and supplied (known) current.  ICG systems induce a constant magnitude, alternating current (I) through the thorax via electrodes.  A separate set of electrodes (placed between the current electrodes) monitor the voltage (V) developed across the thorax.  Because the magnitude of I is constant, V will vary in direct proportion to Z.


The applied current (I) flows through the volume of the thorax, which includes skin, skeletal muscle, the lungs, the heart and blood.  Because blood is a conductor, the changes in blood volume during a cardiac cycle produce a measurable change in thoracic impedance.  Researchers have developed equations for estimating left ventricular SV based on thoracic impedance, with the most widely used equation being that developed by Kubicek, et al. (1966):

 SV = rho x (L/Zo)² x LVET x (dZ/dt Max)

 Where:

 SV = Stroke volume (ml)

rho = Resistivity of blood (Ohms·cm) which is assumed to be a constant 135 Ohms·cm (Quail, Traugott, Porges, & White, 1981).

L = Length or distance between inner band (voltage monitoring) electrodes (cm)

Zo = Basal Thoracic Impedance (Ohms)

LVET = Left Ventricular Ejection Time (seconds)

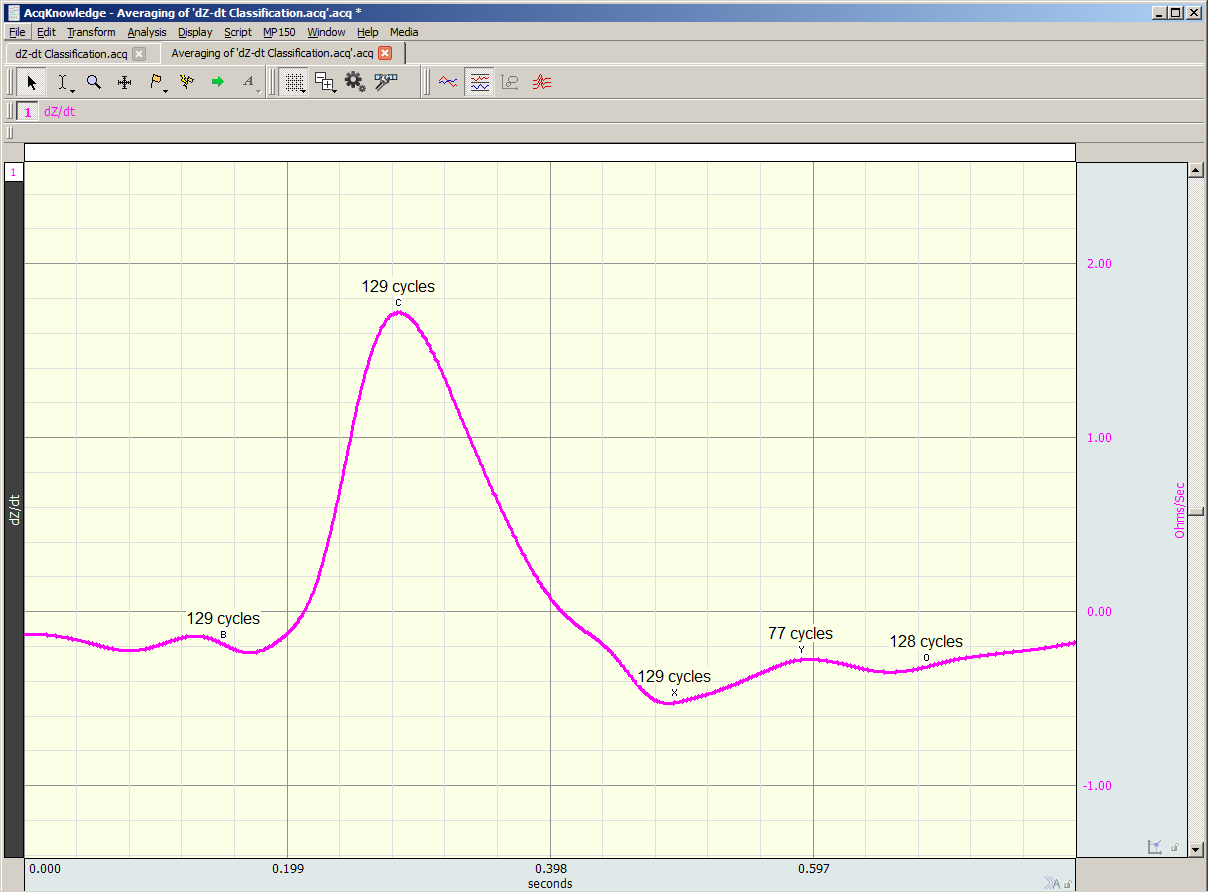
dZ/dt Max = Absolute value of the cyclic peak of the derivative of Zo (Ohms/sec)

LVET varies inversely with heart rate under a broad range of circumstances.  LVET should not be treated as a constant in the Kubicek equation.  Unlike Length (L), which is constant during a session, Thoracic Impedance (Zo) also varies some, although not as much as LVET.   Blood resistivity (rho) also may vary with changes in hematocrit levels and red blood cell orientation, but that variation has largely been ignored because of the difficulties associated with having to draw blood to measure rho.

Impedance Cardiography (ICG) is an indirect measurement of Stroke Volume (SV).  Studies have been performed to correlate ICG to SV, using thermodilution as reference and have found that accuracy improves when variables such as age, height, sex, waist circumference and weight are factored into the SV estimation.  Accordingly, ICG measures are best interpreted as a relative, versus absolute, indication of SV.  Even so, as a relative measure, ICG can provide a clear indication of important physiological processes associated with homeostasis and hemodynamic changes.

Research in psychophysiology, and other areas of physiology, focuses on the left ventricle because it pumps blood that supplies the metabolic requirements of striated (skeletal and cardiac) musculature and thus fundamentally supports behavior and exercise.  For Impedance Cardiography (ICG), the left ventricle is principally important because the dZ/dt signal primarily indicates left ventricular blood ejection into the aorta.  There is very little influence from right ventricular blood ejection in the ICG signal.

For more information on BIOPAC’s ECG solutions, visit BIOPAC’s ECG-Cardiology page or view BIOPAC’s full line of electrodes, amplifiers, and wearable, wireless transmitters and loggers.

For more information on BIOPAC Systems, visit us at www.biopac.com.

error: Content is protected !!