
Tick, Tock: Pulse Transit Time Offers Noninvasive Physiological Insights

A split second can reveal much about the cardiovascular system and the other physiological systems it influences. Pulse Transit Time (PTT) captures one of those critical moments, the brief interval it takes for the pressure wave generated by contraction of the left ventricle to travel from the heart to a peripheral site in the body. That tiny stretch of time tells us something important about the arteries—namely, how stiff or flexible they are in that moment. When blood pressure rises and the vessel walls tighten, the pulse wave travels more quickly, so PTT gets shorter. When the vessels are relaxed and more elastic, the wave slows down, and PTT becomes longer. Because of this back-and-forth relationship, PTT gives researchers a simple, noninvasive way to track changes in vascular tone, blood flow dynamics, and autonomic nervous system activity.

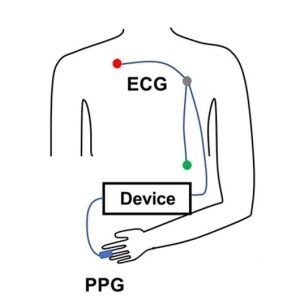
PTT is determined by measuring the volume or pressure pulse at a proximal artery (such as the carotid or brachial) and at a distal artery (such as the finger or toe). To prevent confusion in PTT nomenclature across different methods, some researchers use labels formed from the first one or two letters of the starting and arrival signals. PTT-PP refers to PTT recorded using PPG between a proximal and a distal artery, PTT-EP refers to PTT measured between electrocardiogram (ECG) proximally and photoplethysmogram (PPG) distally and PTT-IP refers to PTT recorded between Impedance Cardiogram proximally and PPG distally.

PTT-EP is recorded by simultaneously recording ECG and PPG. PPG is usually recorded at the finger using a small infrared light to detect changes in blood flow with each heartbeat. As blood pulses into the area, the amount of light absorbed changes, creating a waveform with a clear rise and peak. To calculate PTT-EP, researchers measure the time between the ECG spike and a specific point on the PPG wave, typically the point at which the wave first rises or reaches its peak. Strictly speaking PTT-EP is not a true PTT as it includes pre-ejection period, a short delay between electrical activation of the ventricles and actual ejection of blood. For that reason, it is sometimes referred to as Pulse Arrival Time (PAT). Even so, the ECG-to-PPG approach remains widely used because it is noninvasive, reliable, relatively inexpensive, and straightforward to implement across a range of study designs.

Typical lab configurations focus on integrated, multimodal data acquisition systems that allow researchers to record ECG and PPG signals simultaneously using dedicated amplifier modules, with analysis performed via software. These systems enable precise channel synchronization, automated waveform feature detection, beat-by-beat PTT computation, and data export for statistical analysis. In some studies, researchers also integrate noninvasive blood pressure (NIBP) modules to directly examine the relationship between PTT and systolic or mean arterial pressure, strengthening the interpretation of vascular changes.

Obtaining high-quality PTT data requires attention to detail and careful planning. Participants should rest in a quiet, temperature-controlled room, since vascular tone can be affected by stress, ambient temperature, and sympathetic activation. Avoid testing immediately after meals or the consumption of caffeine or nicotine, which can alter cardiovascular dynamics. Proper sensor placement and stable contact pressure are critical for minimizing motion artifacts and waveform distortion. Consistent measurement timing, accounting for diurnal variation, helps ensure consistent data quality across sessions. Signal processing choices also matter. Careful filtering (see example study below), accurate event marking, and careful peak or foot detection are essential to ensure that the measured interval truly reflects physiological timing rather than processing artifacts.

When these best practices are followed, PTT becomes a versatile research tool. It has been used to study stress reactivity, autonomic regulation, arterial stiffness, posture-related hemodynamics, exercise physiology, sleep physiology, and the development of cuffless blood pressure estimation technologies. Recent studies illustrate both the promise and the practical considerations of PTT measurement.PTT Diagram
At the Georgia Institute of Technology, researchers explored whether noninvasive nerve stimulation applied at the ear, neck, or wrist could reduce acute stress responses in healthy young adults. During laboratory sessions that included mental arithmetic and cold exposure tasks, cardiovascular signals were recorded using a BIOPAC MP data acquisition unit and a PPG100C to capture ECG and fingertip PPG. PTT served as a key marker of sympathetic (“fight-or-flight”) activation. The research team found that stimulation at the ear and wrist significantly reduced stress-related cardiovascular changes compared to a sham condition, supporting the potential for wearable systems that integrate neuromodulation and real-time cardiovascular monitoring.

In another study published in Nature, researchers at Columbia University tackled a common problem in cuffless blood pressure monitoring: when wearable sensors sit above or below heart level, changes in arm position create hydrostatic pressure errors that skew estimates based on PTT. Cuffless systems frequently use PTT to estimate blood pressure, but arm movements can distort that timing and reduce accuracy. To investigate this, the team collected synchronized physiological data using a BIOPAC data acquisition system to record high-resolution ECG signals via a BIOPAC ECG amplifier and fingertip PPG signals via BIOPAC PPG100C, while a BIOPAC NIBP module measured reference blood pressure using upper-arm and finger cuffs. Participants also wore wrist and upper-arm inertial sensors (IMUs) to track how the arm was positioned relative to the heart. The research team then developed a method called IMU-Track, which uses motion data and deep learning to correct PTT for arm height effects, improving the accuracy of blood pressure predictions across different postures. Their findings showed that accounting for sensor position dramatically reduced errors in cuffless blood pressure estimation, suggesting that combining motion tracking with PTT measurements could make wearable BP monitoring more reliable in everyday use.

When applied correctly, PTT provides a potent, noninvasive tool for assessing cardiovascular function—one measured in milliseconds but capable of revealing meaningful physiological change. For more information on integrating PTT into research, see our PTT webinar.


If you are planning to use PTT in your next study, don’t hesitate to reach out for our highly capable team of experts for assistance in identifying the equipment and procedures to ensure your success.

Healing Hands: EDA and Affective Touch

“Nothing eases suffering like human touch.” — Bobby Fischer

The gentle caress of a mother to her child. A reassuring pat on the shoulder from a friend. The touch of another human is one of the first forms of communication we experience in life, preceding the development of spoken language. Touch can have a remarkable effect on our emotional, psychological, and physiological states. It shapes our relationships with others and helps us build social connections.

The positive effects of touch are primarily associated with affective touch, characterized by comforting, caress-like stroking that activates C-tactile afferent (CT-afferent) neurons in the skin of mammals (including humans). Affective touch has attracted the interest of researchers seeking to decode how the sympathetic nervous system confronts and manages a variety of challenges, including pain regulation, stress management, and social interactions. The subject has drawn attention in the study of neurodevelopmental disorders, such as Autism Spectrum Disorders (ASD), where it is playing an essential role in understanding the sensory and social challenges facing individuals with atypical neurocognitive function.

While studies on touch, and affective touch specifically, utilize a range of physiological signals to gather data, electrodermal activity (EDA) has proven particularly useful in this area. Also referred to as Galvanic Skin Response (GSR), EDA provides a direct window into the sympathetic nervous system, which is responsible for emotional or affect-related arousal. When someone experiences pleasant or meaningful touch (e.g., a gentle stroke or supportive hand), the brain triggers subtle changes in sweat gland activity manifested as shifts in skin conductance. These changes occur when people aren’t fully aware of their emotional response. This makes EDA a sensitive, objective marker of how the body reacts to social and tactile experiences. In studies of affective touch, researchers track EDA to see whether a touch feels calming, engaging, or stressful, and how these responses differ across individuals or clinical groups such as autistic youth. Because EDA reflects genuine physiological arousal tied to emotional processing, it helps scientists understand the underlying autonomic mechanisms that shape how we experience social touch.

Researchers at the University of Tours in France examined how children with ASD respond to gentle, affective touch to determine whether they exhibit physiological patterns that differ from those of their neurotypical peers under the same conditions. The team measured multiple aspects of the autonomic nervous system, including EDA and electrocardiogram (ECG). These signals were collected using a BIOPAC MP36 data acquisition and analysis system to capture subtle changes in sympathetic arousal. Researchers collected EDA data using two 8 mm Ag/AgCl cup electrodes placed on the second phalanges of the index and middle fingers of the right hand. ECG was collected via two disposable vinyl electrodes placed on the sternum and on the right shoulder.  The study found that autistic children exhibited atypical EDA responses, showing either blunted or inconsistent autonomic reactions relative to controls, even when their outward behavior appeared typical. These results suggest that affective touch may not regulate internal arousal in autistic children the same way it does in others, providing an essential insight for therapies and sensory-based interventions that rely on touch.

In a similar study, a team from the University of Turin in Italy explored how autistic adults process affective touch by comparing their subjective ratings of pleasantness with their physiological responses. The researchers used a BIOPAC data acquisition research system with an EDA amplifier module to record EDA. At the same time, participants received gentle, slow stroking intended to activate the brain’s affective touch pathways. The goal was to determine whether autistic adults show a mismatch between what they say they feel and how their bodies respond. The findings revealed an apparent dissociation. While autistic participants often rated the touch similarly to neurotypical participants, their EDA responses differed significantly, indicating altered sympathetic arousal. This physiological-subjective mismatch provides compelling evidence that affective touch is processed differently in ASD, which may help explain challenges with social touch and sensory integration in everyday interactions.hands

Researchers from the University of Liverpool and Manchester Metropolitan University examined how brief, naturalistic social touch alters brain activity, autonomic physiology, and emotion recognition performance. Although this multimodal study did not focus on an autism-only sample, it is relevant to social-touch research more broadly and provides methodological examples that apply to ASD studies. To capture changes in prefrontal cortex function, the team employed a BIOPAC fNIRS imager system, with signals sent to a data acquisition unit. Further analysis of fNIRS signals was handled via fNIRS visualization software. Both EDA and photoplethysmography (PPG) were recorded at 2 kHz, using shielded Ag/AgCl electrodes on the index and fourth fingers and a PPG sensor on the middle finger, and were acquired and analyzed in AcqKnowledge. The results showed that social touch increased prefrontal activation, modulated cardiac and vascular dynamics captured via PPG, and produced measurable changes in sympathetic arousal, as indexed by EDA. Participants also demonstrated improved emotion-recognition accuracy following touch. Together, these findings suggest that social touch engages coordinated central and peripheral systems in ways that may support social cognition and emotional understanding.

These are just a few examples of how EDA is being used in research into affective touch. For additional information on integrating EDA in your study, see our multiple webinars on the subject.


Are you designing a study into affective touch or just planning a research project that will focus on EDA? Our customer service staff can help you streamline the process to produce best possible data.

Snooze Studies: Tools for Sleep Research

Comedic actress Mindy Kaling may have been speaking for everyone enamored with slumber when she wrote, “There is no sunrise so beautiful that it is worth waking me up to see it.”

Who hasn’t at one time preferred the restorative effects of a few extra hours of sleep to the harsh realities of the waking world? For both humans and other animals, sleep is indelibly linked to physical, mental, and emotional well-being.

In experimental biology, understanding sleep patterns and disruptions in both humans and animals provides essential insights into health, behavior, and neurological conditions. Techniques such as pulse oximetry, electroencephalography (EEG), and electromyography (EMG) provide critical data for unlocking the mysteries of sleep’s influence on human and animal biology.

Pulse oximetry is a noninvasive method that measures the oxygen saturation level of the blood, an indicator of respiratory efficiency during sleep. It is typically expressed as peripheral blood oxygen saturation or SpO2. This tool is especially useful in detecting sleep apnea and other breathing-related sleep disorders. EEG records electrical activity in the brain, offering a window into the different stages of sleep (from light sleep to deep sleep and rapid eye movement [REM] phases). It helps researchers understand how and why sleep patterns may be altered by various neurological diseases or conditions. EMG measures muscle activity and is crucial in examining the quality of sleep, particularly by identifying periods of muscle atonia during REM sleep, which can be disrupted in disorders like REM sleep behavior disorder.

BIOPAC and partner company Kissei offer SleepSign™ software, which provides essential tools and technologies that enhance the effectiveness of sleep studies. BIOPAC’s advanced multimodal setups can integrate data from EEG, EMG, pulse oximetry, and other sources for human participants and animals into a single coherent analysis platform. This integration allows for simultaneous recording and analysis of physiological and neurological signals during sleep.

boyA study published in the Sleep Research Society’s journal, Sleep, evaluated the effect of sleep on upper airway dynamics in obese children with obstructive sleep apnea syndrome (OSAS). Researchers used data gathered via a BIOPAC differential pressure transducer and flow transducer and fed into a data acquisition and analysis system to measure SpO2 and nasal-oral mask airflow of participants during MRI scans. The study results provided “further insight into the biomechanical basis of OSAS and assist in more effective management.”

SleepSign™ software plays a crucial role in automating the analysis of sleep data. It processes large volumes of EEG and EMG data, providing researchers with user-friendly interfaces and detailed reports that highlight anomalies and patterns in sleep stages. A study published in the 2023 issue of Neurobiology of Sleep and Circadian Rhythms investigated the long-lasting effects of sleep disruption on young prairie voles using a combination of BIOPAC’s AcqKnowledge software and SleepSign™ to acquire and analyze EEG and EMG data. The study concluded that early-life sleep disruption in postnatal voles has significant impacts on REM sleep patterns later in life.

These are just some of the technologies allowing researchers to dissect the nuances of sleep in both human health and animal models while also paving the way for novel therapeutic strategies to address sleep-related disorders. For additional information check our webinars on wireless animal EEG recordings and wireless logging.


Are you planning to explore the realm of sleep with your next study? Reach out to our experts for assistance selecting the best tools for gathering and analyzing sleep data.

error: Content is protected !!