Mind Over Matter: Cognitive Neuroscience and Aging

“Age is an issue of mind over matter. If you don’t mind, it doesn’t matter.”  —  Mark Twain.

While American author and humorist Mark Twain suggested that mental attitude could make aging less daunting, modern science shows that the changes our bodies and brains undergo over time are very real. Yet researchers are discovering that aging doesn’t have to mean inevitable cognitive decline. In fact, the growing field of cognitive neuroscience is revealing ways to track, understand, and even influence how our brains change with age, offering hope that we can preserve mental acuity, independence, and quality of life well into our later years.

When studying how aging affects the brain, cognitive neuroscience researchers use a variety of tools. In addition to standard behavioral tests like the Stroop test, n-back test, and verbal fluency exercises, which track reaction times, accuracy, and problem-solving strategies, they also rely on neuroimaging and physiological measurements to gather deeper insights. Neuroimaging techniques include electroencephalography (EEG), which monitors real-time electrical activity in the brain; functional near-infrared spectroscopy (fNIRS), which measures blood oxygen levels in specific cortical regions during cognitive tasks; and magnetic resonance imaging (MRI), which provides detailed structural and functional maps of the brain.

Other physiological signals play an essential role in this field, including heart rate variability (HRV), a key indicator of the autonomic nervous system’s ability to balance various physiological functions and handle stress. Electrodermal activity (EDA) allows researchers to track arousal among participants undergoing cognitive exercises. Electromyography (EMG) measures muscle activation during fine and gross motor tasks. Eye tracking and electrooculography (EOG) provide researchers with data on how aging impacts attention and the ability to process visual cues. Respiration and blood pressure provide vital information on vascular health, which is often linked to cognitive performance.

Taiwanese researchers from National Yang Ming Chiao Tung University in Taipei turned to HRV and fNIRS to uncover how aging and, more specifically, mild cognitive impairment (MCI), affect both brain and heart responses during cognitive tasks. Healthy young adults, cognitively healthy older adults, and older adults with MCI were asked to perform cognitive function and executive tests. Researchers recorded the participants’ prefrontal cortex (PFC) activation through changes in oxyhemoglobin using fNIRS and autonomic responses via HRV. The team gathered ECG data using a BIOPAC data acquisition module running AcqKnowledge data acquisition and analysis software, and equipped with an ECG amplifier. The study found that older adults who did not exhibit MCI showed lower global and executive cognitive performance, reduced HRV, but increased prefrontal activation. The research team interpreted this to be the result of compensatory neural effort. However, older adults with MCI showed even greater cognitive decline, but no further differences in HRV or prefrontal activation. The findings suggest that HRV and PFC activation patterns could serve as biomarkers for distinguishing healthy aging from early pathological decline.

To better understand how learning processes develop and change with age, researchers from Tilburg University in the Netherlands investigated how younger adults and older adults differ in their brain and body responses while learning a visuomotor sequence task. To capture these responses, the team measured EEG, skin conductance (EDA), heart rate, HRV, breathing rate, and eye movements during the task. Physiological data were collected using BIOPAC’s BioNomadix wireless dual ECG/respiration amplifier and PPG/EDA amplifier, which continuously recorded three-lead ECG, respiration, and EDA at 2,000 Hz, with signals processed and analyzed in AcqKnowledge software. This setup allowed the researchers to precisely synchronize physiological activity with learning performance. Both younger and older adults improved with practice, but older adults needed more trials to reach the same precision. Brainwave activity showed apparent age differences, while measures like HRV, respiration, and skin conductance did not. This suggests that EEG is a more sensitive marker of age-related learning changes and could help guide training programs for older adults.

readingA long-term study by researchers from Radboud University Medical Center in the Netherlands, together with UK collaborators, tracked a group of healthy older adults over nearly 11 years to see how their brain blood-flow regulation changed by their 80s. Using transcranial Doppler ultrasound to measure blood velocity in the middle cerebral arteries, the team also monitored control signals including heart rate, blood pressure, and breathing gases. Physiological data were recorded with a BIOPAC data acquisition and analysis system, with end-tidal CO₂ (EtCO₂) measured using capnography via a BIOPAC carbon dioxide measurement amplifier. The researchers found a slight decline in CO₂ reactivity but, surprisingly, an improvement in dynamic cerebral autoregulation (the brain’s ability to maintain steady blood flow despite blood pressure changes). These effects were most apparent in participants who later reported memory complaints, suggesting that while aging may reduce vascular responsiveness, the autoregulatory system may help compensate for early cognitive challenges. The findings show how vascular health in the brain relates to aging and memory, providing valuable insight for detecting early risks of dementia and shaping preventive strategies.

These studies highlight how combining brain imaging with physiological measurements is helping scientists reveal the complex relationship between aging, cognition, and overall health. Through cognitive neuroscience, researchers are identifying early signs of decline and gaining a better understanding of how the brain and body adapt over time. Research is paving the way to more effective screening, personalized interventions, and lifestyle strategies that may help people maintain mental sharpness and independence well into older age. For more information on the tools and techniques being applied to cognitive neuroscience research, see our Webinars and visit our page on Cognitive State Analysis.


Are you planning a study on how aging affects the brain or just looking to expand your cognitive neuroscience toolbox? Our customer service team is ready to help you find what you need to obtain the best possible data.


Only the Lonely: The Human Impact of Social Isolation

Humans by their nature are social creatures. A sense of community, daily interactions, and shared experiences are tied to our overall mental and physical well-being. Few events in modern history have shut down such interactions more thoroughly than the outbreak of COVID-19, which forced millions into prolonged isolation. As lockdowns and social distancing became the norm, an increasing number of people reported heightened feelings of loneliness, anxiety, and depression. Beyond the pandemic, other modern social factors contribute to isolation, including the growing reliance on social media and virtual interactions in place of face-to-face connections. While technology offers new ways to stay in touch, excessive screen time and digital communication can sometimes deepen feelings of loneliness by reducing meaningful, in-person social engagement. In the wake of these societal shifts, researchers are working to understand the long-term consequences of social isolation on both mental and physical health.

Studies suggest that loneliness isn’t just an emotional experience—it has measurable physiological effects on the body. Using advanced biometric signals, researchers are trying to uncover how isolation influences our nervous system, stress responses, and overall wellness. Heart rate variability (HRV) provides insights into autonomic nervous system balance, while electrodermal activity (EDA) reflects changes in stress and emotional arousal. Respiration patterns, electromyography (EMG) readings, and other physiological markers help paint a complete picture of how isolation affects both mind and body. By combining psychological assessments with physiological data, scientists aim to better understand how chronic loneliness can contribute to conditions such as cardiovascular disease, weakened immune function, and mental health disorders.

In one such study published in Britain’s Royal Society Open Science journal in 2024, researchers looked at the effect of social isolation on human adolescents, specifically their ability to learn to perceive threats. Study participants between the ages of 16 and 19 underwent sessions of complete isolation and isolation combined with virtual social interaction, as well as baseline sessions. Following each session, study participants reported their psychological state and completed a threat learning task (participants learned to associate neutral shapes with an aversive sound) to measure physiological response to learned threats and safety cues. During these sessions, researchers recorded participants’ EDA signals using BIOPAC EDA finger transducers connected to an MP36R data acquisition and analysis system running AcqKnowledge software. Results showed heightened EDA levels during threat extinction following isolation compared to the baseline. Researchers reported that their findings suggest that isolation and loneliness among adolescents might increase vulnerability and increase the instances of emotional disorders such as phobias, anxiety, and obsessive-compulsive disorder (OCD).

A team of researchers in Brazil compared how giving and receiving of social touch as well as heart rate variability serve as accurate predictors of loneliness in college-age adults. Participant loneliness levels were measured using the UCLA Loneliness Scale. Participants completed a psychiatric screening questionnaire that reported loneliness, social support, and social touch levels. Participant HRV measurements were taken via electrocardiographic (ECG) signal processing using a BIOPAC ECG amplifier connected to a 16-channel MP data acquisition and analysis system running AcqKnowledge. According to the researchers’ published findings, “social support and social touch, specifically receiving touch, accounted for a significant proportion of the variance in loneliness. However, neither giving touch nor resting HRV was a significant predictor of loneliness.”alone

A study by researchers from the University of Bonn examined the link between loneliness and how males and females process trauma and react to fear-inducing stimuli. Over three days, participants were exposed to experimental trauma and evoked intrusive thoughts. Researchers employed functional magnetic resonance imaging (fMRI) scans to assess neural habituation to fearful faces and fear learning (conditioning and extinction) before trauma exposure. Fear conditioning and extinction tasks used a BIOPAC MP system to deliver stimulus in the form of electric impulses. EDA and respiration data were recorded using the BIOPAC data acquisition and analysis system. Study results revealed “a significant interaction between loneliness and sex such that loneliness is associated with more intrusions in men, but not in women.” The implication is, according to the study’s authors, “that loneliness may confer vulnerability to intrusive memories after trauma exposure in healthy men and that this phenotype relates to altered limbic processing of fear signals.”

As the physiological and psychological effects of the COVID-19 pandemic continue to resonate and we grapple with the isolating influence of technology, increasing numbers of research studies are being launched to measure these impacts. Studies into human isolation and loneliness represent just one small corner of a broad spectrum of research on the topic. For information on how BIOPAC equipment is being used in such research areas, check out our on-demand webinars for additional ideas on how to deploy BIOPAC resources in your next study.


Are you planning a research project investigating the effects of isolation, loneliness, or other related subjects? Reach out to our team of experts to help you get started with the right resources and equipment.


Everybody Hurts: Studying the Physiological and Neurological Components of Pain

A Buddhist saying states, “Pain is inevitable, but suffering is optional.” Pain’s dual nature has presented a conundrum for philosophy and the sciences. As a warning system, it protects us from harm, but it can also be the source of profound psychological and emotional damage. Pain is a complex and deeply subjective experience, yet it is one of the most critical areas of study in neuroscience.

Understanding pain involves not only exploring its physical origins but also decoding the neural circuits and physiological signals that contribute to its perception and regulation. Neuroscientific research into pain aims to answer fundamental questions about how pain is processed in the brain, how it varies from person to person, and how we can develop better treatments for chronic conditions.

This research uses various physiological signals to provide insights into pain mechanisms. Electroencephalography (EEG) captures brainwave activity, revealing how different regions of the brain respond to painful stimuli. Photoplethysmography (PPG) tracks blood flow changes, while electrocardiography (ECG) and skin conductance response (SCR) measure autonomic nervous system activity, offering clues about how the body reacts to stress and discomfort. Respiration patterns, too, are key indicators, as breathing can change in response to pain. Together, these signals help scientists map the body’s response to pain, shedding light on the underlying neural pathways and guiding the development of more effective pain management strategies. Understanding these physiological markers is a critical step toward personalized pain care and improving the quality of life for millions worldwide.

Pain research commonly focuses on the neurological mechanisms of pain to better understand its causes and how it can be treated. Researchers publishing their findings in the Journal of Biomedical and Health Informatics developed a device for studying pain perception biomarkers using thermal stimulation. Their device generates minutely controlled thermal stimuli using a computer-driven Peltier cell while simultaneously capturing EEG and PPG signals. Researchers identified the heat pain threshold (HPT) for each subject, defined as the maximum the subject can withstand when the Peltier cell gradually increases the temperature. The team used two-dimensional spectral entropy (SE) obtained from both the EEG and PPG signals to differentiate the condition of pain. EEG and PPG signals were fed to a BIOPAC MP36 data acquisition and analysis system running Biopac Student Lab (BSL) software. The study concluded that hemodynamics, brain dynamics, and their interactions can be used to discriminate thermal pain perception, which could have practical applications in monitoring pain perception. Possible applications include the study and treatment of “pathologies that affect the peripheral nervous system, such as small fiber neuropathies, fibromyalgia, or painful diabetic neuropathy.”

The pain mechanism associated specifically with fibromyalgia, one of the most common chronic pain disorders, was the focus of a study at the University of Jae´n in Spain. Despite its prevalence, much is still unknown about the underlying cause of this condition. Clinical and experimental studies of individuals diagnosed with fibromyalgia syndrome (FMS) have revealed autonomic nervous system (ANS) deficiencies. While both the parasympathetic and sympathetic components of the ANS have been studied, less is known about the sympathetic component as it relates to FMS. In this study, researchers used SCR as an indirect measure of the sweat response, which is controlled by the sympathetic mechanisms of the ANS. Researchers used a BIOPAC MP36 running AcqKnowledge to collect SCR data via an EDA lead set connected to participants’ fingers. The study found reduced skin conductance levels (SCL) and SCR in FMS patients compared to the non-FMS control group, indicating lower levels of sweating and reduced sympathetic activity in the skin. These factors provided the research team with a better understanding of the sympathetic nervous system’s role in FMS, with the potential for revealing new routes to better pain management and treatment.

For several decades, researchers and clinicians have studied the use of hypnosis to treat chronic pain. More recently, new technologies such as virtualpills reality have been incorporated into these techniques. A team of researchers from the University of Strasbourg in France studied the application of virtual reality hypnosis (VRH) to regulate HPT in healthy adult participants. Researchers used several physiological signals to measure autonomic function during the experiment, including ECG, respiration, SCR, and EEG. ECG signals were recorded using the BIOPAC ECG amplifier, while respiration rate was measured by a thermistor transducer that determined the difference in temperature between inhaled and exhaled air. SCRs were measured from the index and middle fingers of the dominant hand with a BIOPAC skin conductance transducer. Physiological signals were fed into a BIOPAC data acquisition system for analysis. A computer-generated immersive environment was created in VR and combined with a hypnotic auditory script. As with classical hypnosis treatments, the VRH scheme in this study began with an “induction period” followed by a “dissociation” period (separation between the mental state and the environment), followed by suggestions of pain reduction as analgesia. The study results supported a positive correlation between VRH and an increase in the participants’ pain threshold with promising implications for new non-pharmacological approaches to pain management and treatment.
These are just some of the ways that BIOPAC equipment is being used to explore the frontier of pain research and help ease the suffering of millions who deal with chronic pain and its physical and psychological effects. See our webinars page for additional information on how physiological signals can be applied to your next study.


Are you planning a study on pain or any related neurological or physiological area of research? Our team of experts is ready to help you find the tools to ensure success.

Keep Your Eye on the Ball: Eye Tracking in Exercise Research

When a coach tells a player to keep their eye on the ball, they are addressing the importance of attention and focus to success, both figuratively and literally. Whether hitting a baseball, shooting a basket, or maintaining focus in an exercise routine, how we process visual information is linked to physical and mental performance, and eye tracking is the key to unlocking this relationship.

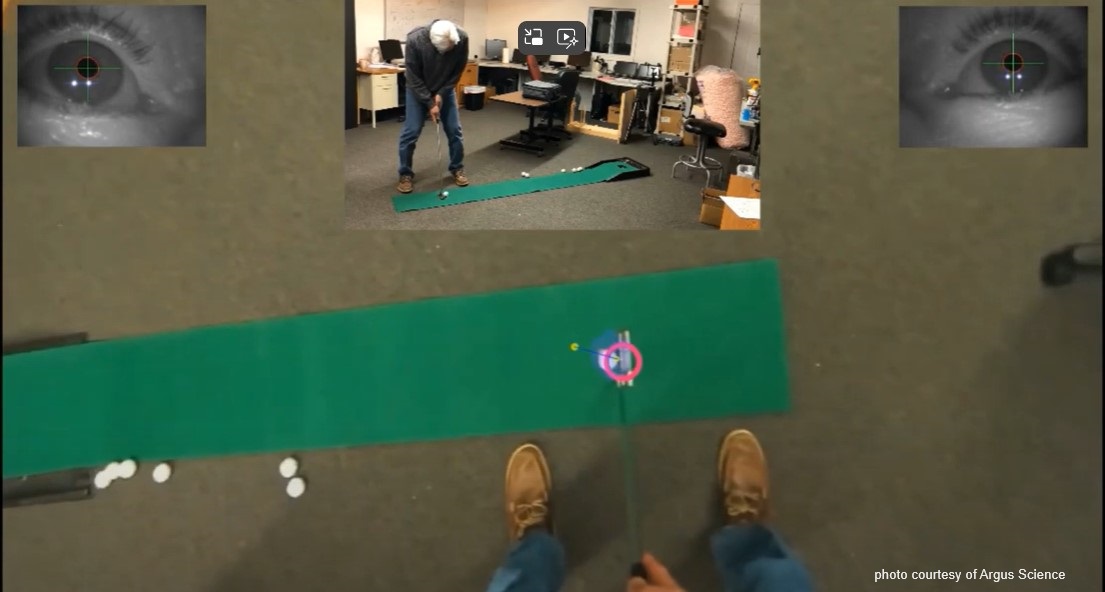
Modern eye tracking technology is revolutionizing how researchers understand human behavior, perception, and performance during physical activity. With the rise of wearable and mobile technology, eye tracking has been freed from the confines of the lab, offering real-world insights into our exercise habits and mindset. Thanks to innovators like BIOPAC partner Argus, researchers can now access eye tracking information recorded directly from the putting green, ski slope, and even the mountain biking trail.

One of the primary applications of eye tracking in exercise research lies in understanding visual attention and gaze behavior. By tracking where individuals look while engaging in physical activity, researchers can better understand how attentional focus influences performance. For instance, studies have revealed that elite athletes exhibit more focused and efficient gaze patterns, directing their attention to critical cues that enhance their performance. A 2023 study by researchers at North Carolina State University assessed the viability of using an array of mobile physiological measurement tools, including eye tracking, to measure performance optimization techniques for rock climbers. Tools included BIOPAC monitors and transmitters for wireless tracking of skeletal muscle electromyography (EMG) and eye tracking glasses to record gaze. The study affirmed that such technologies could accurately monitor multiple athletic performance metrics in even the most challenging environments. basketball

Beyond performance enhancement, eye tracking technology holds promise in understanding the psychological aspects of exercise behavior. By examining visual attention during exercise-related stimuli such as advertisements or motivational cues, researchers can unravel the underlying mechanisms driving exercise motivation and adherence.

The same principles of eye tracking research used in fitness and physical performance-related exercise studies can be applied in other fields, such as those that examine job performance in highly stressful and physically demanding occupations, like law enforcement. A study published in the 2023 edition of the Journal of Motor Behavior explored the relationship between gaze control and decision-making by police officers in highly stressful situations. The goal was to assess how a participant’s levels of experience and training affected tactical decisions. Participants wore eye tracking glasses during a simulated traffic incident. The participants’ respiration and electrocardiogram (ECG) signals were monitored via a BIOPAC BioNomadix dual-signal wireless transmitter.  Gaze-tracking data, ECG, and respiration data were fed into a BIOPAC data acquisition system for analysis. The study found that higher levels of training “led to increased processing efficiency and effective attentional control.”

The integration of eye tracking technology into exercise physiology and psychology research offers a nuanced understanding of human behavior and performance during physical activity. With wearable and mobile solutions, this technology not only expands the possibilities of research but also holds the potential for personalized programs and the enhancement of exercise experiences for individuals across a wide range of circumstances. For more information on integrating mobile eye tracking into your exercise study, see our webinars on Recording Great Data from Exercising Subjects and Eye Tracking Glasses and AcqKnowledge Integration.


Are you planning to employ eye tracking in your next exercise study? Contact our experts for assistance in selecting the best tools for gathering and analyzing exercise data with eye tracking.

Silent Partner: Autonomic Function Testing in Research

Like the inner workings of an intricate machine, most of our bodily functions operate with little or no conscious effort. That task falls to the autonomic nervous system, a sort of control system that regulates a wide range of processes, including digestion, heart rate, respiration, urination, and sexual arousal, to name a few. The autonomic nervous system also controls physiological responses to stimuli—the fight-or-flight response, and critical reflex actions like vomiting, swallowing, coughing, and sneezing.

The ability to effectively and accurately test autonomic function allows clinicians to diagnose and treat a range of ailments. Such tests can non-invasively evaluate the severity and distribution of autonomic failure, for example. Beyond these clinical applications, autonomic function testing provides valuable insight into how the body regulates and manages various critical functions and how the autonomic nervous system affects our physical and psychological health.

adolescent depressionAutonomic function testing has been employed to examine the impact childhood trauma has on cognitive function as it relates to adolescent depression. A 2020 study published in Development and Psychopathology looked at whether economic deprivation and threat influenced cognitive processes and autonomic nervous system function connected to the severity of depression. Researchers measured study participants’ electrodermal activity (EDA), respiratory sinus arrhythmia (RSA), and electrocardiogram (ECG) data via an MP150 system. EDA was gathered using a BioNomadix wireless BN-PPGED amplifier set, while ECG and respiration (RSP) recordings were obtained with a BioNomadix wireless BN-RSPEC amplifier set. The study’s findings supported the assumption that a history of trauma and economic deprivation can lead to risk factors for youth depression.

Continuing with the theme of applying autonomic function testing to measure the effects of trauma, a 2021 study publish in Neurobiology of Stress examines autonomic function related to sex differences among individuals with posttraumatic stress disorder (PTSD). Skin conductance, blood pressure (BP), heart rate (HR), and high-frequency heart rate variability (HF-HRV) were recorded with an MP150 data acquisition system among male and female emergency personnel following trauma exposure. The results, which showed notable sex differences in autonomic functioning among trauma-exposed individuals, have implications for predicting cardiovascular risk in those with PTSD.

These are just a few examples of how autonomic function testing is being used outside of the clinical setting to shed new light on several research areas. Check out Part 1 and Part 2 of our webinars demonstrating how to use BIOPAC equipment and software in autonomic function research.


For additional information on how BIOPAC can assist you with a wide range of research and educational applications, contact your local sales representative.

Guilt Trips: Taking Measure of Our Moral Compass

“So full of artless jealousy is guilt, It spills itself in fearing to be spilt”
—Gertrude, William Shakespeare’s “Hamlet”

In Act 4 of Shakespeare’s famous tragedy, Hamlet’s mother Gertrude points out that the harder one tries to conceal guilt, the easier it is to expose. Little does she realize that she may have hit upon how future researchers approach the study of guilt in the lab. For practical purposes, it is a primary motivator in moral action and impacts how an individual responds to certain stimuli.

Psychologists have developed a myriad of tests to gauge guilt in a clinical setting such as the Test of Self-Conscious Affect (TOSCA), a multiple-choice test that tracks responses to various moral scenarios. While such techniques have been useful in linking guilt with conditions such as depression and anxiety, they have also shown their limitations in providing a deeper understanding of guilt’s influence on behavior, development, and psychological health.

In a recent BIOPAC webinar, UCSB professor Dr. Hongbo Yu addressed these limitations. Scenario-based tasks, he points out, are non-committal in examining the causes of guilt and do a poor job of measuring behavioral tendencies linked to guilt. Interaction-based research methods, however, allow participants to experience emotions in real-time, allow direct control of the causes of guilt in the lab, and allow for direct measurement of responses to stimuli.

As discussed in prior posts on affect, the body’s physiological manifestation of emotion, there is a range of methods and physiological signals available to researchers for measuring affect and gaining a better understanding of emotional states like guilt. Dr. Yu utilized eye-tracking, electrodermal activity (EDA), and functional magnetic resonance imaging (fMRI) in his examples. These are just a few of the signals currently being used in the lab to measure guilt.

One of the practical applications of guilt research is detecting when a subject is concealing the truth, as one would with a polygraph test. A recent study conducted by researchers at the University of Wisconsin-Madison’s Department of Psychology sought to gauge deception among research participants taking the Concealed Information Test (CIT). The goal was to improve upon traditional polygraph test signals such as heart rate and respiratory rate. Respiration data was gathered using a respiration transducer belt while ECG signals were collected with BIOPAC electrodes. In addition, researchers gathered EDA data using a transducer and finger electrodes. The study found that thGuilty Girle EDA signal was significantly more effective in accurately measuring physiological responses during the test procedure.

A 2018 study by researchers at Liverpool Hope University looked at the link between guilt and aggression in children by examining activity in the autonomic nervous system during so-called “bad behavior.” The study measured respiratory sinus arrhythmia (RSA) and skin conductance in children 4–8 years old while they imagined engaging in antisocial activities. EDA and ECG signals were gathered via wireless amplifiers and fed to an MP150 data acquisition unit (superseded by the MP160) running AcqKnowledge software. The study found a linkage between physiological responses to aggression and guilt that may provide a better understanding of the mechanisms behind guilt and related behavior in early and middle childhood.

These are just a few examples of how physiological signals can be applied to measuring guilt in research. BIOPAC offers a wide range of data acquisition, stimulus presentation, and VR options suitable for creating custom guilt research environments in the lab.


For additional information, contact your BIOPAC representative to learn more about the range of signals that can be utilized to gather data on guilt and other emotional states in the lab.

Measuring Moods: Signals for Insight into Emotion

“Do you ever look at someone and wonder what is going on inside their head?”

Joy, an anthropomorphized manifestation of happiness, delivers this line at the opening of Pixar’s 2015 animated hit “Inside Out,” a film that explores the emotional struggles of its young protagonist. She could have been speaking for generations of researchers who have plumbed the depths of the human psyche for a better understanding of the mechanisms behind our feelings, moods, and emotions.

When today’s researchers talk about emotion, they typically do so in terms of affect, the underlying physiological and psychological experience of feelings and emotions as a reaction to stimuli. Affect and emotion are not the same thing, per se, but are fundamentally connected. While the feelings we describe as fear, joy, love, hate, etc. remain abstract, affect is more concrete. BIOPAC co-founder and head of R&D describes it as “the measurable quality or manifestation of emotion in the human body.”

This manifestation can be measured in the human nervous system’s response to stimuli. Depending on the nature of the stimuli and how this sensory data is interpreted by the central nervous system, an array of physiological responses can take place: heart rate changes, the stomach and muscle groups tense, skin temperature responds, triggering sweat glands, among others.

The signals corresponding to these reactions provide researchers with valuable data to help them better understand affect and emotion. These signals—electroencephalogram (EEG), electrodermal activity (EDA), electromyogram (EMG), heart rate, and respiratory rate, to name a few—can be recorded and measured using a range of currently available sensing technologies.

As an example, a 2019 study published through the Queensland University of Technology used respiration signals as a means of classification for human emotions such as happiness, sadness, surprise, disgust, fear, and anger. In the study, breathing signals, including airflow rate and volume, were acquired and recorded using a BIOPAC MP36 data acquisition unit while participants were shown seven film clips, each associated with a different emotion. The study concluded that the respiratory data was 80% effective in accurately classifying affective responses to the film stimuli.

A team of researchers at the Khwaja Fareed University of Engineering and Information Technology in Pakistan took their investigation into the connection between physiological signals and emotion a step further. They used a similar approach by measuring participant response to movie clips, however this time, four types of physiological signals were acquired, including ECG, EMG, respiration, and skin conductivity (SC). The data was acquired with a wide range of signal sensors and analyzed via a BIOPAC MP160 DAQ System.Signals for Emotion

Signal sensing technology also allows researchers to study emotion in multiple participants simultaneously, as was the case in a 2020 dyadic study of how a parent’s stress and emotional suppression affects their children. The study measured physiological responses of both parents and children using ECG and impedance cardiography (ICG) via a BIOPAC MP150 data acquisition unit.

The mysteries of human emotion are being unlocked through a growing understanding of the affective response to stimuli. For more information on how physiological signals can be gathered and analyzed for this purpose, see our app note on emotional state physiology as well as our webinar Emotion and Objective Physiological Measures.


Contact BIOPAC for the latest information on how we can help you measure affect in the lab.

Choosing the Right Signal: Easy as 1, 2, 3

In physiology and life sciences, researchers rely on a wide range of signals to gather data from humans and animals. These signals provide critical insight into how complex organisms function under a myriad of conditions. However, this wealth of potential data sources can also present a challenge for researchers: choosing the right signals on which to focus their data gathering. For those lacking a background in the disciplines and mechanisms behind these signals, sifting through the available methodology can be overwhelming. The best place to begin is by considering one or a combination of the “Big Three” physiological signals: ECG, EDA, and respiration.

In physiology and life sciences, researchers rely on a wide range of signals to gather data from humans and animals. These signals provide critical insight into how complex organisms function under a myriad of conditions. However, this wealth of potential data sources can also present a challenge for researchers: choosing the right signals on which to focus their data gathering. For those lacking a background in the disciplines and mechanisms behind these signals, sifting through the available methodology can be overwhelming. The best place to begin is by considering one or a combination of the “Big Three” physiological signals: ECG, EDA, and respiration.

One from the Heart

Changes in heart rate can provide information on both the physiological and psychological state of a research participant. Electrocardiography (ECG or EKG) is a biopotential measurement that provides direct metrics on electrical voltage changes in the heart. With the help of simple hardware and software, it is possible to record these voltage variations as waveforms to track how the heart responds to stimuli. Additional data can be provided by creating reoccurring reference points in the waveform, measuring the intervals between beats, and calculating heart rate variability to track changes over time or in response to stimuli.

Skin Deep

Electrodermal Activity (EDA) provides one of the best measurements of how the body responds to psychological stress and anxiety. It can be simply understood as a measure of changes in the electrical conductance of the skin in relation to the production of sweat. The physiological process of EDA comprises two components, skin conductance level (SCL) and skin conductance response (SCR). SCL is a tonic level that slowly changes over time, measuring the period for response to a stimulus to occur, from its onset to its peak. SCR reflects the phasic response to an arousing stimulus that is shown in faster changes of the skin conductance level. As an example of the application of EDA and ECG measurements in psycho-physiological research, a recent study applied both signals in measuring the cognitive states of gamers during human-computer interaction (HCI).

Breathe Easy

ArachnophobiaAs with changes in heart rate, variations in breathing cycle reveal how subjects respond to a wide range of stimuli and conditions. The signal produced by the respiratory cycle is a transduced physiological signal. As such we can apply mechanisms to create a voltage potential to measure phases of inhalation and exhalation in this cycle. This data can be represented in waveforms, providing data on respiratory rate, amplitude, and respiratory sinus arrhythmia (RSA). The latter combines respiratory data with ECG signal data to show changes in heart rate in response phases in the respiratory cycle. A 2020 machine learning study for the development of virtual reality applications combined respiration, EDA, and ECG signals to measure participant’s fear response to spiders, an example of how all three signals can be simultaneously utilized in psychophysiology research.

Choosing the right signal shouldn’t be the biggest hurdle to designing your next research project. Applying one or more of these “Big Three” can cover a wide range of data gathering goals.


For additional assistance, consult BIOPACS online resources on Life Science and Physiological Signals or contact your local BIOPAC representative.

Hitting the Mark: Using Event Markers to Improve Data Quality

Life is a series of events—some are planned while others catch us completely by surprise. This holds true in the lab where the quality of experiments and data depend on accurately identifying, tracking, and sorting key events as they occur. Events like the introduction of stimuli and a test subject’s reaction directly impact data.

Life is a series of events—some are planned while others catch us completely by surprise. This holds true in the lab where the quality of experiments and data depend on accurately identifying, tracking, and sorting key events as they occur. Events like the introduction of stimuli and a test participant reaction directly impact data. Similarly, unplanned events, such as when a participant coughs or sneezes during a respiratory experiment, can affect overall data quality.

In this context, we define an “event” as piece of information associated with a specific time in a waveform. An event can capture points of interest within a file (e.g., subject moved, dose added) or on a particular channel (e.g., T-wave onset).

Whether intentional or not, critical events need to be easily located and identified by those running an experiment. Event marking provides the key to this by helping researchers eliminate outlier data while making it possible to locate data that is significant to the experiment. Today’s researchers benefit from data acquisition software that offers some form of event marking functionality to easily identify, label, and categorize such events. BIOPAC’s latest build of AcqKnowledge, for example, integrates extremely easy-to-use event marking tools that enable users to mark “quick events” with a simple tap of a function/hotkey for 17 different event categories, each containing multiple types of events.

“I’m struggling to think of any time you wouldn’t be using these,” said BIOPAC Technical Support Manager David Pollock as part of the recent webinar AcqKnowledge Bootcamp: Set Up Experiments to Facilitate Data Analysis. “They are critical to being able to interpret your data after you acquire it.”

The benefits of event markers include:

  • Allowing researchers to differentiate stages of an experiment
  • Making it easy to eliminate outlier data
  • Allowing researchers to track and identify stimuli
  • Providing control over event tracking, thus eliminating errors
A Tale of Two Studies

A pair of recent studies illustrate how data acquisition software like AcqKnowledge can streamline event marking. The first sought to test the viability of various commercial-off-the-shelf ECG sensors for monitoring stress levels in participants. Test participants used a manual button to self-mark stress events triggered by mental arithmetic tasks, startle response tests, and a cold-water response test. A BIOPAC MP Research System data acquisition unit provided a clinical baseline for comparison with the pair of COTS ECG monitors. The limitations of self-reported events were revealed when participants were found to have accidentally activated the stress “clicker” about 60% of the time.

Physiological Data in Military StudyA similar 2018 John Hopkins University study avoided this problem through both automated and researcher-controlled event marking. When examining how military commanders maintain combat effectiveness while responding to a range of potentially stressful battlefield situations, researchers employed AcqKnowledge to record event marks at the onset and offset of various stimuli. Physiological data was fed to an AcqKnowledge-equipped computer via a BIOPAC DAQ connected to an STP100C digital interface module. Event markers generated by both AcqKnowledge and E-Prime allowed researchers to easily identify stimuli as well as each task the participants performed by name, start time, end time, and duration.

Not leveraging the power of event marking tools can result in key experimental events being lost in a flood of data, potentially corrupting results. Check out this video tutorial to learn more about event marking with AcqKnowledge.

THE BIG 3: Crucial Signals for Interdisciplinary Psychophysiology Research

This guest post was written by Michael Hogan, BIOPAC’s Southeast Regional Representative. Contact him at michaelh@biopac.com

Even trained psychologists can be daunted by the interdisciplinary applications involved with recording objective physiological data. However, it is not necessary to learn the intricacies of bio-medical engineering, physics, statistics and underlying physiological mechanisms of the body just to incorporate these objective measures into your research. With just a few key signals of interest, and a simple hardware and software setup, a trained researcher can record and interpret the objective physiological responses of participants in a physiology study.

How to get started? Begin with a protocol you are already studying and incorporate “THE BIG 3”

  1. ECG: Electrocardiography is a biopotential, meaning direct measurement of the electrical voltage potential changes of the heart as it completes its “cardiac cycle.” Since we can record these voltage changes and graphically repECG Signals in AcqKnowledgeresent them as a waveform through analog to digital conversion, we are able to identify changes in the behavior of the heart in response to the presented stimulus. We can then establish a recurring reference point in the “R-Peak” of the QRS complex, we are able to measure the distance between these R-Peaks and establish an R-to-R interval, this measure tells us the time in-between cycles or “beats” of the heart. From one beat to the next, we can establish the participant’s heart rate. Once we have established a heart rate, we are able to extract valuable measures, such as Heart Rate Variability: how the heart rate changes over an observed set of time intervals or in response to the correlated stimulus.
  1. Respiration: The respiration cycle is what is known as a transduced physiological signal. This means we utilize a mechanical apparatus to create a voltage potential in response to the inhalation and exhalation phases of the respiratory cycle. These voltage changes can then be measured and graphically represented as a waveform for further analysis. The respiratory cycle waveform can tell us the following:
    • Respiratory rate: the number of cycles that occur within a given time interval or changes in response to a stimulus.
    • Amplitude: What is the change in magnitude of the cycle, shallow vs. deep breathing.
    • Respiratory Sinus Arrythmia (RSA): When collected along with an ECG signal, this analysis accounts for the changes in the participant’s heart rate as a response to the inhalation and exhalation phases of the respiratory cycle. For example, the heart rate elevates when the participant inhales and decreases when the participant exhales.
  1. EDA: Electrodermal Activity has been adopted as the newest nomenclature for Galvanic Skin Response “GSR.” To this day EDA is touted as the best measure of sympathetic nervous system “activation.” As a derivative physiological measure, we pass a small, imperceptible current (0.5 V) into the participant’s body and measure the change from this known value as the participant responds.

As the autonomic nervous system responds to stimuli, it stimulates the eccrine glands to produce sweat. The sweat produced lowers the impedance to the current passing into the participant. We can then measure the change and extract meaningful data regarding how the participant responded to the chosen stimulus.

  • Skin Conductance Response (SCR): The magnitude of the response that occurred as a result of the stimulus from its onset to its peak.
  • Skin Conductance Level (SCL): How long it took for the response to occur following the chosen stimulus from its onset to its peak.
  • Recovery time: How long it takes the response to diminish and return to “baseline/normal” values.

With these “BIG 3” physiological measures we can perform hundreds of research protocols and objectively correlate patterns of behavior. Once these measures have been employed, we can integrate other measures for more comprehensive studies, such as:

  • EEG and fNIR for cognitive processing and learning metrics
  • Non Invasive Blood Pressure (NIBP) for stress and cardiovascular metrics
  • Facial EMG, fEMG, or Facial Coding Software for affective emotional states metrics

Visit us at www.biopac.com or click the following links for information on:

Signal-Specific Webinars
Detailed Application Notes
Signal Specific Analysis Video Tutorials
Physiological Recording Knowledge Base
Signal guides for ECG and EDA


BIOPAC Systems, Inc. provides life science researchers and educators with data acquisition and analysis systems that inspire people and enable greater discovery about life.

error: Content is protected !!