Hands-on Learning: How Real‑Time Physiological Data Deepens Clinical Education

Physicist Albert Einstein noted, “The only source of knowledge is experience.” This principle is particularly relevant in healthcare education, where hands-on learning is vital for cultivating the skills needed to care for patients effectively. The practice of recording and analyzing physiological signals in the learning lab serves as a powerful teaching tool, enabling students to immerse themselves in real-world scenarios and reveal autonomic responses, cardiovascular patterns, and emotional states that are often hidden from view.

For students in nursing, dentistry, and pharmacology, engaging with these signals transforms abstract concepts into concrete, measurable experiences. By analyzing heart activity, visual attention, stress markers, and pharmacodynamic effects, students not only enhance their critical thinking skills but also prepare themselves for clinical challenges with greater confidence.

Physiological signals across the health sciences teach learners to interpret subtle features embedded in physiological waveforms. Modern teaching laboratories increasingly incorporate multimodal systems to help students better understand the complexity of human physiology.

Nursing programs emphasize accurate patient monitoring and interpretation of vital signs, including electrocardiograms (ECG) and heartrate variability (HRV). A 2025 study published in Sensors evaluated the validity of Apple Watch Series 6 HRV data against laboratory‑grade ECG recordings using a BIOPAC 3‑lead ECG system to provide a comparative baseline for measurement. By synchronizing event markers between the Apple Watch and BIOPAC timeline, researchers ensured precise temporal alignment for comparing R‑R intervals and HRV indices. The results showed near-perfect agreement in R-R interval timing under resting conditions, indicating that such wearable devices can serve as a reasonable tool for certain wellness-oriented assessments. At the same time, the BIOPAC system remains the gold standard for precise physiological analysis.

For nursing students, this study demonstrated that consumer wearables must be validated against clinical-grade systems before being relied upon for assessment or decision-making. By examining the comparative data, students can explore how artifacts, sampling frequencies, and sensor placement influence the fidelity of HRV measurements. Moreover, because HRV relates directly to autonomic balance and stress physiology, the study provides a meaningful touchpoint for nursing courses in pathophysiology and patient assessment. Through hands‑on lab sessions using BIOPAC ECG amplifiers, students can visualize waveform morphology, measure beat‑to‑beat variability, and learn how cardiovascular signals reflect underlying homeostatic regulation.

Dental students should understand not only the mechanics of clinical procedures but also the emotional and perceptual experiences of their patients, especially children. A 2025 cross-sectional pilot study in the European Archives of Paediatric Dentistry used an eye tracking and  data acquisition and analysis system from BIOPAC to measure children’s gaze behavior and physiological stress when viewing images of dentists, dental chairs, and operatory designs.

Using eye-tracking metrics such as mean dwell time, fixation count, time to first fixation, and total fixation time, researchers found that study participants stared longer at dentists wearing white coats, indicating a perception of compitance and safety, but also indimidation. In addition, gender matching mattered, as children showed longer fixation on dentists of the same gender. The study also found that warm‑colored dental chairs (especially yellow) attracted greater visual attention, particularly among younger children. Simultaneously, HRV and ECG signals recorded with the BIOPAC system revealed that younger children exhibited greater autonomic arousal than older peers when exposed to dental images.

These findings offer dental students actionable insights into clinic design, caregiver attire, and emotional perception, all of which influence pediatric patient comfort. The study demonstrates how combining eye tracking with physiological monitoring can reveal otherwise hidden psychological responses. For dental educators, integrating such physiological signal analysis into coursework helps students develop empathetic, patient‑centered care strategies.

colored pillsIn pharmacology courses, students learn how drugs influence physiological systems. A study published in Brain Sciences investigated the lingering cardiovascular effects of caffeine, challenging the assumption that its effects dissipate within six hours. Using BIOPAC respiratory transducers, noninvasive blood pressure modules, bioimpedance amplifiers, and ECG amplifiers connected to a data acquisition and analysis system researchers monitored participants before and after consumption of caffeinated and decaffeinated coffee. Results showed measurable changes in heart rate, respiratory patterns, and thoracic impedance well beyond the expected metabolic window, suggesting caffeine’s physiological effects outlast its pharmacokinetic half‑life.

For pharmacy students, these findings reinforce critical distinctions between pharmacokinetics (drug metabolism) and pharmacodynamics (physiological response). By analyzing real‑world signal data, learners gain a more nuanced understanding of how stimulants affect autonomic regulation. Such insights prepare future pharmacists to counsel patients on medication timing, drug interactions, and individual responses to common agents such as caffeine.

Across nursing, dentistry, and pharmacy, physiological signals provide potent educational value. They bridge the gap between theory and clinical application by giving students concrete, measurable access to physiological processes such as autonomic reactivity, cardiovascular regulation, and perceptual attention. Using both research and education-based lab systems, learners can visualize real-time physiological data, develop analytical skills, and cultivate a deeper understanding of the human body under stress, stimulation, and clinical observation.

As healthcare grows more data‑driven, integrating hands-on experience with signal acquisition into professional training helps future clinicians interpret complex physiological information with confidence. Whether validating wearable devices, improving pediatric patient experiences, or exploring drug‑induced autonomic effects, physiological signals empower students to connect scientific principles with evidence‑based, care. Check out our webinar, Advancing Practical Learning: Biosignal Essentials, to learn more.


If you’re exploring ways to incorporate physiological signals into your curriculum or simulation lab, our team is ready to help identify the best tools and workflows for your program.


Stressing over the effects of stress

Several studies show chronic stress is typically detrimental to health, while acute stress may be linked to positive effects in addition to the negative counterparts

With April comes National Stress Awareness Month, and it bears noting that different types of stress have varying effects. Where chronic stress is typically detrimental to health, acute stress may be linked to positive effects in addition to the negative counterparts. But is this trade-off worth it?

In a biological psychology experiment testing the effect of oxytocin on acute social stress, researchers found different results between men and women. Subjects underwent several stress tasks while their electrocardiography and impedance cardiography were recorded with a BIOPAC MP Research System and amplifiers. The researchers found that after being given oxytocin during the stressful event, men had less negative affect and women had greater math performance (compared to the control group).

A neurobiology study examined the effect stress had on an extinction memory process when a competing association was paired with a previously aversive cue. To test this, participants were presented with two images, one that was paired with a shock from a BIOPAC bar electrode, and one that was not. Extinction memory training immediately followed this stimulus, with extinction retrieval testing following a day later. Data gathered by a BIOPAC data acquisition system suggested significantly lower retrieval in the group that experienced the acute stress stimulus.

Another biopsychology experiment measured the effect of acute stress on pro-inflammatory cytokine levels in the blood. BIOPAC equipment was used to measure ECG while participants were given the Trier Social Stress Test. After reviewing the data and blood samples, the researchers determined that levels of the cytokine cell, interleukin-1β, increased significantly immediately after the stress test.

The physiological and psychological impacts of stress are clearly multifaceted with many potential results. In some situations, a heightened positive affect or greater analytical thinking may be beneficial. But is this boost in mental performance worth the increase of inflammatory cells and lower memory retention? As with many aspects of life, moderation is the safest answer, ensuring the negative effects do not become chronic problems.

For more information on BIOPAC’s wide range of tools for recording, displaying, and analyzing ECG measurements from human and animal subjects including respiration, heart rate variability, and RSA, visit BIOPAC’s electrocardiography pages and view BIOPAC’s full line of electrodes, amplifiers, and wearable, wireless transmitters and loggers.

BIOPAC Systems, Inc. provides life science researchers and educators with data acquisition and analysis systems that inspire people and enable greater discovery about life. Visit us at www.biopac.com.

Holiday Happiness: Gratitude or Gifts?

Studies investigated the anxiety of gift-giving, the effects of social support in stressful situations, and what impact meditation has on heart rate, ECG, and blood pressure.

December has arrived, and for many the holidays bring a rush to check items off of a long shopping list for parents, siblings, friends, in-laws, and many more. Often we struggle to find that “perfect” gift, but are the physical goods we exchange the true source of the warmth and happiness that characterizes the season?

An article by Nomura investigated anxiety induced by gift-giving. To test this, EDA data was recorded with a BIOPAC data acquisition system and STP100 while participants responded to stimuli. The participants visualized a specific relative while being presented with potential gift options, and were asked how likely they were to purchase the potential gift for that relative. The data found that people who self-reported thinking of in-laws were the most stressed, while those who reported thinking of children or same-gender friends were least stressed.

A psychosomatic study by Inagaki and Eisenberger found that mental and physical well-being benefit from forms of social support. They tested this by administering mild shocks with the BIOPAC STMISOLA to male patients who held the hand of a female partner lying in an fMRI. The results suggest that this support (hand-holding) provided possible stress-reduction for both the male and female participants.

Another article on nonverbal communication and well being by Shaltout, et al. tested the effects of meditation and the subsequent ECG, blood pressure, and heart rate effects. The BIOPAC ambulatory BioHarness and NIBP Blood Pressure System gathered data while participants underwent several mediation episodes, during which they were instructed to focus on loving kindness towards a subject. The results found that participants had decreased heart rate.

Research suggests direct, loving interactions with those who are close to us have many stress-reducing benefits. So when you are shopping for gifts, remember that spending time is more important than spending money. To read more studies about love and stress reduction, visit the BIOPAC publication page.

BIOPAC offers a variety of equipment that can be used in studies similar to the ones presented. To find more information on solutions for recording and analyzing signals such as EEG, EMG, respiration, and EDA using the MP160/MP150, MP36, and other platforms, you can visit the individual application pages on the BIOPAC website. 

BIOPAC Systems, Inc. provides life science researchers and educators with data acquisition and analysis systems that inspire people and enable greater discovery about life. Visit us at www.biopac.com.

Electrodes for Physiological Recording

By Alan Macy, BIOPAC Systems, Inc.

In the context of human physiological recording, an electrode is a conductive probe which is used to sense the presence of biopotentials arising at points in the body. When biopotentials are generated in the body, they can be sensed using a differential voltage amplifier. When a biopotential source activates, electrons are moved within the volume of the source thus creating a voltage potential difference (positive to negative) across the volume of the source. Biopotential sources are continually changing in the body, so the associated differential voltage potentials change too.

Electrodes establish an equipotential area when attached to a location on or in the body. An equipotential area means that anywhere on the surface area of the electrode the potential (voltage) will be the same. This is because electrodes are substantially more conductive than the surrounding tissue. To record a biopotential signal, two electrodes are required. The pair of electrodes will measure the voltage which is impressed between the two equipotential areas created by the electrodes.

Biopotential recording electrodes are of two types, namely invasive and noninvasive. Invasive electrodes are designed to sense biopotentials inside the body, meaning they are inserted inside the body, past the skin boundary. Historically, invasive electrodes have been designed as needles or wires to better penetrate the skin. By controlling the conductive and insulating areas of the needle or wire, the electrode can be used to sense biopotentials originating at any depth in the body volume. If the invasive electrode is to be inserted into the body for a long time, then the electrode might take a different shape, such as a conductive disk which can be sutured into place.

Noninvasive electrodes are designed to sense biopotentials which manifest on the outside skin surface. These kinds of electrodes do not penetrate the skin surface layer. Because the body is a volume conductor, biopotentials originating anywhere in the body travel to the entire skin surface area. As an example, a polarized biopotential wave is generated by the heart during the course of each beat. This signal is easily detectable between any two locations on the body’s skin surface that are physically oriented to different sides of the heart.

In practice, it’s best to collect biopotential data as near to the biopotential generating site as possible for the best recording. This is because the body generates a large number of biopotential signals, sourced from a variety of excitable cells. Because the body is conductive, a myriad of these signals will superimpose at any body recording location. As the distance grows between a particular source and the differential recording location, the source signal attenuates. Sources, that are subject to a range of attenuation, will simply add to the desired signal being measured, as they are included in the volume conduction path defined by the differential biopotential recording.

When collecting biopotential data from surface electrodes, the contact area of the electrode has an impact on the frequency and amplitude components recorded in the biopotential. Because the body volume is relatively conductive, increased electrode surface area has a tendency to reduce biopotential amplitudes and suppress higher frequency components. This happens because multiple, and often uncorrelated, biopotential sources in the body can act in random opposition as the various biopotentials superimpose in the conductive body volume and then express on the skin surface. A biopotential averaging process takes place in the body tissue volume and an aspect of the averaged signal is reflected on the skin surface area. This biopotential signal averaging quality increases in scope as the size the measurement surface electrodes increases.

If a biopotential electrode is reduced in size and then inserted into the body near the location of interest, then measured signals will typically increase in amplitude and frequency components. These kinds of electrodes are called needle or wire electrodes and typically have an insulating needle shaft with a conductive tip. Despite certain benefits of needle electrodes, complications can arise when breaking the skin barrier and inserting foreign objects into a subject’s body. Needle electrodes can be difficult to use because they have smaller surface area than surface electrodes. Furthermore, smaller contact surface area always means that the electrode contact impedance is higher. Very high contact impedance, typically in excess of 1 Mohm, specifies the need for excellent lead shielding and specialized input amplifier characteristics.

Biopotential measurements from surface electrodes on the body have material harmonic content of less than 500 Hz. Nearly all of the signal power which can be collected from surface electrodes is between DC and 500 Hz. If the electrode is smaller, such as a conductive-tipped needle, and inserted through the skin surface to near the biopotential of interest, biopotential signal frequencies can exceed 10,000 Hz.

For more information on BIOPAC’s wide range of tools for recording, displaying, and analyzing biopotential measurements from human and animal subjects, visit BIOPAC’s electrocardiograpy, electromyography,  or electroencephalograpy pages and view BIOPAC’s full line of electrodes, amplifiers, and wearable, wireless transmitters and loggers.

BIOPAC Systems, Inc. provides life science researchers and educators with data acquisition and analysis systems that inspire people and enable greater discovery about life.  Visit us at www.biopac.com.

Practical Tips for Recording Physiological Data in MRI

The MRI system incorporates a VERY strong magnetic field and both emits and records radio frequency (RF) energy. This has impacts on subject and experimenter safety and on data accuracy.

By Alan Macy, BIOPAC Systems, Inc.

When recording physiological signals from subjects in MRI systems, two issues are very important:

  1. The MRI system incorporates a VERY strong magnetic field. It is extremely important that no significant magnetically susceptible objects are taken into the room that houses the MRI System.  All materials have some degree of magnetic susceptibility. However, materials with mass magnetic susceptibility values, similar to or have magnitude less than that of water (-0.91E-8 m^3/kg), are typically permitted to be used in the vicinity of MRI Systems. No electrodes, electrode leads, transducers or cabling, that contain significant magnetically susceptible components, should be used when recording data from a subject in the MRI.
  2. The MRI System both emits and records radio frequency (RF) energy. This energy is typically in the range of 5 to 500 MHz. For a 3T MRI, the characteristic proton precession frequency will be 3T * 42.7 MHz or 128.1 MHz.  MRI generated RF energy will, at least, partially reflect from encountered conductors and induce current flow in those conductors. Signal reflections and induced currents can disrupt sensitive imaging operations by creating signal artifacts. Also, RF induced currents, if not properly controlled, can cause local heating.

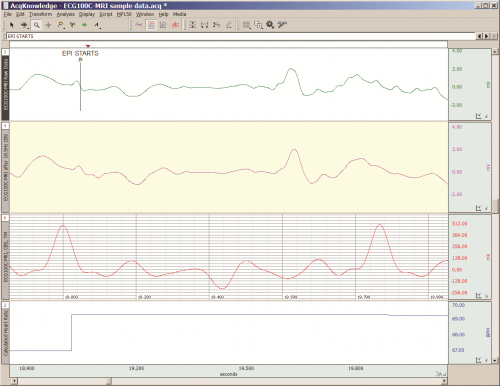
Care must be taken to limit the flow of RF energy both in and out of the room that houses the MRI. RF energy from the MRI superimposes with the very small biopotentials and transducer signals in the vicinity of the subject. Alternatively, RF energy from recording or other equipment in the MRI Control Room (e.g. digital clocks and power supply switching noise) can leak into the MRI chamber, via subject cabling, and cause degradation of the image created by the MRI. It can be complicated to record biopotentials, from a subject’s body, during an MRI scan. These signals are very tiny and the RF energy, and associated magnetic field shifting, generated by the MRI corrupts the recording. Accordingly, successful biopotential recording in the MRI involves the use of specialized amplifiers, optimized cabling, patch-panel filtering, advanced signal processing and/or synchronization with MRI scanning processes to perform clean measurements.

When RF energy is pulsed into the subject, this energy spreads throughout the subject because the subject is a volume conductor. As the MRI magnetic gradient shifts in synchrony with RF energy pulsing, the gradient shift induces a current flow in conductors that intersect with the field. From a practical standpoint, RF energy pulsing and gradient-induced current flows often manifest themselves as repetitive artifact signals directly in the band of the physiological generated biopotentials. This is because RF energy pulsing and magnetic field gradient switching are performed synchronously for imaging and the repetition rates for image slice generation usually fall within the range of 1-100 Hz. Depending upon the biopotential frequency range (from lowest to highest: EGG, EOG, ECG, EEG and EMG), different amplification and signal processing techniques can be used to isolate the signal of interest. Furthermore, it’s often helpful to control imaging processes so that the MRI artifact signal spectrum does not unduly impact the measured physiological signal spectrum.

For more information on BIOPAC’s MR Safe and MR Conditional solutions, visit BIOPAC’s MRI page or view BIOPAC’s full line of electrodes, amplifiers, and wearable, wireless transmitters and loggers.

Download a related and important application note that describes the relationship between MRI imaging sequences and associated physiological measurements, when subjects are monitored in the MRI. In particular, this note addresses newfound insights on the impact that imaging sequence types have upon simultaneously recorded electrocardiography (ECG) and impedance cardiography (ICG) subject measurements.

BIOPAC Systems, Inc. provides life science researchers and educators with data acquisition and analysis systems that inspire people and enable greater discovery about life.  Visit us at www.biopac.com.

Electrocardiogram Waveshape – Pt 1

When recording ECG, it’s important to consider the impacts of electrode placement and amplifier filters on the measured biopotential. Electrode placement is important because different orientations of biopotential surface electrodes with respect to the heart’s position will result in different signal shapes.

By Alan Macy, BIOPAC Systems, Inc.

When recording ECG, it’s important to consider the impacts of electrode placement and amplifier filters on the measured biopotential. Electrode placement is important because different orientations of biopotential surface electrodes with respect to the heart’s position will result in different signal shapes. As the heart contracts and expands, during the course of pumping blood, a time-varying, voltage signal is propagated over the volume of the heart. This voltage signal conducts to the surface of the body and is detectable between any two points on the body that straddle the heart. The signal can look quite different depending on whether the signal is collected from left hand to right hand or from right hand to left leg. When the ECG signal is recorded far from the heart, electrode placement is not critical to obtain similar-looking ECG waveforms when recording over time. As electrodes are placed increasingly close to the heart, then electrode placement becomes quite specific to recreate similar-looking ECG signals. This is because the body is a volume conductor and the heart is not a point-source of electrical signal activity.

The ECG waveform has been specified to consist of frequency components in the range of 0.05 Hz to 150 Hz, even though the characteristic ECG waveform shape is largely composed of components from 0.05 Hz to 35 Hz. However, even if the ECG’s primary waveshape is preserved, bandwidth limits affect usability of the data. For a high-resolution ECG recording, the signal bandwidth should be maximized. Although the Association for the Advancement of Medical Instrumentation (AAMI) standard recommends an ECG bandwidth of 0.05-150 Hz, surface electrodes measurements can show ECG components up to 500 Hz. [1]

As with any physiological measurement from a subject, the balance lies in attempting to isolate the signal of interest from residual noise sources. In the case of ECG recording, interfering noise is often generated by skeletal muscle that lies in the superposition path defined by electrode placement. This noise (recorded as the electromyogram) can be especially problematic if the subject is intentionally moving during the ECG measurement. Other noise sources include interference resulting from mains-generated displacement currents (50/60 Hz hum).

Depending on the nature of the ECG measurement requirements, filtering methodology can be a helpful ally to reduce the effects of interfering noise sources.  The critical aspects of filtering are a function of the filter’s magnitude and phase characteristics.  Choice of filter topologies can have a significant effect on the shape of the ECG.  Given that AAMI guidelines are primarily concerned with ECG filter flatness from 0.05-150 Hz, typically, second-order (or higher) Butterworth filters are used to define these limits.

The discussion of ECG waveshape is continued in Electrocardiogram Waveshape Pt. II.

[1] http://circ.ahajournals.org/content/115/10/1306.full

For more information on BIOPAC’s ECG solutions, visit BIOPAC’s ECG-Cardiology page or view BIOPAC’s full line of electrodes, amplifiers, and wearable, wireless transmitters and loggers.

For more information on BIOPAC Systems, visit us at www.biopac.com.

error: Content is protected !!