Speak Up: Physiological Signals for Speech Research

In the symphony of human communication, speech is the principal instrument. Behind every uttered word lies a complex interplay of physiological and psychological signals, each telling a unique story about the speaker’s state of mind and physical well-being. The critical data provided by these signals has become a pivotal focus in both speech research and therapy, offering useful insights into the mechanisms of verbal communication and its disorders while enhancing speech ability and overall health.

Electromyography (EMG), a technique used to measure muscle activity, plays an invaluable role in speech research by revealing the interaction of facial muscles involved in articulation. By monitoring EMG signals from muscles such as the lips, tongue, and jaw, researchers can elucidate the precise movements and coordination required for speech production, shedding light on the underlying mechanisms of speech disorders like dysarthria or apraxia.

A French study published in the 2024 edition of Science Reports used EMG to establish the role tongue reflex plays in speech posture control. The presence of a tongue reflex in maintaining tongue posture, the proper positioning of the tongue in the mouth, has been a matter of debate among speech researchers. The study team employed an unorthodox recording technique that involved attaching EMG electrodes to the base of the tongue “to record activation of the anterior genioglossus, which is responsible for the control of the anterior part of the tongue.” A robotic arm was used to rapidly stretch the tongue while researchers measured muscular reflex EMG data during the formation of various vowel sounds, which were fed to a BIOPAC EMG amplifier for signal amplification and filtering. According to the research team, the study results “represent the first physiological demonstration in humans that the tongue is driven by reflex in response to a sudden stretch.”

Electrocardiography (ECG), which measures the electrical activity of the heart, offers insights into the intricate relationship between emotion and speech. Research has shown that changes in heart rate variability (HRV) correlate with emotional arousal and cognitive load during speech tasks. By integrating ECG data with speech analysis, researchers can explore the complex connection between emotional states and linguistic expression, paving the way for emotion-aware speech synthesis systems or interventions for social communication disorders.microphone

A 2023 study by researchers at Vanderbilt University used ECG to examine the relationship between respiratory sinus arrhythmia (RSA) on the persistence of stuttering and, specifically, the role emotional regulation plays in stuttering. Researchers measured potential differences in RSA in preschool-age children with persistent stuttering, children who recovered from stuttering, and children who do not stutter. RSA, an index of parasympathetic nervous system activity, was measured during the viewing of both neutral (baseline) and emotionally stimulating video clips and during subsequent speaking tasks. To obtain RSA for each study participant, ECG data was gathered via a BIOPAC data collection and analysis system running AcqKnowledge. A low RSA baseline is often associated with difficulty regulating emotion and, according to the study’s main hypothesis, plays a role in speech disorders like stuttering. The study’s findings supported this hypothesis, with some caveats, but the overall result demonstrated that emotional regulation could provide a promising avenue for speech therapy.

Electroencephalography (EEG), a noninvasive method for recording brain activity, offers insight into neural underpinnings of speech processing and comprehension. By analyzing EEG signals, researchers can map the spatiotemporal dynamics of neural networks involved in language processing, from phonological encoding to semantic integration. EEG-based studies offer insights into the neural signatures of speech disorders like aphasia or developmental language disorders, informing targeted therapeutic interventions and neurorehabilitation strategies. EEG has presented challenges with regard to artifacts created by participant movement during speech, but recent studies have shown promise in EEG as a speech research tool.

This is just an introduction to the signals that are being used to provide researchers with a better understanding of speech and speech pathology. For additional information on how BIOPAC products are being integrated into the study of speech, see our application note on Speech Motor Control.


Are you planning a research project focusing on speech? Our regional sales representatives are ready to help you find the right tools for your study.
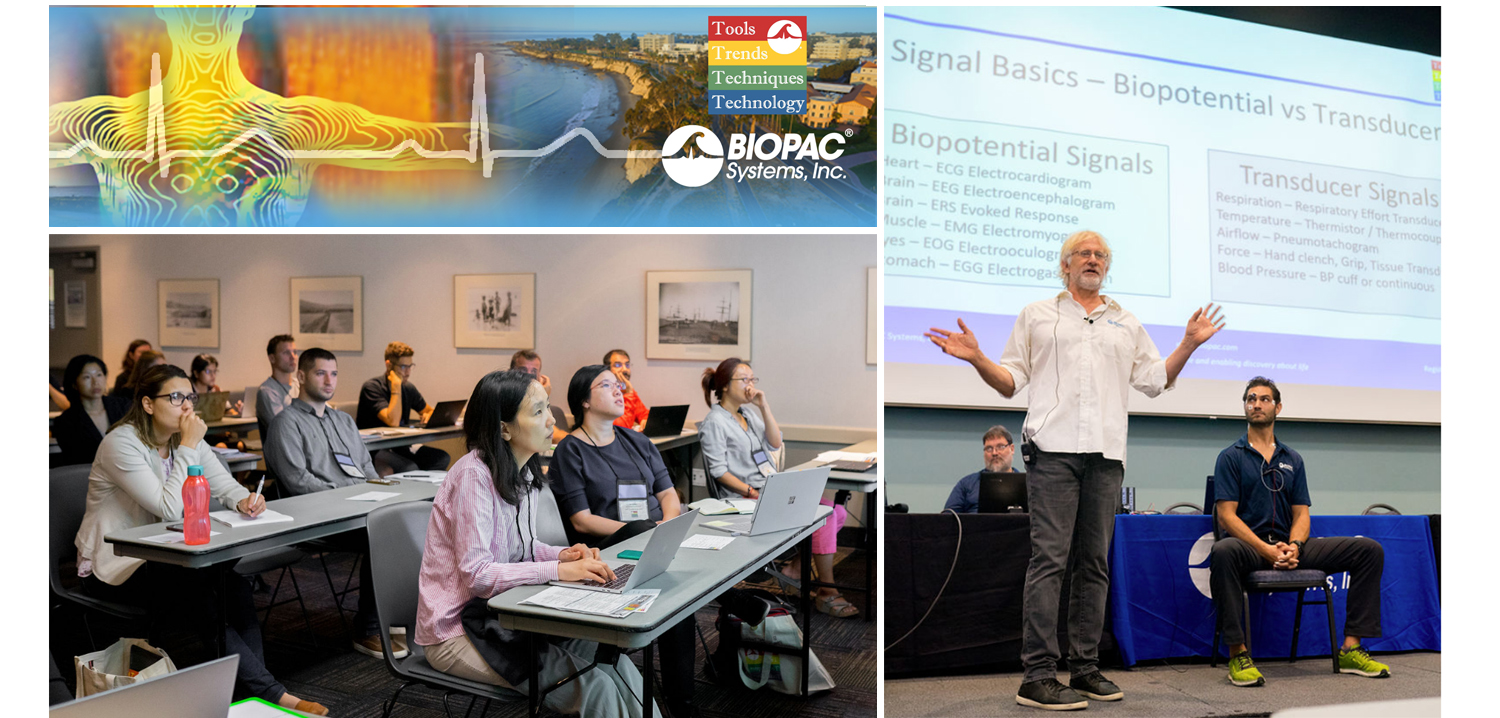
4T|Phys 2023: BIOPAC Shares Tools, Trends, Techniques & Technology at UCSB

They hailed from across the globe, from Arkansas to Zanzibar and all points between. Students, teachers, researchers, and innovators gathered on the campus of UC Santa Barbara, overlooking the Pacific Ocean. They came to learn, share, and explore breakthroughs and best practices in physiology and related fields. 4T|Phys kicked off July 17 under clear California summer skies, an idyllic setting for discovering the Tools, Trends, Techniques, and Technology driving physiology education and exploration.

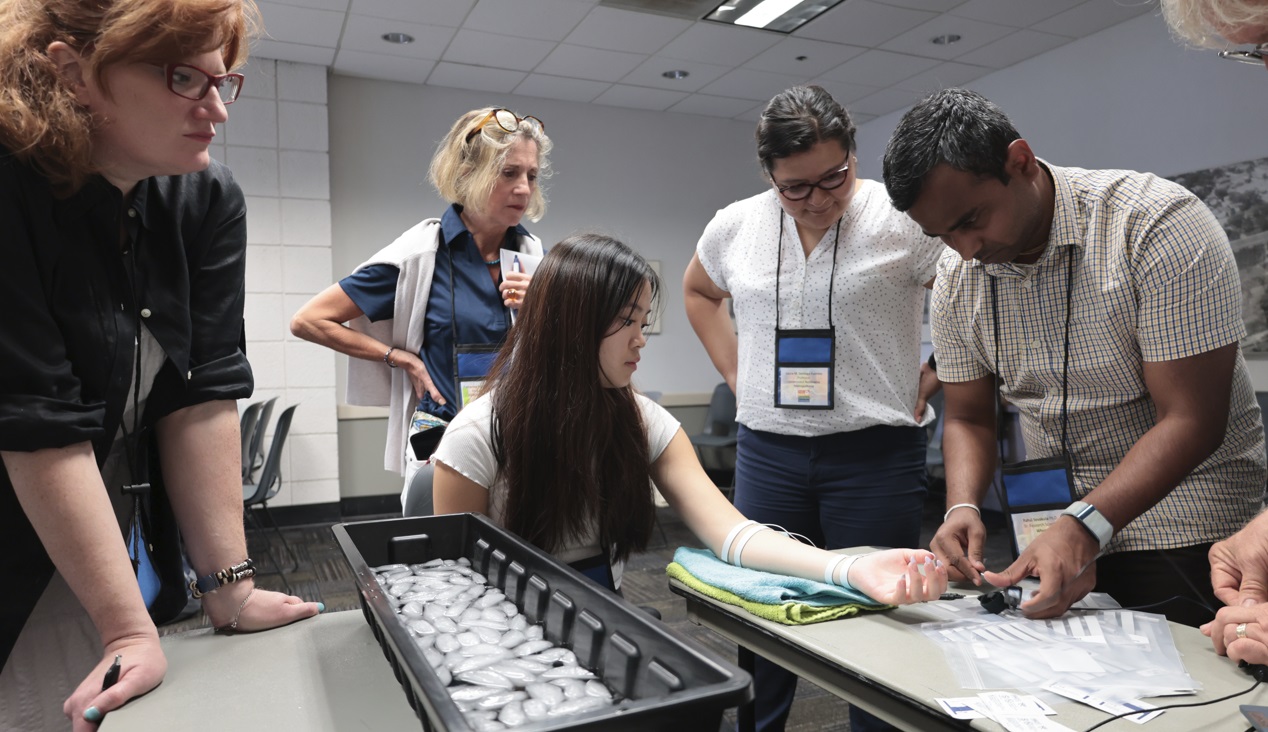
4T|Phys 2023 was the third installment in BIOPAC’s highly successful series of biennial industry conferences that began in 2017. After a two-year hiatus during the global Covid-19 pandemic, 4T came roaring back this summer with more workshops, more tracks, more sponsors, more presenters, and more countries represented than ever before. Over the course of three days, nearly 100 attendees participated in hands-on sessions with some of the top minds in physiology research, experiencing the latest tools for gathering and analyzing data.

BIOPAC’s in-house experts were joined by an array of authorities from the fields of physiology, psychology, imaging (fNIRS and fMRI), neuroscience, cardiovascular research, eye tracking, virtual reality (VR), biology, and engineering. Participants took part in workshop schedules drawn from five separate tracks that included fundamentals, which focused on the basics of data acquisition and analysis. The research track took attendees on a deeper dive into techniques and technologies, including recording evoked potentials, screen-based eye tracking, impedance cardiography using trans-radial bioimpedance velocimetry (TREV), stimulus presentation, exercise physiology, and many others. Participants were also able to tour UC Santa Barbara’s state-of-the-art Brain Imaging Lab to see up close how BIOPAC products are being used in both functional MRI (fMRI) and TREV studies.

“It was an incredible experience that left a lasting impact on me by helping me to understand more about physiological data collection and analysis,” said Dr. Parth Trivedi, a 4T|Phys attendee. “The choice of presenters and the topics covered were truly inspiring, offering valuable knowledge and fresh perspectives that enriched my understanding.”

4T|Phys 2023 Attendee MapThis year’s conference featured several new tracks such as a dedicated VR track led by partner company WorldViz. The WorldViz team showcased virtual reality solutions in a series of workshops that introduced how VR is being integrated in physiology and psychology research, explained how to create effective and immersive VR experiments, and demonstrated their latest PRISM technology for creating fully immersive projected 3D virtual environments.

Several other partner companies introduced their technologies and products both in the 4T exhibition hall and in workshop sessions. Argus Science presented their ETVision eye-tracking glasses that synch seamlessly with AcqKnowledge. Cognixion demonstrated the Cognixion One Axon-R—Research Edition wearable BCI-AR computing platform, which is being used to help individuals with neurodegenerative conditions and severe motor impairments communicate and interact with their environments assisted by augmented reality. Seenel Imaging showed off their MedelOpt Systems for whole-head EEG with fNIRS, including new VR integration. Participants also got a chance to try on the Research Ring by Senstream, a new user-friendly wearable research ring, which allows easy recording of EDA, PPG, Temperature, and ECG signals. CNSystems showed off the company’s NIBP continuous noninvasive blood pressure (NIBP) and hemodynamics devices.

If you missed the educational and networking opportunities at 4T|Phys 2023, don’t despair. We will be back again in a few years, bigger and better than ever. Watch this space for updates on our next installment. In the meantime, see our Video Tutorials and Webinars On Demand for trainings and seminars on our products and partners.


Make sure you never miss a BIOPAC event and keep up with the latest Tools, Trends, Techniques, and Technologies by contacting your local BIOPAC sales representative.

A Heartbeat Away: HRV Unlocks Autonomic Insights

The beating of the heart holds the key to a myriad of physiological questions that are of interest to researchers. The measured variation in time intervals between consecutive heartbeats, otherwise known as Heart Rate Variability (HRV), provides valuable insights into the activity of the autonomic nervous system, reflecting the balance between sympathetic and parasympathetic influences on the heart.

HRV allows researchers to assess cardiac health, stress levels, and overall autonomic function, making it an invaluable component of physiological studies to investigate numerous areas such as cardiovascular health, mental health, stress, and exercise physiology to name just a few.

A recent study applied HRV to examine the effectiveness of yoga and Ayurveda, a form of alternative medicine traditionally practiced in India and Nepal, to regulate and treat lymphedema. Lymphedema is tissue swelling caused by an accumulation of protein-rich fluid that’s usually drained through the body’s lymphatic system. Because lymph drainage has been connected to autonomic function, researchers postulated that HRV would provide meaningful insight into the effectiveness of yoga and Ayurveda programs in treating lymphedema. A BIOPAC two-channel BSL data acquisition system was employed to gather HRV and respiration data of participants who underwent an intensive regimen of yoga exercise, limb soaking, herbal baths, and manual lymph drainage. Initial comparisons of HRV data between both the test and control groups showed significant improvement in the lymphedema patients following treatment.

beating heartIn many cases, researchers choose to combine HRV with other signals to provide a more detailed picture of a participant’s autonomic response to stimuli. A 2020 study sought to identify an effective noninvasive measure of how the sympathetic nervous system (SNS) responds to stimuli. Typically, such measurements involve the invasive recording of muscle sympathetic neural activity at the peroneal nerve. This study examined HRV and electrodermal activity (EDA), both separately and in combination, to see which provided the most effective measurement of SNS activity. Researchers measured participants’ SNS response to both a cold-pressor test (submerging hand in ice water) and while viewing emotionally challenging video images. Throughout both tests, continuous ECG and EDA signals were acquired and analyzed using a BIOPAC four-channel data acquisition system. An ECG100C and EDA100C were used to acquire the ECG and EDA signals, respectively. From their results, researchers concluded that the combination of HRV and EDA provided a better metric for SNS activity than HRV alone.

Whether alone or in combination with other signals, HRV offers researchers a powerful tool for measuring how the autonomic nervous system responds to a wide range of stimuli and conditions with applications across a broad spectrum of fields. Visit our Webinars page for multiple examples of how HRV is being used in research and check our HRV citations as well.


Are you designing a study that features HRV? BIOPAC’s regional sales reps can help you access the right tools for the job to ensure the best possible results. Contact us today!

Measuring Moods: Signals for Insight into Emotion

“Do you ever look at someone and wonder what is going on inside their head?”

Joy, an anthropomorphized manifestation of happiness, delivers this line at the opening of Pixar’s 2015 animated hit “Inside Out,” a film that explores the emotional struggles of its young protagonist. She could have been speaking for generations of researchers who have plumbed the depths of the human psyche for a better understanding of the mechanisms behind our feelings, moods, and emotions.

When today’s researchers talk about emotion, they typically do so in terms of affect, the underlying physiological and psychological experience of feelings and emotions as a reaction to stimuli. Affect and emotion are not the same thing, per se, but are fundamentally connected. While the feelings we describe as fear, joy, love, hate, etc. remain abstract, affect is more concrete. BIOPAC co-founder and head of R&D describes it as “the measurable quality or manifestation of emotion in the human body.”

This manifestation can be measured in the human nervous system’s response to stimuli. Depending on the nature of the stimuli and how this sensory data is interpreted by the central nervous system, an array of physiological responses can take place: heart rate changes, the stomach and muscle groups tense, skin temperature responds, triggering sweat glands, among others.

The signals corresponding to these reactions provide researchers with valuable data to help them better understand affect and emotion. These signals—electroencephalogram (EEG), electrodermal activity (EDA), electromyogram (EMG), heart rate, and respiratory rate, to name a few—can be recorded and measured using a range of currently available sensing technologies.

As an example, a 2019 study published through the Queensland University of Technology used respiration signals as a means of classification for human emotions such as happiness, sadness, surprise, disgust, fear, and anger. In the study, breathing signals, including airflow rate and volume, were acquired and recorded using a BIOPAC MP36 data acquisition unit while participants were shown seven film clips, each associated with a different emotion. The study concluded that the respiratory data was 80% effective in accurately classifying affective responses to the film stimuli.

A team of researchers at the Khwaja Fareed University of Engineering and Information Technology in Pakistan took their investigation into the connection between physiological signals and emotion a step further. They used a similar approach by measuring participant response to movie clips, however this time, four types of physiological signals were acquired, including ECG, EMG, respiration, and skin conductivity (SC). The data was acquired with a wide range of signal sensors and analyzed via a BIOPAC MP160 DAQ System.Signals for Emotion

Signal sensing technology also allows researchers to study emotion in multiple participants simultaneously, as was the case in a 2020 dyadic study of how a parent’s stress and emotional suppression affects their children. The study measured physiological responses of both parents and children using ECG and impedance cardiography (ICG) via a BIOPAC MP150 data acquisition unit.

The mysteries of human emotion are being unlocked through a growing understanding of the affective response to stimuli. For more information on how physiological signals can be gathered and analyzed for this purpose, see our app note on emotional state physiology as well as our webinar Emotion and Objective Physiological Measures.


Contact BIOPAC for the latest information on how we can help you measure affect in the lab.

Choosing the Right Signal: Easy as 1, 2, 3

In physiology and life sciences, researchers rely on a wide range of signals to gather data from humans and animals. These signals provide critical insight into how complex organisms function under a myriad of conditions. However, this wealth of potential data sources can also present a challenge for researchers: choosing the right signals on which to focus their data gathering. For those lacking a background in the disciplines and mechanisms behind these signals, sifting through the available methodology can be overwhelming. The best place to begin is by considering one or a combination of the “Big Three” physiological signals: ECG, EDA, and respiration.

In physiology and life sciences, researchers rely on a wide range of signals to gather data from humans and animals. These signals provide critical insight into how complex organisms function under a myriad of conditions. However, this wealth of potential data sources can also present a challenge for researchers: choosing the right signals on which to focus their data gathering. For those lacking a background in the disciplines and mechanisms behind these signals, sifting through the available methodology can be overwhelming. The best place to begin is by considering one or a combination of the “Big Three” physiological signals: ECG, EDA, and respiration.

One from the Heart

Changes in heart rate can provide information on both the physiological and psychological state of a research participant. Electrocardiography (ECG or EKG) is a biopotential measurement that provides direct metrics on electrical voltage changes in the heart. With the help of simple hardware and software, it is possible to record these voltage variations as waveforms to track how the heart responds to stimuli. Additional data can be provided by creating reoccurring reference points in the waveform, measuring the intervals between beats, and calculating heart rate variability to track changes over time or in response to stimuli.

Skin Deep

Electrodermal Activity (EDA) provides one of the best measurements of how the body responds to psychological stress and anxiety. It can be simply understood as a measure of changes in the electrical conductance of the skin in relation to the production of sweat. The physiological process of EDA comprises two components, skin conductance level (SCL) and skin conductance response (SCR). SCL is a tonic level that slowly changes over time, measuring the period for response to a stimulus to occur, from its onset to its peak. SCR reflects the phasic response to an arousing stimulus that is shown in faster changes of the skin conductance level. As an example of the application of EDA and ECG measurements in psycho-physiological research, a recent study applied both signals in measuring the cognitive states of gamers during human-computer interaction (HCI).

Breathe Easy

ArachnophobiaAs with changes in heart rate, variations in breathing cycle reveal how subjects respond to a wide range of stimuli and conditions. The signal produced by the respiratory cycle is a transduced physiological signal. As such we can apply mechanisms to create a voltage potential to measure phases of inhalation and exhalation in this cycle. This data can be represented in waveforms, providing data on respiratory rate, amplitude, and respiratory sinus arrhythmia (RSA). The latter combines respiratory data with ECG signal data to show changes in heart rate in response phases in the respiratory cycle. A 2020 machine learning study for the development of virtual reality applications combined respiration, EDA, and ECG signals to measure participant’s fear response to spiders, an example of how all three signals can be simultaneously utilized in psychophysiology research.

Choosing the right signal shouldn’t be the biggest hurdle to designing your next research project. Applying one or more of these “Big Three” can cover a wide range of data gathering goals.


For additional assistance, consult BIOPACS online resources on Life Science and Physiological Signals or contact your local BIOPAC representative.

fNIRS and the Brain: How cognition is defined and recorded

As the most crucial organ of the human body that quintessentially defines humanity, the brain is still our greatest puzzle to solve. Medical doctors, neuroscientists, physiological scientists, and others have been trying to understand how its functions affect our actions, dating all the way back to the dark days of phrenology. In our study of the brain, the popular research is directed towards conscious thought, thinking, or the scientific term, cognition. In physical terms, the brain is separated into different areas of grey matter for different tasks, and like an electricity operator supplies a power grid with different levels of electricity on demand, regions of the brain gearing up for critical thought are saturated with fresh, oxygenated blood to boost performance: again a sign of an active cognitive state.

In modern scientific research, one of the popular means to measure this oxygenation is through Spectroscopy—more specifically, a unique field called functional near infrared spectroscopy. How does fNIRS work in measuring human cognition? These measurements are performed with optical diodes and sensors measuring a near infrared wave pattern.

Dedicated fNIRS software displaying tissue oxygenation
A graphical display of oxygenation in the prefrontal cortex

Near infrared light is sent through the skull in a spectrum that can pass through bone and tissue, and the sensors record the plots of photons absorbed by tissue or reflected back. Naturally with such a delicate subject such as the human brain, this process is both safe for the participant and painless.

The practical benefits of this spectroscopic measurement are numerous—continuous and real time values on changes in hemoglobin levels in the prefrontal cortex (measured as oxyhemoglobin [Hb] and deoxygenated hemoglobin [HbO2]) as subjects perform different tasks, either in a stationary recording position or in a mobile experiment environment. fNIRS technology offers standalone and field-deployable technology able to determine localized brain activity. Modern recording tools such as the fNIR103M offer a wireless recording platform, so research subjects can react naturally in real-world situations outside of the lab environment while continuously recording spectroscopic data.

fNIRS is a popular signal to record simultaneously with other physiological signals such as heart rate, ECG, HRV, EMG, respiration, and more to get a clear picture of a subject’s physiological reactions. Application areas for this signal typically include pain assessment, geriatrics, attention, sports science, Human-Computer Interface, virtual reality, stress, workload assessment, and learning. Thousands of scholarly citations have been written featuring functional near-infrared spectroscopy, as studies visualize how the brain works through cognitive problems and processes. To further your physiological research, BIOPAC’s AcqKnowledge software can record multiple physiological signals at once and provide automated analysis tools for event related potentials and ensemble averaging. fNIRS easily integrates with other physiological and neurobehavioral methods of assessing brain activity, including eye tracking, pupil reflex, respiration, and electrodermal activity.

BIOPAC Systems, Inc. provides life science researchers and educators with data acquisition and analysis systems that inspire people and enable greater discovery about life. Visit us at www.biopac.com. We invite you to look at our fNIRS webinars from BIOPAC. BIOPAC also offers a line of wired and wireless fNIRS imagers for research and education.

Top 10 Objections to Distance Learning

By: Jasmine Anderson, Biopac Student Lab Product Manager

  1. Simulations are not enough. Students need a practical hands-on lab experience with room to make mistakes.
  2. Internet is not reliable for students or the instructors and reading material alone does not lend to effective learning.
  3. Instructors’ hands are tied with limited budgets for investing in distance learning tools.
  4. Instructors struggle to adapt curriculum to new distance learning programs.
  5. Most lab kits and software are too complicated for students to use without guidance.
  6. Students lose the opportunity to collaborate and troubleshoot together while working in groups.
  7. Many learning tools discourage academic integrity with answers visibly posted online.
  8. Privacy concerns over personal data used in digital lab and simulation tools.
  9. Online e-Learning does not accommodate many learning styles – especially for social and/or kinematic students.
  10. Nothing compares to in-person labs and you won’t find a substitute.

Whether you’ve taught online in the past or are planning for your first time teaching online this fall, most educators agree that it’s not their preferred instruction method. However, the value of online education technology and its innate flexibility became clear this spring when campuses were forced to close early.

Now educators are planning for the fall and are once again having to evaluate how they will meet their learning objectives and goals in an online environment. There’s no question that the landscape of the traditional practical lab is changing, and we are now forced to ask ourselves: what is the “heart” of the practical lab and how can we translate that to the online classroom?

Simulations, virtual labs, and kitchen experiments meet a few of the marks, but none of them touch on the important interpersonal and professional skills gained in the laboratory. How can instructors incorporate communication skills and cooperative learning into the online classroom? And is it even possible to provide that HyFlex (high flexibility) course model given the current online tools?

These are valid and central questions to the new landscape of higher education. After seeing the consequences of the temporary plans put in place by educational institutions in the spring, BIOPAC worked to re-design our student lab systems for the new world of socially distanced learning.

In the old world, students would work around our lab stations in groups, completing guided lessons where they record physiological data from their own bodies. This encouraged cooperative learning, peer-to-peer instruction, and—most importantly—students learned effectively by doing.

With BSL Home, all the above is possible in an online environment. BSL Home includes the same trusted Biopac Student Lab physiology curriculum that is already used in 99% of the top 100 US universities and brings the physiology lab to your students, wherever they are.

BIOPAC can ship BSL Home kits to instructors on campus or directly to a student’s home address. It also comes with affordable purchase options to rent or buy. Unfortunately, the traditional lab is no longer a safe option and simulations or experiments using pipe cleaners and Play-Doh aren’t making the cut.

Practical lab experiments are critical for students that need a Bachelor of Science degree for a career in the medical front line, working in industry, or continuing their education. With BSL Home we can help you preserve your practical lab. For more information on how BSL Home can save your lab this fall, please join us for a live demo and contact us for BSL Home info.

VR—New Worlds to Explore

Use VR to Expand the Capabilities of Your Lab

The immersive technology of virtual reality (VR) literally offers whole new worlds to explore. Combining VR/Immersive Solutions with Physiology Data allows researchers to create virtual worlds that are impossible or prohibitively expensive in the real world. Additionally, researchers can synchronize VR events with physiological response data to record and analyze physiological, behavioral, and subjective response data. Multimodal stimulation can deliver visual (3D), auditory, olfactory, haptic, and/or electric stimulus to add an incredible degree of realism to the immersive world!

Interfacing a VR workstation with a data acquisition system can add a new dimension to your research by combining objective measures with a tightly controlled experimental protocol. Immersive environments can take the subject anywhere and allow you to unlock the boundaries of your physical lab space and budget.

  • Create rich 3D environments that are 100% personalized to match your protocol.
  • Send physiological data back to the VR world to make decisions based on the participant’s physiological responses

Participants can move around naturally within the virtual world while their physiological data is captured. Record any combination of signals: ECG, EDA, EEG, EOG, EMG, EGG, temperature, respiration, and pulse. Include eye tracking to track subjects’ gaze as they view the immersive environment during the experiment. Close synchronization between the stimuli and the physiological signals is achieved through digital markers.

Monitor data in real time and use detailed signal analysis for post-acquisition scoring of the data. Automated analysis routines can streamline the analysis process, eliminate subjectivity, and save time—see AcqKnowledge for some powerful options.

VR software provides you with an unlimited degree of flexibility to create a specific world and control people and items within the world. VR software is easy to use and adaptable, so researchers can make subtle changes to an experiment without having to redesign the entire protocol.

Immerse your subjects in a BIOPAC VR world and record physiological data as the virtual environment influences the subject. Applications are varied and include Psychology, Biomechanics & Kinesiology, Ergonomics, Marketing/Consumer Research, Healthcare, Computer Modeling/Simulation, Education, Training: hazard, medical, etc.,

Use a feedback loop for greater control and automation of the VR world. This allows the world to change in real time, based on the participant’s responses. Timing events are recorded for tight synchronization with physiological data for meaningful analysis.

See VR Resources here for more examples of how VR can expand the capabilities of your lab!

BIOPAC offers a wide array of wired and wireless equipment that can be used in your research. To find more information on solutions for recording and analyzing signals such as ECG, heart rate, respiration, and more using any platforms mentioned in this blog post, you can visit the individual application pages on the BIOPAC website.

Photo by stem.T4L on Unsplash

Eye Tracking Basics

eye tracking basics
Eye Tracking Basics | Eye Structure

To understand how eye tracking works, it is important to have a basic knowledge of the structure of the eye.

  • pupil—an aperture, or opening, in the iris that allows light to enter into the eye unless viewed exactly on-axis with a light source, the pupil appears black
  • iris—the colored part of the eye, opens and closes to control the pupil size
  • cornea—a thin, film-like tissue that covers the eye
    • on its way to the pupil, light passes through the cornea
    • the cornea is mostly transparent; however, some light is also reflected from the cornea
  • sclera—the white part of the eye

Some eye tracking systems, such as ETVision, use a tracking technique known as “Pupil to CR” Tracking that uses the relationship between two eye features, the black pupil and mirror reflections from the front surface of the cornea (Corneal Reflections, or CRs), to compute gaze within a scene.


pupil-to CR- eye tracking technique
“Pupil to CR” eye tracking

Light from a pair of harmless near infra-red LEDs on the head gear illuminate the eye area. The near IR light is almost invisible to the user, so it does not cause a distraction, however it is visible to the eye camera. The mirror reflections of these light sources from the front surface of the cornea (CRs) appear in the camera image as a pair of bright dots. When the eye rotates in its socket, the center of the pupil moves relative to the spots. By comparing the relative position of the pupil and the CRs, the eye tracking system can compute the pointing direction of the eye visual axis relative to a coordinate frame centered at the scene camera.

During periods when the headgear remains stationary on the head, eye gaze direction can also be computed from pupil or CR position alone, and this can allow the system to continue to compute gaze when only a subset of the eye image features can be successfully identified. By computing the point at which the lines of gaze from the two eyes converge, the gaze point can be represented as spot on the scene camera image.

Since the geometry of the eye structures and the position of the optics with respect to the face vary somewhat from person to person, gaze computation accuracy can be improved by incorporating data from calibration points (points at which the person wearing the optics is known to be fixating a particular point on the scene camera image). Excellent accuracy is often achieved with a single calibration point, but can sometimes be improved with additional points.

Eye tracking has many specific applications for academic research, HCI, market research (ergonomics & design), sports performance, virtual reality, etc., and can easily be added to any study to increase feedback from participants in any environment.

Adapted from the ETVision Manual 


Ready to learn more?

Watch Eye Tracking Fundamentals now or visit our Webinars and Video Tutorial pages.

BIOPAC offers a wide array of wired and wireless equipment that can be used in your research. For more information on solutions for recording and analyzing life science signals and measurements, visit the Research > Applications section on the BIOPAC website.

T4 Conference Wrap-up

August is a month of barbecues, baseball, and last-minute vacations against the backdrop of a fading summer, and the eighth month of 2019 proved to be an equally exciting time at BIOPAC, with something of a pleasant vacation thrown in. On August 12-14, BIOPAC hosted its 2nd Biennial “Tools, Trends, Techniques, and Technology” Human Physiology Conference, known as “T4” to our friends and partners around the world. This three-day event, first held in 2017, featured lively, informative sessions hosted by BIOPAC staff, partners, noted academics, and industry experts, and covered a wide range of physiological techniques and disciplines. Over 150 attendees joined BIOPAC at the 2019 T4 Conference staged once again at the beautiful University of California at Santa Barbara campus. Participants and instructors winged in from China, Australia, Germany, Sweden, Italy, Spain, U.K., Ireland, and Egypt, as well as from wide regions of the U.S and Canada to soak up the idyllic surroundings of this ocean-side campus.

The focus of BIOPAC’s T4 Conference was to provide a fun, relaxed environment while hosting nearly 40 hands-on, human physiology training workshops chaired by over 20 distinguished instructors from around the globe. One of the many conference highlights was the “Mindfulness, Meditation, and Measurement: Mindfulness Exercises in Physiological Monitoring” session, hosted by Dr. Allan Weiss of the University of Southern California and  BIOPAC Co-founder and Director of R & D Alan Macy. These sessions, conducted in two parts over a two day period were booked beyond capacity, even though the early morning fog hadn’t yet lifted from the campus skyline.

The varied additional sessions covered a range from the basics, “Setting Up Your Lab, Getting Great Data and Troubleshooting,” (hosted by Dr. Terry Blumenthal of Wake Forest University, and BIOPAC’s Alan Macy and Tim Cook), and “Creating Your Own Lessons Using BSL PRO,” (hosted by Dr. Taffeta Elliot of the New Mexico Institute of Mining and Technology), to exciting new technologies such as “Integrating Screen-based Eye Trackers with AcqKnowledge,” with Keith Jackson of BIOPAC partner company EyeTech, BIOPAC CEO Frazer Findlay, and BIOPAC Engineering Manager Ed Peterlin. Additional wide-ranging physiological disciplines were also covered, including MRI techniques, stimulation, and exercise physiology. All sessions were conducted using BIOPAC hardware and software systems, as well as platforms provided by BIOPAC partners such as Cedrus, fNIR, WorldViz, Psychology Software Tools, and CNSystems. At the end of each day, it was time to relax and unwind with a beverage of choice, a a walk along the beach, and some good conversation. Each evening featured excellent meals and camaraderie in the relaxed yet elegant environment of some of Santa Barbara and Goleta’s most stunning surroundings. After three great days of immersive sessions, it came time for everyone to part ways, having forged new collaborative partnerships and an enhanced knowledge about the full potential of BIOPAC and BIOPAC partner products.

You don’t have to wait for T4 2021 to learn more about life science data—watch Fundamentals of Physiological Data Recording now!

For a closer look at T4, and a preview of what is sure to be an exciting 2021 event, we invite you to visit our T4 Human Physiology Conference page.

Looking for additional resources, tips, tricks, and expert advice on BIOPAC and BIOPAC Partner products? Please also visit our Webinars and Video Tutorial pages.


BIOPAC offers a wide array of wired and wireless equipment that can be used in your research. To find more information on solutions for recording and analyzing signals such as ECG, heart rate, respiration and more using any platforms mentioned in this blog post, you can visit the individual application pages on the BIOPAC website.

error: Content is protected !!