4T|Phys 2023: BIOPAC Shares Tools, Trends, Techniques & Technology at UCSB

They hailed from across the globe, from Arkansas to Zanzibar and all points between. Students, teachers, researchers, and innovators gathered on the campus of UC Santa Barbara, overlooking the Pacific Ocean. They came to learn, share, and explore breakthroughs and best practices in physiology and related fields. 4T|Phys kicked off July 17 under clear California summer skies, an idyllic setting for discovering the Tools, Trends, Techniques, and Technology driving physiology education and exploration.

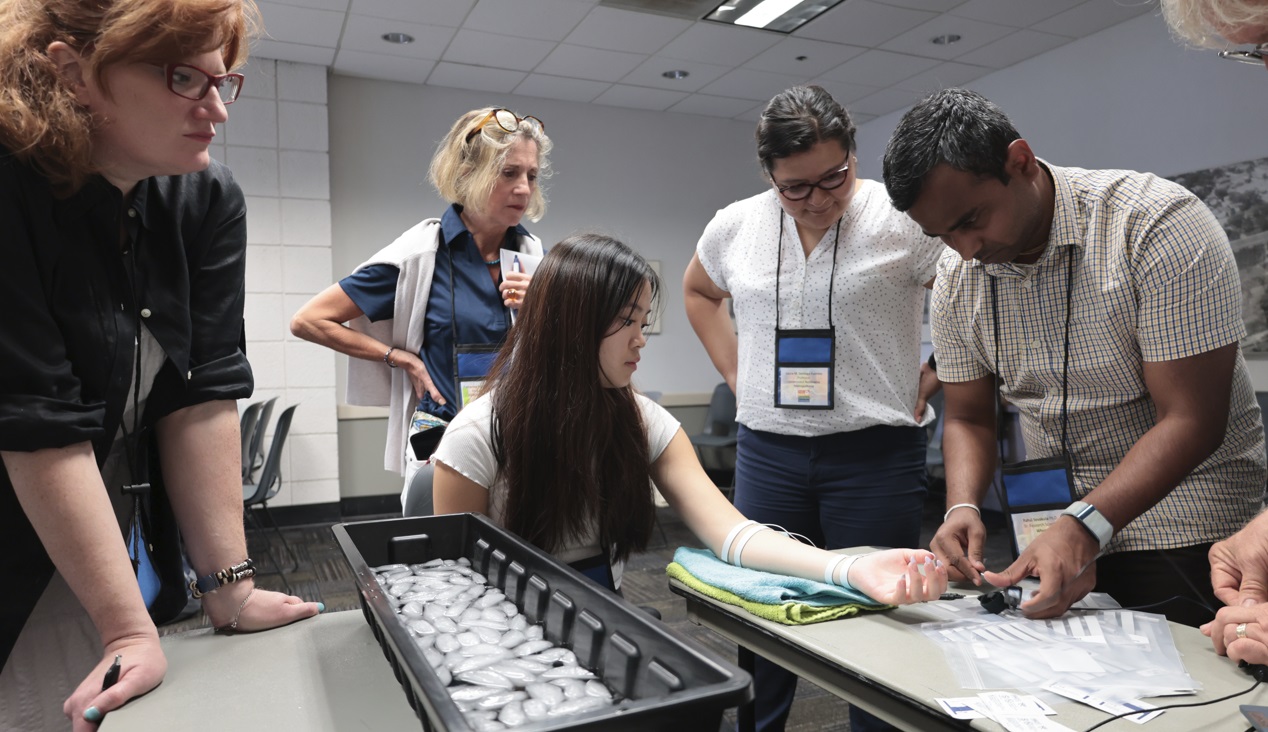
4T|Phys 2023 was the third installment in BIOPAC’s highly successful series of biennial industry conferences that began in 2017. After a two-year hiatus during the global Covid-19 pandemic, 4T came roaring back this summer with more workshops, more tracks, more sponsors, more presenters, and more countries represented than ever before. Over the course of three days, nearly 100 attendees participated in hands-on sessions with some of the top minds in physiology research, experiencing the latest tools for gathering and analyzing data.

BIOPAC’s in-house experts were joined by an array of authorities from the fields of physiology, psychology, imaging (fNIRS and fMRI), neuroscience, cardiovascular research, eye tracking, virtual reality (VR), biology, and engineering. Participants took part in workshop schedules drawn from five separate tracks that included fundamentals, which focused on the basics of data acquisition and analysis. The research track took attendees on a deeper dive into techniques and technologies, including recording evoked potentials, screen-based eye tracking, impedance cardiography using trans-radial bioimpedance velocimetry (TREV), stimulus presentation, exercise physiology, and many others. Participants were also able to tour UC Santa Barbara’s state-of-the-art Brain Imaging Lab to see up close how BIOPAC products are being used in both functional MRI (fMRI) and TREV studies.

“It was an incredible experience that left a lasting impact on me by helping me to understand more about physiological data collection and analysis,” said Dr. Parth Trivedi, a 4T|Phys attendee. “The choice of presenters and the topics covered were truly inspiring, offering valuable knowledge and fresh perspectives that enriched my understanding.”

4T|Phys 2023 Attendee MapThis year’s conference featured several new tracks such as a dedicated VR track led by partner company WorldViz. The WorldViz team showcased virtual reality solutions in a series of workshops that introduced how VR is being integrated in physiology and psychology research, explained how to create effective and immersive VR experiments, and demonstrated their latest PRISM technology for creating fully immersive projected 3D virtual environments.

Several other partner companies introduced their technologies and products both in the 4T exhibition hall and in workshop sessions. Argus Science presented their ETVision eye-tracking glasses that synch seamlessly with AcqKnowledge. Cognixion demonstrated the Cognixion One Axon-R—Research Edition wearable BCI-AR computing platform, which is being used to help individuals with neurodegenerative conditions and severe motor impairments communicate and interact with their environments assisted by augmented reality. Seenel Imaging showed off their MedelOpt Systems for whole-head EEG with fNIRS, including new VR integration. Participants also got a chance to try on the Research Ring by Senstream, a new user-friendly wearable research ring, which allows easy recording of EDA, PPG, Temperature, and ECG signals. CNSystems showed off the company’s NIBP continuous noninvasive blood pressure (NIBP) and hemodynamics devices.

If you missed the educational and networking opportunities at 4T|Phys 2023, don’t despair. We will be back again in a few years, bigger and better than ever. Watch this space for updates on our next installment. In the meantime, see our Video Tutorials and Webinars On Demand for trainings and seminars on our products and partners.


Make sure you never miss a BIOPAC event and keep up with the latest Tools, Trends, Techniques, and Technologies by contacting your local BIOPAC sales representative.

Mind and Body: Signals to Enhance Your Psychophysiology Research

The human body and mind share an intrinsic link, both influencing and reflecting the health and general well-being of the other. Within the field of psychophysiology, researchers gain a wealth of insight into mental processes and disorders by studying physiological signals recorded from both the brain and body. Signals such as electrodermal activity (EDA), skin temperature (SKT), electroencephalogram (EEG), heart rate variability (HRV), and functional near-infrared spectroscopy (fNIRS) provide just a few of the tools helping us to better understand these mind-body interactions.

A wide range of research technologies has made these signals increasingly accessible in the lab as well as in everyday environments, allowing studies to place participants in increasingly naturalistic settings while gathering critical physiological data. In this way, researchers can provide a more accurate picture of how study participants react to stress and arousal, experience emotion, or interact within group environments.

One recent study used EDA and heart rate (HR) to examine the role of emotion in student success within computer-based learning environments (CBLE). As discussed in previous posts, a range of signals can be used to measure the body’s physiological response to emotion, otherwise known as “affect.” By gaining a better understanding of learners’ emotional responses to CBLE stimuli, researchers in this study hope to apply their data to improvements in CBLE design. EDA data was gathered from participants via SS57LA EDA leads while HR signals were collected with SS2LB shielded lead sets, both of which were connected to a BSL MP36 data acquisition and analysis system. Participants were shown imagery designed to evoke a negative emotional reaction before being asked to read a complex academic paper. The study was able to establish a link between the participants’ emotions and their comprehension of the reading material.

head with brain exposedIn another study, researchers used EDA and skin conductance response (SCR) to measure participants’ reactions to conditioned stimuli (CS) and unconditioned stimuli (US). The goal was to determine if fear-inducing memories could be modified either pharmacologically or through behavior modification to overcome fear. An MP36R System with AcqKnowledge software allowed analysis of SCR signals gathered via SS3LA finger transducers across a range of experiments designed to trigger fear-inducing memories. While the overall results were inconclusive, the SCR signals provided valuable feedback regarding the participants’ response to stimuli.

While EDA is a common thread through many of these psychophysiology studies, other signals provide researchers with a more complete and nuanced data set from which to draw their conclusions. Researchers exploring the factors influencing musical preferences combined EDA data with ECG and facial electromyography (fEMG) signals to assess how listeners reacted to familiar and unfamiliar musical stimuli. Data from all three signals were fed to an MP36 data acquisition and analysis system. The study found a strong correlation between musical preferences and familiarity with material as reflected by the subjects’ emotional responses.

These examples only scratch the surface of how psychophysiological research is being aided by an array of signals, all made accessible with available technology. To learn more about how to implement these signals in your next study, see BIOPAC’s Psychophysiology Applications webpage.


Contact your BIOPAC sales representative to learn more about the wide range of data-gathering tools available to help you construct your next psychophysiology study.

Biopac Student Lab | What I Learned This Summer

A Student’s Perspective

Guest post by Ashley F.

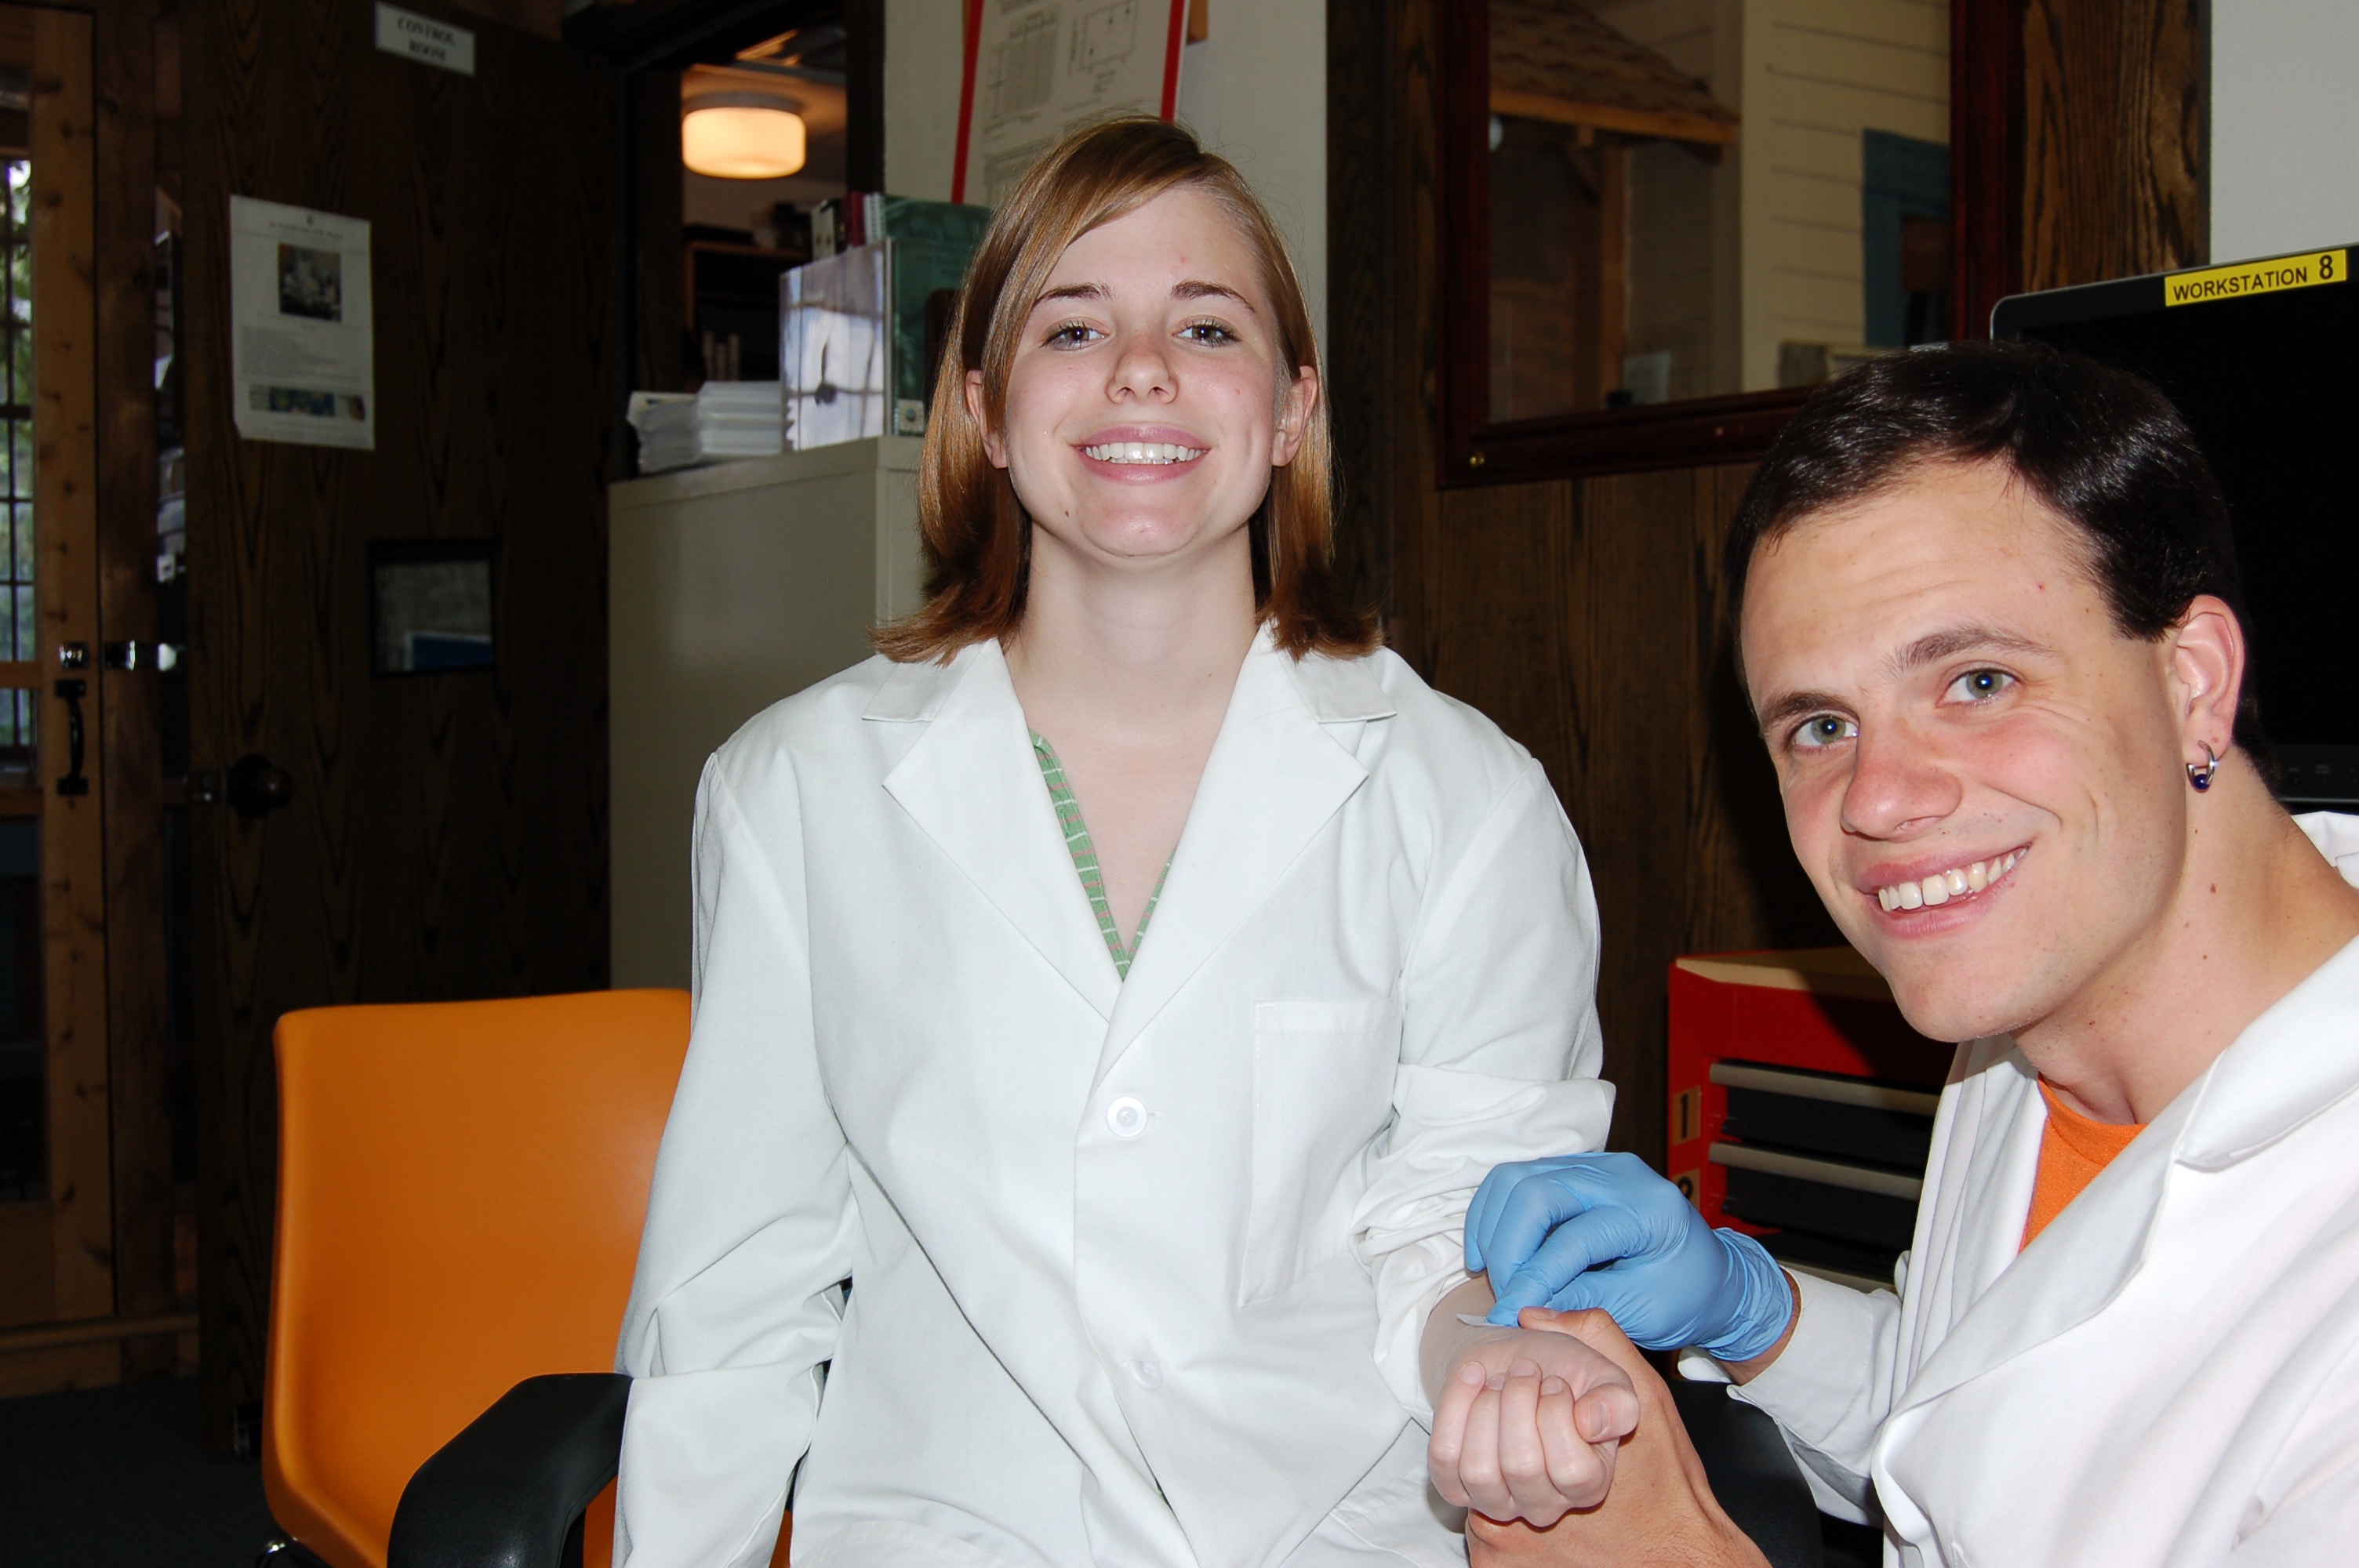
Like many of my university peers, I wrapped up my freshman year of college working a summer internship in hopes of gaining valuable professional experience. Rather than relaxing on the beach, I occupied my time between June and August with electronic breadboards and ice bucket plunges. All this took place at BIOPAC where I was tasked with reviewing the BSL PRO Lessons, helping the company continue to refine and improve these teaching aids.

Let me start by confessing that I am not a physiology or anatomy major, but rather a development and psychology major. Given this difference, I did not expect to find that so many of the BSL PRO Lessons connect to what I am studying. BSL PRO Lessons stand out compared to your average textbook for multiple reasons. For me, the primary difference is that with BSL PRO Lessons, you get to watch the data take shape in real-time. And it’s not just random data, but data from your own body—your heart beating, your finger twitching, your eyes tracking a pendulum. Because the data is from you and not a textbook, the lessons are more interesting to analyze.

Throughout the summer, I worked through each “human” BSL Lesson, gaining experience with the software, equipment, and workspace. Each lesson includes a ‘background’ section that provides context to the lesson and connects each one to different concepts. This context makes the data from each lesson relevant to more disciplinary studies than just physiology and anatomy, which in turn broadens the student’s knowledge. Because BIOPAC wanted to test the materials under realistic student lab conditions, I wasn’t given much guidance on how to approach individual lessons. Rather, I would simply read the manual and follow the instructions, which turned out to be surprisingly easy as I figured out how to do most of it on my own.

With a total of 39 BSL PRO lessons, you would expect at least a few to be quite similar. And yet, BIOPAC understood the importance of unique lessons and ensured that each one had a different background section, used different equipment, and covered a different topic.

woman submerging head in cold waterEach lesson includes fun concepts to keep you engaged, like dunking your head in cold water to see how your heart rate changes in Lesson H08: Dive Reflex, using equipment to make your finger twitch in Lesson H06: Finger Twitch, or testing and timing your reflexes in H16: Reflexes & Reaction Time.

While each lesson is unique and covers a different topic in physiology and anatomy, the lessons do follow a clear progression as you move from BSL PRO Lesson 1 to 40. They start shorter, utilizing more basic concepts and equipment. Then, as you progress through the lessons, you begin to work through increasingly complex physiological concepts until you end on a lesson involving the use of a breadboard. This last lesson involves nine separate labs, each as involving as the earlier individual lessons. This amount of work may sound daunting at first, but the skills picked up while completing the previous lessons leave you well-prepared to complete the final lesson and analyze clear data.

Working through BSL PRO Lessons is a unique and interactive experience that allows students to learn, connect, and analyze personalized data from a broad range of physiological and anatomy concepts, leaving you with a well-rounded and contextualized education experience.


Learn more about BIOPAC’s education solutions, including complete teaching systems for a variety of life science disciplines. BIOPAC also provides a wide range of research systems for recording, displaying, classifying, and analyzing physiological signals & measurements.

BIOPAC Systems, Inc. helps life science researchers and educators
measure physiology anywhere, any time, from any subject.
Visit us at www.biopac.com.

A Brief Tour of Psychophysiology

Why are we interested in psychophysiological measurements? Which measurements are these exactly? By “measurements,” we are talking about micro-facial expressions, pupil dilation, peristaltic contractions of the intestines, heart activity, breathing patterns, electrodermal activity, and other responses not visibly apparent.

In the 1880s, an English philosopher named William James was among the first to explore what constitutes an “emotion.” James believed that everything, big and small, that happens to us and around us elicits a constant stream of feelings and responses. These responses can range from indifference, fear, excitement, happiness, stress—virtually the full gamut of the human emotional palette.

Why does this happen and how do we measure it?

There is always a response in our bodies as a consequence of input delivered via our senses, and there is a resulting “feeling” that happens. Sometimes the feeling doesn’t have much impact but at other times, its effect is profound. The term “emotion” is the label that we assign to these feelings. These feelings result in a response that affects our physiology. These physiological responses to ongoing events are objectively measurable and referred to as “affect.”

Data enters the brain via our senses, but it takes a small period of time to process the input; about 50 milliseconds if the event is a sound, and 100 milliseconds if visual. When data comes in, it travels through various neural pathways and our response to it is informed by our previous experiences. An extreme example to external input causing profound affective changes would be in someone with post-traumatic stress disorder (PTSD), in which certain sounds, or other situational input can trigger pronounced panic or discomfort. People with phobias (for example, fear of cats) will exhibit physiological changes far out of proportion to the actual danger posed by the perceived input. Someone who loves cats would undoubtedly experience a warm fuzzy feeling, whereas a person with a cat phobia would be panicked, resulting in dramatic and measurable changes in heart rate, respiration, and eccrine activity (skin sweating).

An evolutionary motivation baked in to our consciousness is the “fight or flight” response, in which we respond to danger and make a quick decision whether to run or defend ourselves. We all have different thresholds for which input might trigger this response. The line is often blurred between what constitutes actual danger or a seemingly innocuous sensory event that ignites an unpleasant memory or triggers the ghost of a previous traumatic experience.

Now that we have briefly explored a thumbnail sketch of psychophysiology, what kind of equipment is used for recording psychophysiological data? When we set up a psychophysiology experiment, we can record the changes occurring in the body and analyze the results with a great depth of accuracy. To record these signals, specific data acquisition hardware such as the BIOPAC MP36 is commonly used, with a SS2L transducer for recording ECG and a SS57L EDA (electrodermal activity) transducer. The software used to process and display these signals is very often AcqKnowledge (for research) or Biopac Student Lab (for education).

Although emotions cannot be captured or studied in a lab, the physiological changes that result from emotional experiences certainly can be.

For further reading about emotional affect, please see our blog “Circumplex Model of Affect and Motivational State.”

Other related BIOPAC resources:

BIOPAC offers a wide array of wired and wireless equipment that can be used in your research. To find more information on solutions for recording and analyzing signals such as ECG, heart rate, respiration, and more using any platforms mentioned in this blog post, you can visit the individual application pages on the BIOPAC website.

Photo by Noah Buscher on Unsplash


Fielding a Media Psychophysiology Team

Author: Ashley Churchill, M.A., BIOPAC Midwest Sales

Media psychophysiology research is being embraced by a variety of communication departments around the world. Media psychophysiology generally refers to the measurement of biological responses to messages in order to understand viewers’ cognitive and emotional processing of video, audio, or print messages. Media researchers often focus on measuring processes that occur as one interacts with media content over time and they look for insights into how and why certain media effects emerge (see Potter & Bolls, 2012 for more background).

Social science labs and communication researchers might feel daunted when starting up a lab if they are inexperienced in collecting physiology data. Here are three common strategies that will support the development of a media lab team and contribute to its success.

Ensure the research team has access to and is comfortable seeking out assistance from a variety of resources. Psychophysiology is a fundamentally interdisciplinary science. Incorporating it into your research requires that you draw on both technical and conceptual knowledge from disciplines outside of social science. To complicate things, formal psychophysiology resources can be difficult to find within the typical social science department. Effectively using external resources like subject librarians, university IT, faculty across departments, and BIOPAC’s support team, can help overcome this challenge.

Explain the conceptual aspects of media psychophysiology to your research assistants, whether they are volunteering for the semester or plan to stick around for a few years. Providing RAs with a conceptual background regarding relationships between media, psychology, and physiology can mean the difference between success and failure as far as effectively identifying and resolving problems during an experiment. It takes more than simple knowledge of electrode placement to make someone effective in a data collection role. Guiding RAs in a way that reflects this supports stronger research and researcher retention.

Preserve the practical knowledge generated by your team, do not let it leave with them. Learning how to conduct media psychophysiology research takes time and experience. As different team members rotate in and out of the lab over time, continue to support lab practices that preserve their knowledge and understanding of this research approach. Whether this takes the form of storing informative documentation or encouraging them to lead aspects of new member onboarding, these practices are important to improving the effectiveness of your team over time.

To find more information regarding media psychophysiology, check out our recent webinar featuring media psychophysiology expert Dr. Paul Bolls. To learn about signals that are common in media psychophysiology research— like fEMG, ECG, and EDA—visit our library of on-demand life science webinars.


BIOPAC offers a wide array of wired and wireless equipment that can be used in your research. To find more information on solutions for recording and analyzing signals such as ECG, heart rate, respiration, and more using any platforms mentioned in this blog post, you can visit the individual application pages on the BIOPAC website.

Photo by Vlad Hilitanu on Unsplash

Best Practices for Recording & Analyzing Data

Over the past several years, tools and techniques for recording and analyzing physiological data recording have seen steady and marked improvement. Modern life science data acquisition systems such as the MP160 System and powerful research-grade software suites such as AcqKnowledge bring high-end physiology tools within reach of the smallest lab. Even with continuing advances and reduced margin for error, it remains prudent to follow some fundamental guidelines for maximizing data quality and clarity.

Preparation is important. First, invest time exploring the system if it’s new or unfamiliar. An overview of the documentation, training videos, and available webinars, as well as some practice runs with the hardware and software will save time and effort when the time comes to conduct a study. This will also build proficiency at identifying the differences between good and poor data.

Next, familiarize yourself with the type of electrodes and/or transducers necessary for the physiological signals you will be acquiring, which includes proper electrode and skin site preparation. For example, gently abrading the skin prior to applying electrodes is normally recommended for most signal types, except for electrodermal activity (EDA), in which case it’s vital to NOT abrade the skin beforehand. It is also helpful to wait at least 5 minutes before starting a recording, which enables the electrode gel to be absorbed into the skin, helping reduce the impedance.

Performing an impedance check to ensure that the electrodes are making good contact with the skin is also highly recommended. This task is made easier by using an Electrode Impedance Checker (such as EL-CHECK), a simple device for quickly measuring the resistance between the skin and the electrode that provides an LED readout of the skin/electrode contact quality. If the resistance is too high (indicating poor contact) proper adjustments can be made before starting an experiment.

For certain signal types, excessive participant movement can introduce unwanted artifact into the signal, resulting in poor or skewed data. Make sure the participant remains as still as possible during studies involving these signals. Using tape to attach the electrode leads to the skin and keep them from moving excessively can also be helpful.

A thorough check of the system and all connections, cameras, and other hardware is important, so that any problems with equipment or setup can be addressed in advance, thus avoiding a show-stopping issue in the midst of an experiment. This would include performing a pilot study with trained personnel in order to head off any unforeseen issues with the data collection.

Creating a lab setup conducive to a relaxed environment for the participant and technician alike will yield better results. This means eliminating clutter, noise, and other distractions that can affect comfort and attention span. Some labs even avoid having their staff wear lab coats because this can heighten participant nervousness.

Keeping detailed notes on successful lab setups is also helpful and will streamline the preparation process for future experiments. Additionally, creating and saving graph templates for regularly-repeated experiments will save further time and effort.

For more about the fundamentals of recording great data, we invite you to view this free on-demand webinar Fundamentals of Physiology Recording.


BIOPAC offers a wide array of wired and wireless equipment that can be used in your research. To find more information on solutions for recording and analyzing signals such as ECG, heart rate, respiration and more using any platforms mentioned in this blog post, you can visit the individual application pages on the BIOPAC website.

Photo by John Schnobrich on Unsplash

fNIRS Systems—a NIR miracle

At the dawn of the 19th century, pioneering astronomer Sir William Herschel discovered the existence of infrared radiation, which is electromagnetic radiation invisible to the human eye but identifiable via its ability to heat objects. Infrared radiation is commonly divided into three categories, near, mid, or far infrared waves. In ensuing years, infrared radiation was found to be useful for industrial, scientific, military, and law enforcement applications, such as heat signature tracking and night vision goggles. Over two decades ago, a new technology called near infrared spectroscopy (NIRS) was developed for non-invasively measuring specific aspects of human physiology using near infra-red waves. While far infrared waves lie closest to the microwave region, near infrared waves are closest in length to the visible light part of the electromagnetic spectrum, and are microscopic in size. Unlike far infrared waves, near infrared waves do not produce any heat. In fact, we can’t feel them at all. They are the small waves used by common devices such as a
remote control.

Today, near infrared waves are commonly used  for studying many application areas of human physiology, notably by the fNIRS Imaging Systems to gather precise, high-density brain function and muscle oxygenation data.

How does fNIRS work with regard to human physiology? It’s an optical technology which sends light into the tissue and records the light that scatters back via a photo-diode and sensor attached to the subject. The fNIRS continuous wave technology uses an optical window in the near infrared spectrum that enables light to pass through. For example, when you hold your hand in front of a strong white light, the tissue can appear red and almost translucent. fNIRS shines light into the skull or muscle tissue, and using special detectors, records the resulting light scatter that returns to the surface.  The light penetrates skin, bone, and alights on the brain before its return trip to the surface detectors, and accomplishes this painlessly without heat. In fact, the subject does not even feel the near infrared energy and the light is harmless. The result is startling images and functional data of the brain at work. The fNIRS Systems (ranging from Educational to High-Density versions) include fNIRsoft software for processing, analyzing and visualizing functional near infrared (fNIR) spectroscopy signals through a graphical user interface. Additionally, the fNIRS Systems work with the BIOPAC MP160 Research System and AcqKnowledge software in conjunction with other physiological signals such as ECG, respiration, cardiac output, blood pressure, electrodermal activity, and stimulus response markers. AcqKnowledge software also provides automated analysis tools for event related potentials and ensemble averaging.

fNIRS brain function application areas include workload assignment, VR,  stress, attention, geriatrics, economics, ergonomics, learning and performance, sports science, HCI, pain perception, and cognitive workload – low or high.

fNIRS Systems can also be used to measure muscle oxygenation data, including oxidative capacity, muscle load, lateral imbalances (left vs. right muscle group) oxygenated hemoglobin and de-oxygenated hemoglobin in muscle activity.

We invite you to enjoy a comprehensive free fNIRS webinar and to visit our fNIRS products page.

BIOPAC offers a wide array of wired and wireless equipment that can be used in your research. To find more information on solutions for recording and analyzing signals such as ECG, heart rate, respiration and more using any platforms mentioned in this blog post, you can visit the individual application pages on the BIOPAC website.

Getting the Bands Back Together – Components of the EEG Signal

Many notable events occurred in 1929, not all of them good. The St. Valentine’s Day massacre. The stock market crash that triggered a worldwide economic crisis. The chain saw was invented. Not much good was happening in Germany either. Rampant inflation, the decline of the Weimar Republic, and the implacable rise of Nazism. But 1929 was also the year that German physician Hans Berger made an important scientific discovery that continues to influence how we study the human brain today. Dr. Berger discovered that electrodes placed on the human scalp could detect various patterns of electrical activity. After further study confirmed that these patterns were indeed related to brain activity and not mere scalp muscle artifact, scientists began to delve into the constructs of these “brain waves.” Today, electroencephalography (EEG) is still the primary method employed for recording brain function. In medical and basic research, correlation of particular brain waves reveals valuable information about sleep phases, emotional states, psychological profiles, and other mental activities. Much of this information is derived from five simple periodic rhythms, or frequencies, recorded in the EEG signal—alpha, beta, delta, theta, and gamma waves. These frequencies are known to be associated with specific degrees of alertness, affect, emotional states, and sleep. What do these frequency bands tell us about what is going on behind the gray matter? Allow us to introduce the band members.

Alpha (8-13 Hz) – Mellow Band Member

Alpha waves are associated with relaxation and calm. In general, the alpha rhythm is the prominent EEG wave pattern of adult subjects who are awake, but relaxed with eyes closed. Each region of the brain has a characteristic alpha rhythm but alpha waves of the greatest amplitude are recorded from the occipital and parietal regions of the cerebral cortex. In general, alpha wave amplitudes diminish when subjects open their eyes and are attentive to external stimuli, although some subjects trained in relaxation techniques can maintain high alpha amplitudes even with eyes open.

Beta (13-30 Hz) – Band Manager

Beta waves are related to memory, focus, and problem-solving. beta rhythms occur in alert individuals who are attentive to external stimuli, or exerting specific mental effort. Paradoxically, beta rhythms also occur during deep REM sleep. Beta waves may also be associated with “remembering” or retrieving memories.

Delta (1-5 Hz) – Supportive Band Member and Theta Rhythm (4-8 Hz) – Creative Band Member

Delta and theta rhythms are low-frequency EEG patterns that increase during sleep in the normal adult. Delta waves are associated with rejuvenation of the body through restorative deep sleep. Theta waves are more aligned with creativity and emotional connection. As people move from lighter to deeper stages of sleep (prior to REM sleep,) the occurrence of alpha waves diminishes and is gradually replaced by the lower frequency theta and then delta rhythms.

Although theta and delta rhythms are generally most prominent during sleep, there are cases when delta and theta rhythms are recorded from individuals who are awake. For example, theta waves will occur for brief intervals during emotional responses to frustrating events or situations. Delta waves may increase during difficult mental activities requiring concentration. In general, the occurrence and amplitudes of delta and theta rhythms are highly variable within and between individuals.

Gamma (> 32 Hz) – Perceptive Band Member

Gamma waves bring to the party cognition, information processing, learning, memory, and perception. Gamma waves were largely overlooked before the development of digital electroencephalography, as analog electroencephalography is restricted to recording and measuring rhythms that are usually less than 25 Hz.

A gamma wave is considered to be the “fastest” brain activity. The prominence of this wave leads to anxiety, high arousal, and stress. In optimal conditions gamma waves help with attention, focus, binding of senses (smell, sight, and hearing), consciousness, mental processing, and perception.

Research studies reported that gamma activity is involved in attention, working memory, and long-term memory processes, although excessive Gamma activity is also involved in psychiatric disorders such as schizophrenia, hallucination, Alzheimer’s disease, and epilepsy.

So in a sense, the periodic rhythms alpha, beta, delta, theta, and gamma, like the members of a tight musical ensemble, have distinct but overlapping roles for enabling the human brain to achieve wondrous things great and small that are often taken for granted.

BIOPAC Systems, Inc offers the following solutions for recording and analyzing EEG signals for research and education applications.

MP160 System with AcqKnowledge Software
EEG100D Smart Amplifier
EEG100C Amplifier Module
EEG100C-MRI Amplifier Module
BioNomadix Wireless EEG
BioNomadix Smart Center
Mobita 32-Channel Wireless EEG System
B-Alert Wireless EEG with Cognitive States Software
EPOCH Wireless In Vivo Neural Recording Systems—longterm EEG for rats, mice, or pups
Biopac Student Lab Systems—with EEG I, EEG II, and Hemispheric EEG lessons

We also invite you to enjoy our library of free EEG webinars on our Webinars page.

The Face of Facial Expression Analysis

Say you’re in a situation where it behooves you to keep a poker face. At an auto dealership negotiating a price on the new car of your dreams, or sitting across from your boss trying to make a case for a promotion. Your heart is pounding, sweat is forming in the crevasses of your palms, yet you need to keep yourself in check and not betray your excitement or apprehension. How skilled are we at masking emotions really? Emotions affect everyone in daily life, and play a key role in non-verbal communication. They are essential to understanding human behavior. A growing area of research is geared toward classifying and analyzing human emotions for a variety of studies, and methods for acquiring this data have become increasingly reliable and sophisticated. How do these studies work, and how is something as amorphous as the smallest twitch of a facial expression accurately recorded?

Facial “emotion reading” software such as FaceReader can detect minute variations in facial expressions by analyzing key points on the face (over 500) and has been “trained” with more than 10,000 manually annotated images to enhance facial modeling accuracy. Using this vast classification library, the input is distilled into six basic or universal emotions, (happy, sad, angry, surprised, scared, disgusted, or neutral.) Facial expression data is non-invasively gathered in real-time via a still or video camera, so no electrodes or leads are necessary.

But these refinements are more than skin deep. Additional tools for further quantifying facial expression data are commonly available. “Action Units” is the term used to describe individual or group facial muscle activity. The FaceReader Action Units add-on module allows automatic analysis of a selection of 20 common Action Units (such as raising of cheeks, wrinkling of nose, dimpling, and lip tightening) to measure affective attitudes (such as interest, boredom, and confusion).

Facial expressions can be visualized as bar graphs, in a pie chart, and as a continuous signal. Using FaceReader integrated with AcqKnowledge software and the MP160 System extends the functionality. Not only is the data automatically synchronized with other signals (ECG, fEMG, EDA, etc.,) but the recorded facial video can be monitored in the FaceReader display for real-time feedback.

Perhaps with a bit of practice, you can pull off that promotion and be able to afford that new car without tipping your hand!

For more information about FaceReader Software, watch the free On-Demand Webinar, “Using Facial Expressions to Understand Behavior” with BIOPAC CEO Frazer Findlay.


BIOPAC offers a wide array of wired and wireless equipment that can be used in your research. To find more information on solutions for recording and analyzing signals such as ECG, heart rate, respiration and more using any platforms mentioned in this blog post, you can visit the individual application pages on the BIOPAC website.

Think As Scientists Think—Empirical Research Skills

Learning to think as scientists think is empowering and drives this process and “Hard” and “soft” research skills combine well with Biopac Student Lab Lessons.

(Photo © 2016 Knowledge Growers, Inc.)

By Howard Iver Thorsheim, Ph.D., St. Olaf College

“Hard” and “soft” research skills combine well with Biopac Student Lab Lessons; for example:

  • Working as members of cooperative-learning teams;
  • Learning about basic psychophysiological measures;
  • Organizing supplies;
  • Following a protocol to greet a participant;
  • Explaining proposed procedure, and obtaining written informed consent using a form they draft;
  • Preparing participant, placing electrodes, and manipulating independent variables;
  • Debriefing participant;
  • Analyzing and graphing results;
  • Writing up research results in APA format.

Since the goal is learning skills for thinking, many of the usual requirements for rigorous research headed for publication can be relaxed for beginning students. This can motivate students for advanced student research honors projects or faculty/student research. Some examples of requirements that can be relaxed include naive participants (team members can serve as experimental participants in each other’s explorations—availability samples), sample sizes large enough to attain statistical power (instead two or three can be sufficient), and random assignment to conditions.

Learning to think as scientists think is empowering and drives this process, and some examples include students thinking about:

  • Articles of interest students find in data base searches that lead to their own research questions to explore;
  • Which psychophysiological measures they have practiced would provide information to help them learn more about their research question;
  • What they want their participants to do;
  • Key issues of experimental and statistical control, and
  • Any other equipment or supplies they might need to arrange for in addition to what is available within the limitations of available apparatus and facilities.

Before they may proceed, beginning students present their thinking on such issues to me as their consultant.

I provide a rubric with many tips, such as noting what they observed during the experiment that could have unintentionally influenced the results, describing strengths and limitations of their conclusions based on their findings, and answering the “So what?” question to extend their findings into their own life and think about the implications such findings might have for them.

See following for more ideas for teaching empirical research skills to help students think as scientists think, with research support:

Thorsheim, H. I. (2015). Experimental psychology. In D. S. Dunn (Ed.), The Oxford Handbook of Undergraduate Psychology Education. New York: Oxford University Press, 387-401. (Focus is.)


Learn more about BIOPAC’s education solutions, including complete teaching systems for psychophysiology and the life sciences. BIOPAC also provides a wide range of research systems for recording, displaying, classifying, and analyzing psychophysiological measurements.

BIOPAC Systems, Inc. provides life science researchers and educators with data acquisition and analysis systems that inspire people and enable greater discovery about life. Visit us at www.biopac.com.

Professor Thorsheim is a licensed Psychologist, educator, and author. He has published or presented over 125 papers, journal articles, books, book chapters or monographs, and received a patent in 1985 as a co-inventor for an educational book design with interactive elements. His work has been funded by marquee foundations across the globe. His most recent work is Doing Psychophysiology: Getting Started, available from Knowledge Growers, Inc., available as an iBook download in 51 countries.

error: Content is protected !!