A Remarkable 2024: Introducing Tools for a Better and Brighter Research Future

As 2024 winds down and we ready the confetti to ring in 2025, we at BIOPAC Systems Inc. want to toot our horn after wrapping up an exciting year of growth and innovation. This year brought some big wins for the research community, thanks to BIOPAC’s efforts to make physiological data acquisition and analysis more accessible and efficient than ever. Two major milestones were the launch of the MP200 system, the latest evolutionary step for our flagship data acquisition platform, and two feature-rich release updates to our AcqKnowledge data acquisition and analysis software.

Introducing the MP200: A New Achievement for Data Acquisition

MP200The MP system series has been the backbone of BIOPAC’s efforts to provide powerful and yet accessible data acquisition tools to researchers. Released in November, the newest incarnation of MP device, the MP200, ushers in a new era of precision, reliability, and flexibility for data acquisition. Designed to meet the evolving needs of researchers, the MP200 offers unparalleled scalability and compatibility with a wide range of physiological signals and measurements. Key enhancements include the following:

  • Enhanced Signal Quality: The MP200 uses advanced signal processing algorithms to ensure superior data integrity across diverse research applications, from neuroscience to exercise physiology.
  • Modular Design: The MP200’s modular architecture allows seamless integration with BIOPAC’s extensive sensors and amplifiers, creating near-limitless customization possibilities for complex experimental setups.
  • Future-Ready Connectivity: The MP200 facilitates real-time collaboration and analysis with high-speed data transfer protocols and cloud integration support.

Researchers will benefit from the MP200’s improved ability to streamline workflows and deliver insights with unmatched precision. This latest system exemplifies BIOPAC’s dedication to fostering groundbreaking discoveries in physiology and related fields.

AcqKnowledge Updates: Pioneering the Future of Data Analysis

AcqKnowledge data acquisition and analysis software has been a go-to tool for researchers for decades, and 2024 saw two major updates that brought exponential improvements: versions 5.0.10 and 6.0.0. These updates are packed with features that make data collection and analysis easier and more comprehensive.

One of the most impactful new licensed features is the integration of Lab Streaming Layer (LSL). This feature lets researchers sync and stream data from multiple sources in real time. Whether one is working on interdisciplinary projects or using several devices at once, LSL makes it simple to bring everything together for analysis. LSL also opens the door to a host of new products from our partners for which BIOPAC has added integration in AcqKnowledge. These include the Axon-R brain-computer interface (BCI) hub with augmented reality (AR) and artificial intelligence (AI) and the APEX wearable, wireless EEG system. Other new products have also been integrated into AcqKnowledge and are now available from BIOPAC, including new eye tracking products from Tobii and EyeLogic.

Another game-changing licensed addition, AcqKnowledge Cloud, allows users to securely store their data online, streamlining processes to access, share, and work on data from any location. Collaboration between teams is also easier, and users no longer need to worry about managing large files on their local system.

These updates are all about making work less complicated and more effective for researchers. With tools like these, diving into complex data, finding patterns, and pushing one’s research further has never been more straightforward.

Looking Ahead to 2025

More excitement is on the horizon for BIOPAC. Not only are several new product updates and releases in the works, but we will also be hosting our bi-annual 4T Human Physiology Conference on Tools, Trends, Techniques, and Technologies. Customers, educators, researchers, and other experts in Physiology and related fields will gather in Santa Barbara, California July 14-16. Participants will share knowledge, take part in hands-on workshops, and see what is shaping the future of research. Learn more and sign up today. Hopefully, we will be seeing you in 2025.


Noise Proof: Attack Artifacts Before They Ruin Data

After investing months of time, funds, and personal effort into your electrodermal activity (EDA) study, you begin combing through your data recordings when something catches your eye. Several of the recorded signals don’t look quite right. Rather than a narrow baseline in the signal graph, the baseline is thick and fuzzy, a sure sign of signal noise. To make matters worse, the recordings are broken by random peaks, artifacts unrelated to the EDA signal you sought to record. Noise and artifacts can corrupt research data, often rendering it useless. While it may be possible in some cases to clean up and salvage recorded data, such results often mean going back to square one and starting over.

The best option is to avoid bad data from the beginning. Several best practices can save researchers untold effort and expense by avoiding the pitfalls that can result in noise and artifacts. Noise and artifacts can be defined as unwanted changes to a signal caused by sources other than the target signal during recording. Noise and artifacts can originate from a range of sources—environmental (interference from other electromagnetic sources) or biological (signal changes from muscle activity in a participant), to name a few. The key is not to wait until all your data is recorded to tackle signal problems. Careful planning and testing procedures when designing and experimenting can avoid later headaches.

Most artifacts are caused by some form of electrical impedance interfering with a clean connection between the participant and the electrodes linking the data-gathering equipment. Sources could include dead skin or hair at the connection sight, dirty or improperly prepared electrodes, or electrodes that have come loose due to movement.

Using an impedance detector can help identify problematic signals before they corrupt data. An example of this can be found in a 2020 study at Ghent University in Belgium that examined how expert and novice map readers managed their cognitive loads using electroencephalogram (EEG) and eye tracking data. Researchers used a BIOPAC EL-CHECK impedance detector to ensure a good skin-electrode interface before recording data with AcqKnowledge software. This allowed the research team to keep the whole EEG circuit (ground, active EEG, and reference electrodes) at less than the recommended 10 K ohms (Herman, 2015; Teplan, 2002) to prevent unwanted signal noise.

noise checkStrategies for avoiding artifacts can vary depending on the type of signal being recorded. Some signals, such as EEG, may require light abrading of the skin at the point of electrode attachment for optimal conductance, while other signals, like EDA, do not require skin abrasion. Proper site preparation is recommended for most signals, skin should be clean and free of obstructions, such as excess hair. When gel is to be applied, make sure it is the correct type for the electrodes being used. Finally, the preparation of study participants can be critical to successfully recording clean data. In general, participants should be in an environment that is free of distractions and stimuli originating outside the study (sudden noises, distracting conversations, etc.).

For detailed information on how to proactively prevent signal noise and artifacts, check our AcqKnowledge Bootcamp webinar in which we discuss how to set up experiments to ensure quality data gathering. You can also consult our forthcoming guide with detailed instructions for the collection of optimal data.  Don’t wait until it’s too late; eliminating signal noise should be the first step in setting up a successful study.


Do you need help eliminating artifacts and signal noise in your recorded research data? BIOPAC’s regional sales representatives are ready to assist with tools and strategies to ensure you get only the best data possible. Contact us today!

Faster, Stronger, Further—Unlocking the Body’s Potential with Exercise Physiology

Every athlete seeks the winning formula that will make them more competitive. Add coaches, trainers, weekend warriors, and everyday health enthusiasts to the mix, all looking for an edge to improve fitness, shorten recovery times, and avoid injuries. Exercise physiology plays a key role in gaining such advantages and insights.

Exercise physiology encompasses the scientific study of how the body responds and adapts to exercise and physical activity. It covers a wide spectrum of systems including the cardiovascular, respiratory, and musculoskeletal as well as metabolic function and overall performance. Today’s exercise physiologists benefit from a range of tools and techniques to measure, collect, and analyze such responses and acquire a better understanding of the ways in which exercise affects both humans and other animals, including solutions that integrate the latest virtual reality and eye tracking technology.

This type of research is not without its challenges. Study participants are often required to be physically active during data acquisition. The tools employed in such instances must allow participants to move freely without introducing signal artifacts or noise into the data. A 2021 study into the physiological progression of fatigue shows how researchers can resolve such problems by employing wireless devices such as BIOPAC mobile EMG amplifiers, used in this case to measure strain to the biceps and triceps during exercise. Researchers successfully gathered a range of EMG data with no negative effects from the physical exertion of the study participants.heavy lifting

Exercise physiology research has also been applied to the treatment and management of exercise- and sports-related injuries, both acute and chronic. Additionally, studies have investigated the connection between physical activity and pathology, revealing new ways to prevent or reduce the progress of certain diseases.

A 2020 study by researchers at the University of Udine examined the effects of both exercise alone and exercise combined with a high-protein diet on patients with late-onset Pompe disease, a neuromuscular disorder that degrades a person’s tolerance to physical activity. The study explored which routine had the greatest impact, if any, on a patient’s exercise tolerance, muscle and pulmonary functions, and quality of life. A BIOPAC isometric dynamometer measured muscle force generated by the right leg and arm during flex and extension tests. Data gathered with a BIOPAC data acquisition and analysis system running AcqKnowledge software demonstrated that the combination of exercise and a high-protein diet did improve exercise tolerance, muscle enzymes, pulmonary function, and quality of life for the patients.

Exercise physiology research also sheds light on the ways in which exercise impacts mental and physical wellness. A study published at the Ho Chi Minh University of Technology used heart rate variability (HRV) to evaluate the influence of stress, both physical and mental, on the performance of stationary bike trainees. During the experiment, electrocardiogram (ECG) signal data was gathered from participants using an MP36 data acquisition unit running Biopac Student Lab (BSL) software over a two-month exercise regimen. Based on the results of the study, researchers concluded that HRV provided a useful window into how stress impacts performance and that HRV data could be used as a management tool to monitor stress levels during training.

The techniques and tools available to today’s exercise physiology researchers are as diverse and varied as the areas in which they are being employed, from athletic performance monitoring and enhancement to wellness studies. For more information on how such tools can benefit your exercise physiology research, watch BIOPAC’s webinar on Recording Great Data from Exercising and Mobile Subjects.


Our regional BIOPAC sales reps are ready to help you find the right tools to design your next exercise physiology study. Contact them today to learn more.

Eye-Catching: Mobile Tech Enhances Immersive Experiments

Freed from the limitations of stationary eye tracking technology, mobile eye tracking enables researchers to study their subjects while they perform a wide range of immersive tasks in natural settings.

Sixteenth-century pediatrician Thomas Phaer mused that “the eyes are the windows to the soul.” These sensory organs and their movements certainly provide a wealth of information to researchers studying the interaction of mind and body. Eye tracking has long been a key tool of physiological and psychophysiological research, and recent developments in mobile eye tracking take this valuable data resource out of the confines of the lab and into the real world.

Freed from the limitations of stationary eye tracking technology, mobile eye tracking enables researchers to study participants while they perform a wide range of immersive tasks in natural settings. These self-contained devices come in a variety of form factors including wearable glasses that provide untethered eye tracking data acquisition in real time that can be combined with other physiological data collected during live experiments.

Today’s lightweight mobile devices can record a broad spectrum of eye tracking data, including pupil size and position, gaze path, vergence angle, and areas of interest (AOI). The latter connects stimuli to eye-movement metrics, providing data on the participant’s psychophysiological response to stimuli within their field of vision. In previous blog posts and webinars, we have explored how mobile eye tracking technology gathers this data. Numerous studies have been published that demonstrate its potential in physiological and psychophysiological research. Settings and applications include user experience, sports and physical therapy, public safety and law enforcement, driving and equipment operation, and work environments from the office to the factory floor.

Mobile eye tracking technology allowed researchers at The University of Sheffield to take their experiments to the city streets for a 2020 study into how different lighting affects cyclists navigating urban environments at night. Mobile eye tracking provided data on the gaze behavior of nocturnal cyclists in parallel with skin conductance response (SCR) to better understand how obstacle detection is influenced by variations in type, location, and level of lighting. Bicycles and their riders were equipped with a BIOPAC data acquisition unit and audio stimulation units along with a BioNomadix EDA transmitter and electrodes to record the participants’ SCR. Eye tracking data, including AOI, were synchronized with SCR data and analyzed using AcqKnowledge software to determine how the riders reacted to a variety of lighting conditions. Researchers concluded that lighting plays a significant role in riders’ comfort levels at night and that improved lighting could increase urban bicycle use.

VGM playerLess intrusive by design, mobile eye tracking can provide indoor experiments with a heightened degree of immersion. A study at the University of British Columbia used mobile eye tracking glasses to create a more natural environment to investigate how the immersive effects of electronic gaming machines (EGM) impact gambling addiction. The study looked at how machine design triggered psychophysiological responses in participants by assigning various AOI to EGM screens. ECG data were recorded along with respiration effort via a BIOPAC respiration effort transducer and amplifier, which were fed to a data acquisition unit and synchronized with AOI data recorded via mobile eye tracking glasses. The study was able to successfully identify several key markers for game immersion using AOI that suggest behavioral links between immersion and gambling addiction.

Possible applications for mobile eye tracking in research continue to expand with the evolution of the technology. To learn more about recent developments in mobile eye tracking, check out our latest webinar on mobile eye tracking glasses with AcqKnowledge integration.


Learn more about how to integrate mobile eye tracking into your next research project by contacting your local BIOPAC sales representative.

Workflow: Research Smarter with Automated Routines

You have probably heard the saying “why work harder when you can work smarter?” While this may seem like a cliché, there is no denying that smart work, or what might be more accurately termed “efficient effort,” not only alleviates worker stress but in doing so minimizes human error while creating opportunities for increased productivity and creativity.

In an earlier post on lab automation, we discussed how increased workloads and human error have contributed to a crisis of reproducibility and repeatability in the research community. To summarize, repeatability and reproducibility provide the foundation upon which the scientific method is built. The results of academic research only retain value for the wider scientific community when the conditions that produce such results can be repeated and shared amongst other researchers.

There are several best practices that can contribute to ensuring repeatability and reproducibility of research by maintaining the conditions under which lab work is conducted. These include, among other factors, consistency in the location or research environments, the tools used for measurement as well as other equipment used in experiments, and the routines and processes used to gather and analyze data.

As discussed in the previous blog post, automation of data gathering and analysis has been one of the best ways to ensure consistency and repeatability while helping to eliminate human error, as outlined in a 2019 article on improving reproducibility in synthetic biology through automation:

“The successful implementation of automation technology can help to improve both the throughput and reproducibility of experiments, although the high cost and lack of flexibility of traditional lab automation has so far hindered their wide-spread adoption in academia. Recently though, there have been advances in automation technology that, when combined with new protocol sharing methods and protocol management systems, may allow for researchers to gain the benefits of automation.”

—Jessop-Fabre and Sonnenschein

Before when discussing how to automate routines for data acquisition and analysis, the focus has been on the use of scripts to string together processes. While this achieves the goal of creating laboratory conditions that are more readily repeatable, scripting requires a specific skill set. This brings us back to the notion of working smarter, not harder.Plan Smart

Previous versions of BIOPAC’s own AcqKnowledge data gathering and analysis software offered a powerful Scripting tool as an add-on licensed feature. The latest version of AcqKnowledge supports a new licensed feature with Scripting called Workflow. Workflow takes all the functionality of scripts and places it in an easy-to-use, drag-and-drop interface that requires no prior scripting knowledge.

Workflow is the embodiment of the “work smarter, not harder” philosophy, allowing users to create automated routines to process and analyze data under consistent and repeatable conditions. By speeding signal conditioning and preparation for analysis, Workflow boosts efficiency. The ability to save and share workflows makes it easier for colleagues and reviewers to replicate research conditions. BIOPAC CEO, Frazer Findlay hosted a recent webinar in which he provided a detailed introduction to creating automated routines with Workflow.


For additional information on the latest version of BIOPAC’s AcqKnowledge software as well as other research tools and how they can help streamline your lab work, contact your local sales representative.

Balancing Act: HRV Provides Critical Marker for Psychophysiological Health

Two college wrestlers square off on the mat awaiting the signal that will begin their match. To the casual observer, the outcome seems impossible to predict. Their coach, however, knows one competitor has a clear advantage—a heart rate variability level (HRV) that is higher than his opponent’s. Examining HRV data provides more than insight into athletic performance, it offers a window into a broad spectrum of functions that influence psychophysiological health.

HRV balanceIn simple terms, HRV is the natural variation in the intervals between each heartbeat over time. Unlike a ticking clock, our hearts do not beat at a constant rate. As such, variations in heart rate can provide a wide range of valuable information on our bodily systems. This is because HRV represents a balancing act between our sympathetic and parasympathetic nervous systems, which together make up the autonomic nervous system. As we have discussed in previous posts, the autonomic nervous system controls nearly all the body’s involuntary functions.

The sympathetic nervous system is activated in times of stress or danger (i.e., the fight-or-flight response), during which our bodies sweat, our heart rates increase, and the interval between beats decreases. Conversely, the parasympathetic nervous system acts as a sort of switch, shutting down the sympathetic nervous system and activating a relaxed state (i.e., rest and digest). To do this, it releases acetylcholine, a neurotransmitter that makes the heart beat slower and at greater intervals.

When these two systems are in balance, they produce higher HRV through a more variable heart rate. Greater variability has been associated with the body’s ability to switch between these systems. Thus, HRV is used as a health marker, such that high HRV is associated with better cardiovascular health, mental focus, emotional health, stress management, and ability to recover from exercise, while low HRV is associated with inflammation, chronic fatigue, increased stress, depression, and chronic pain.

HRV has also been connected to willpower and is a predictor of persistence and self-control. HRV increases during periods of self-regulation sometimes called the “pause and plan response.” As such, HRV has been particularly useful in research into the mechanism associated with addiction. A 2019 study used HRV to explore how chronic pain patients treated with opioids could regulate drug cravings and depression through dispositional mindfulness. Electrocardiogram (ECG) data were sampled with a BIOPAC data acquisition unit while HRV was calculated with AcqKnowledge software.HRV chart

Because HRV plays such a critical role in physical and psychological health, several studies have investigated how to self-regulate HRV, including examining how it is affected by posture. A 2020 study used a  2-channel BSL data acquisition unit to gather ECG data to calculate HRV for a variety of bodily positions to determine their impact.

A similar study examined the link between HRV and resilience, i.e., the individual’s ability to return to stable physical and psychological equilibrium after experiencing stress. HRV calculations were made from data gathered via a BIOPAC ECG100C ECG amplifier, RSP100C respiratory amplifier, and EDA/GSR amplifier. The study identified possible trends connecting resilience factors and HRV levels during specific stress-inducing simulations.

Calculating HRV with BIOPAC hardware and software solutions provides researchers with a myriad of psychophysiological insights for their lab work. Learn more about HRV from our Knowledge Base entry, as well as application notes on data preparation for analysis and statistical and geometric measures.


For additional information on how BIOPAC can assist you with a wide range of research and educational applications, contact your local sales representative.


‘Tis the Season for Stress: Research Tools for Anxious Times

Holiday-related stress is as much of a seasonal tradition as family gatherings, frantic shopping forays, and over-indulgence in food and drink. Add to this potent mixture nearly two years of pandemic-induced tension and we have a volatile cocktail of emotions and anxiety awaiting us in November and December. What better time to study the causes and effects of stress?

Research has established strong links between stress and our moods and sense of well-being, not to mention overall mental and physical health. While certain types of stress during development can teach individuals to adapt to life’s many challenges, excessive and prolonged stress is shown to contribute to chronic disease and a range of psychological disorders. According to the American Psychological Association, which conducts an annual survey monitoring stress, the COVID pandemic has had an unprecedented impact on stress levels across all demographics, particularly among young people.

The pandemic is just one of many factors driving demand for new approaches to stress research. Thankfully, researchers now have access to a myriad of technologies to support any experiment design. In a recent webinar on techniques for measuring physiological changes related to stress, BIOPAC head of European Sales, Alex Dimov, outlined a range of stress-connected physiological responses that can be measured in the lab with available technologies. These include heart rate, heart rate variability (HRV), trans-radial-ulnar electrical bioimpedance velocimetry (TREV), cardiac output, blood pressure, EDA, pulse, respiration, EMG, EEG, and functional near infrared spectroscopy (fNIRS).

One of the challenges of measuring stress in a natural environment is finding the right data gathering tools to support the mobility of test participants. A 2019 study tackled this by examining a variety of techniques for measuring stress in day-to-day life using mobile phones and wearable sensors. Settings included the lab, automobile, office, school, and other daily life locations. Along with consumer products like smartphones, smartwatches, and fitness bands, researchers also employed wearable sensors, including the BioNomadix wireless PPG transmitter to measure blood volume pulse (BVP) using a photo plethysmogram (PPG) signal. Researchers found that the BIOPAC device provided a high level of accuracy (80%) when employed outside of the traditional lab environment.

Smelling RosesStress research technologies are not limited to data gathering. Stimulus presentation tools offer researchers options for both inducing and alleviating stress in the lab. A 2019 University of Wisconsin study investigating the role scents can play in reducing stress utilized EDA, heart rate, and respiratory rate to measure how rose scent reduced anxiety among students taking a difficult test. Respiratory rate was measured using a BIOPAC respiratory transducer while EDA data was collected with an EDA finger transducer. Data was collected and analyzed via the Biopac Student Lab System. While rose scent was delivered using scented lotion, it should be noted that BIOPAC offers a new modular scent delivery system that is capable of delivering up to eight scents per experiment, with more than 120 scent options.
With so many data gathering tools available, planning your next experiment should not leave you feeling on edge. Let your BIOPAC sales rep help you take the stress out of stress research.


BIOPAC offers a wide array of wired and wireless equipment that can be used in your research. To find more information on solutions for recording and analyzing signals such as ECG, heart rate, respiration, and more using any platforms mentioned in this blog post, you can visit the individual application pages on the BIOPAC website.

Hitting the Mark: Using Event Markers to Improve Data Quality

Life is a series of events—some are planned while others catch us completely by surprise. This holds true in the lab where the quality of experiments and data depend on accurately identifying, tracking, and sorting key events as they occur. Events like the introduction of stimuli and a test subject’s reaction directly impact data.

Life is a series of events—some are planned while others catch us completely by surprise. This holds true in the lab where the quality of experiments and data depend on accurately identifying, tracking, and sorting key events as they occur. Events like the introduction of stimuli and a test participant reaction directly impact data. Similarly, unplanned events, such as when a participant coughs or sneezes during a respiratory experiment, can affect overall data quality.

In this context, we define an “event” as piece of information associated with a specific time in a waveform. An event can capture points of interest within a file (e.g., subject moved, dose added) or on a particular channel (e.g., T-wave onset).

Whether intentional or not, critical events need to be easily located and identified by those running an experiment. Event marking provides the key to this by helping researchers eliminate outlier data while making it possible to locate data that is significant to the experiment. Today’s researchers benefit from data acquisition software that offers some form of event marking functionality to easily identify, label, and categorize such events. BIOPAC’s latest build of AcqKnowledge, for example, integrates extremely easy-to-use event marking tools that enable users to mark “quick events” with a simple tap of a function/hotkey for 17 different event categories, each containing multiple types of events.

“I’m struggling to think of any time you wouldn’t be using these,” said BIOPAC Technical Support Manager David Pollock as part of the recent webinar AcqKnowledge Bootcamp: Set Up Experiments to Facilitate Data Analysis. “They are critical to being able to interpret your data after you acquire it.”

The benefits of event markers include:

  • Allowing researchers to differentiate stages of an experiment
  • Making it easy to eliminate outlier data
  • Allowing researchers to track and identify stimuli
  • Providing control over event tracking, thus eliminating errors
A Tale of Two Studies

A pair of recent studies illustrate how data acquisition software like AcqKnowledge can streamline event marking. The first sought to test the viability of various commercial-off-the-shelf ECG sensors for monitoring stress levels in participants. Test participants used a manual button to self-mark stress events triggered by mental arithmetic tasks, startle response tests, and a cold-water response test. A BIOPAC MP Research System data acquisition unit provided a clinical baseline for comparison with the pair of COTS ECG monitors. The limitations of self-reported events were revealed when participants were found to have accidentally activated the stress “clicker” about 60% of the time.

Physiological Data in Military StudyA similar 2018 John Hopkins University study avoided this problem through both automated and researcher-controlled event marking. When examining how military commanders maintain combat effectiveness while responding to a range of potentially stressful battlefield situations, researchers employed AcqKnowledge to record event marks at the onset and offset of various stimuli. Physiological data was fed to an AcqKnowledge-equipped computer via a BIOPAC DAQ connected to an STP100C digital interface module. Event markers generated by both AcqKnowledge and E-Prime allowed researchers to easily identify stimuli as well as each task the participants performed by name, start time, end time, and duration.

Not leveraging the power of event marking tools can result in key experimental events being lost in a flood of data, potentially corrupting results. Check out this video tutorial to learn more about event marking with AcqKnowledge.

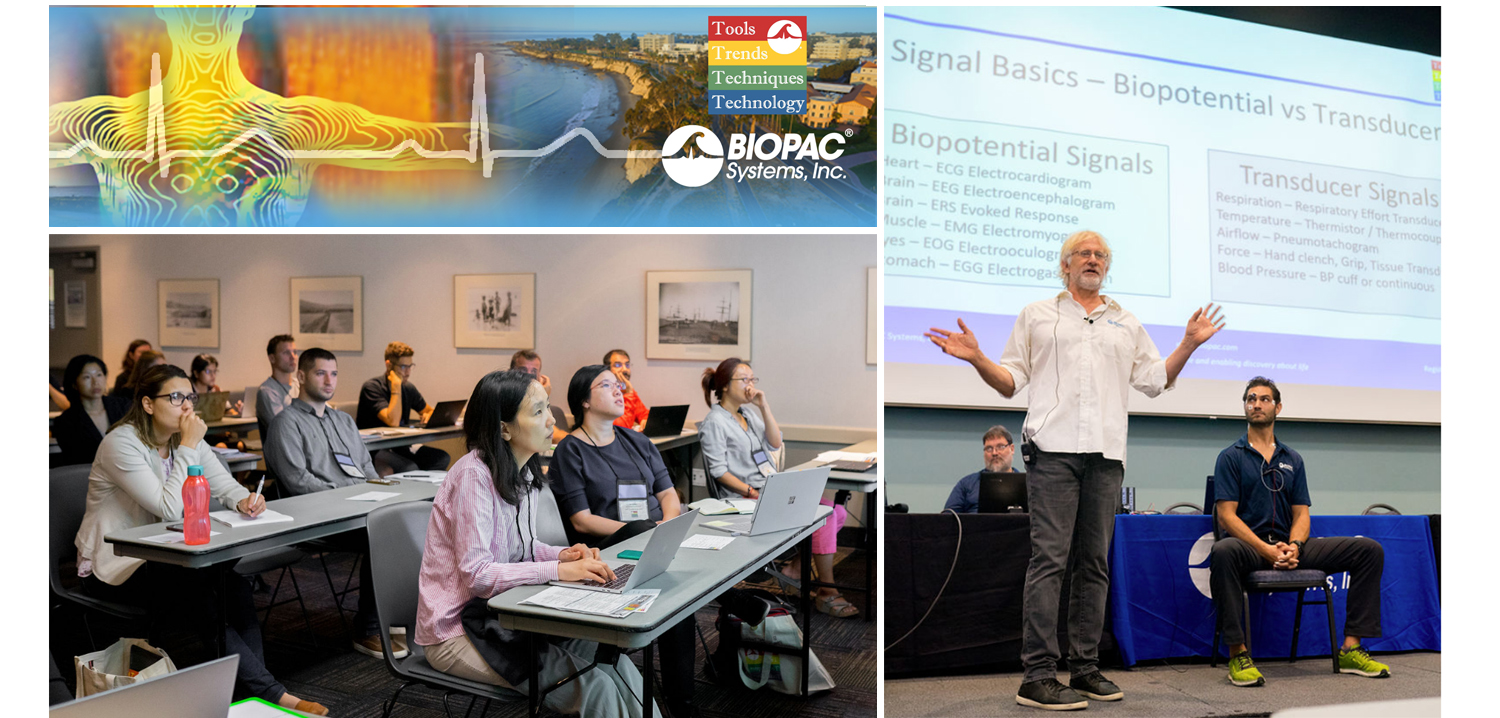
T4 Conference Wrap-up

August is a month of barbecues, baseball, and last-minute vacations against the backdrop of a fading summer, and the eighth month of 2019 proved to be an equally exciting time at BIOPAC, with something of a pleasant vacation thrown in. On August 12-14, BIOPAC hosted its 2nd Biennial “Tools, Trends, Techniques, and Technology” Human Physiology Conference, known as “T4” to our friends and partners around the world. This three-day event, first held in 2017, featured lively, informative sessions hosted by BIOPAC staff, partners, noted academics, and industry experts, and covered a wide range of physiological techniques and disciplines. Over 150 attendees joined BIOPAC at the 2019 T4 Conference staged once again at the beautiful University of California at Santa Barbara campus. Participants and instructors winged in from China, Australia, Germany, Sweden, Italy, Spain, U.K., Ireland, and Egypt, as well as from wide regions of the U.S and Canada to soak up the idyllic surroundings of this ocean-side campus.

The focus of BIOPAC’s T4 Conference was to provide a fun, relaxed environment while hosting nearly 40 hands-on, human physiology training workshops chaired by over 20 distinguished instructors from around the globe. One of the many conference highlights was the “Mindfulness, Meditation, and Measurement: Mindfulness Exercises in Physiological Monitoring” session, hosted by Dr. Allan Weiss of the University of Southern California and  BIOPAC Co-founder and Director of R & D Alan Macy. These sessions, conducted in two parts over a two day period were booked beyond capacity, even though the early morning fog hadn’t yet lifted from the campus skyline.

The varied additional sessions covered a range from the basics, “Setting Up Your Lab, Getting Great Data and Troubleshooting,” (hosted by Dr. Terry Blumenthal of Wake Forest University, and BIOPAC’s Alan Macy and Tim Cook), and “Creating Your Own Lessons Using BSL PRO,” (hosted by Dr. Taffeta Elliot of the New Mexico Institute of Mining and Technology), to exciting new technologies such as “Integrating Screen-based Eye Trackers with AcqKnowledge,” with Keith Jackson of BIOPAC partner company EyeTech, BIOPAC CEO Frazer Findlay, and BIOPAC Engineering Manager Ed Peterlin. Additional wide-ranging physiological disciplines were also covered, including MRI techniques, stimulation, and exercise physiology. All sessions were conducted using BIOPAC hardware and software systems, as well as platforms provided by BIOPAC partners such as Cedrus, fNIR, WorldViz, Psychology Software Tools, and CNSystems. At the end of each day, it was time to relax and unwind with a beverage of choice, a a walk along the beach, and some good conversation. Each evening featured excellent meals and camaraderie in the relaxed yet elegant environment of some of Santa Barbara and Goleta’s most stunning surroundings. After three great days of immersive sessions, it came time for everyone to part ways, having forged new collaborative partnerships and an enhanced knowledge about the full potential of BIOPAC and BIOPAC partner products.

You don’t have to wait for T4 2021 to learn more about life science data—watch Fundamentals of Physiological Data Recording now!

For a closer look at T4, and a preview of what is sure to be an exciting 2021 event, we invite you to visit our T4 Human Physiology Conference page.

Looking for additional resources, tips, tricks, and expert advice on BIOPAC and BIOPAC Partner products? Please also visit our Webinars and Video Tutorial pages.


BIOPAC offers a wide array of wired and wireless equipment that can be used in your research. To find more information on solutions for recording and analyzing signals such as ECG, heart rate, respiration and more using any platforms mentioned in this blog post, you can visit the individual application pages on the BIOPAC website.

Best Practices for Recording & Analyzing Data

Over the past several years, tools and techniques for recording and analyzing physiological data recording have seen steady and marked improvement. Modern life science data acquisition systems such as the MP160 System and powerful research-grade software suites such as AcqKnowledge bring high-end physiology tools within reach of the smallest lab. Even with continuing advances and reduced margin for error, it remains prudent to follow some fundamental guidelines for maximizing data quality and clarity.

Preparation is important. First, invest time exploring the system if it’s new or unfamiliar. An overview of the documentation, training videos, and available webinars, as well as some practice runs with the hardware and software will save time and effort when the time comes to conduct a study. This will also build proficiency at identifying the differences between good and poor data.

Next, familiarize yourself with the type of electrodes and/or transducers necessary for the physiological signals you will be acquiring, which includes proper electrode and skin site preparation. For example, gently abrading the skin prior to applying electrodes is normally recommended for most signal types, except for electrodermal activity (EDA), in which case it’s vital to NOT abrade the skin beforehand. It is also helpful to wait at least 5 minutes before starting a recording, which enables the electrode gel to be absorbed into the skin, helping reduce the impedance.

Performing an impedance check to ensure that the electrodes are making good contact with the skin is also highly recommended. This task is made easier by using an Electrode Impedance Checker (such as EL-CHECK), a simple device for quickly measuring the resistance between the skin and the electrode that provides an LED readout of the skin/electrode contact quality. If the resistance is too high (indicating poor contact) proper adjustments can be made before starting an experiment.

For certain signal types, excessive participant movement can introduce unwanted artifact into the signal, resulting in poor or skewed data. Make sure the participant remains as still as possible during studies involving these signals. Using tape to attach the electrode leads to the skin and keep them from moving excessively can also be helpful.

A thorough check of the system and all connections, cameras, and other hardware is important, so that any problems with equipment or setup can be addressed in advance, thus avoiding a show-stopping issue in the midst of an experiment. This would include performing a pilot study with trained personnel in order to head off any unforeseen issues with the data collection.

Creating a lab setup conducive to a relaxed environment for the participant and technician alike will yield better results. This means eliminating clutter, noise, and other distractions that can affect comfort and attention span. Some labs even avoid having their staff wear lab coats because this can heighten participant nervousness.

Keeping detailed notes on successful lab setups is also helpful and will streamline the preparation process for future experiments. Additionally, creating and saving graph templates for regularly-repeated experiments will save further time and effort.

For more about the fundamentals of recording great data, we invite you to view this free on-demand webinar Fundamentals of Physiology Recording.


BIOPAC offers a wide array of wired and wireless equipment that can be used in your research. To find more information on solutions for recording and analyzing signals such as ECG, heart rate, respiration and more using any platforms mentioned in this blog post, you can visit the individual application pages on the BIOPAC website.

Photo by John Schnobrich on Unsplash

error: Content is protected !!