Put a Ring on It: Wearables Offer New Research Options

Rings, watches, bracelets, and belts—we think of them as indispensable fashion accessories. A bit of bling can put the finishing touch on an outfit for a night on the town, but what about a day in the lab? Wearable technology is transforming the landscape of physiology research by enabling real-time, noninvasive data collection in a variety of settings.

For many, their first introduction to the potential of wearable physiology technology came through smartwatches and fitness bracelets. These consumer electronics offer a convenient and affordable way for anyone from professional athletes to fitness hobbyists to monitor their health data, which often includes pulse, blood oxygen levels, steps, and other basic physiological signals.

As the underlying technology has become more sophisticated, researchers have embraced the convenience offered by such devices. Portable, unobtrusive, and wireless wearables have entered the research device market and now allow a range of signals to be monitored under a variety of circumstances and environments.

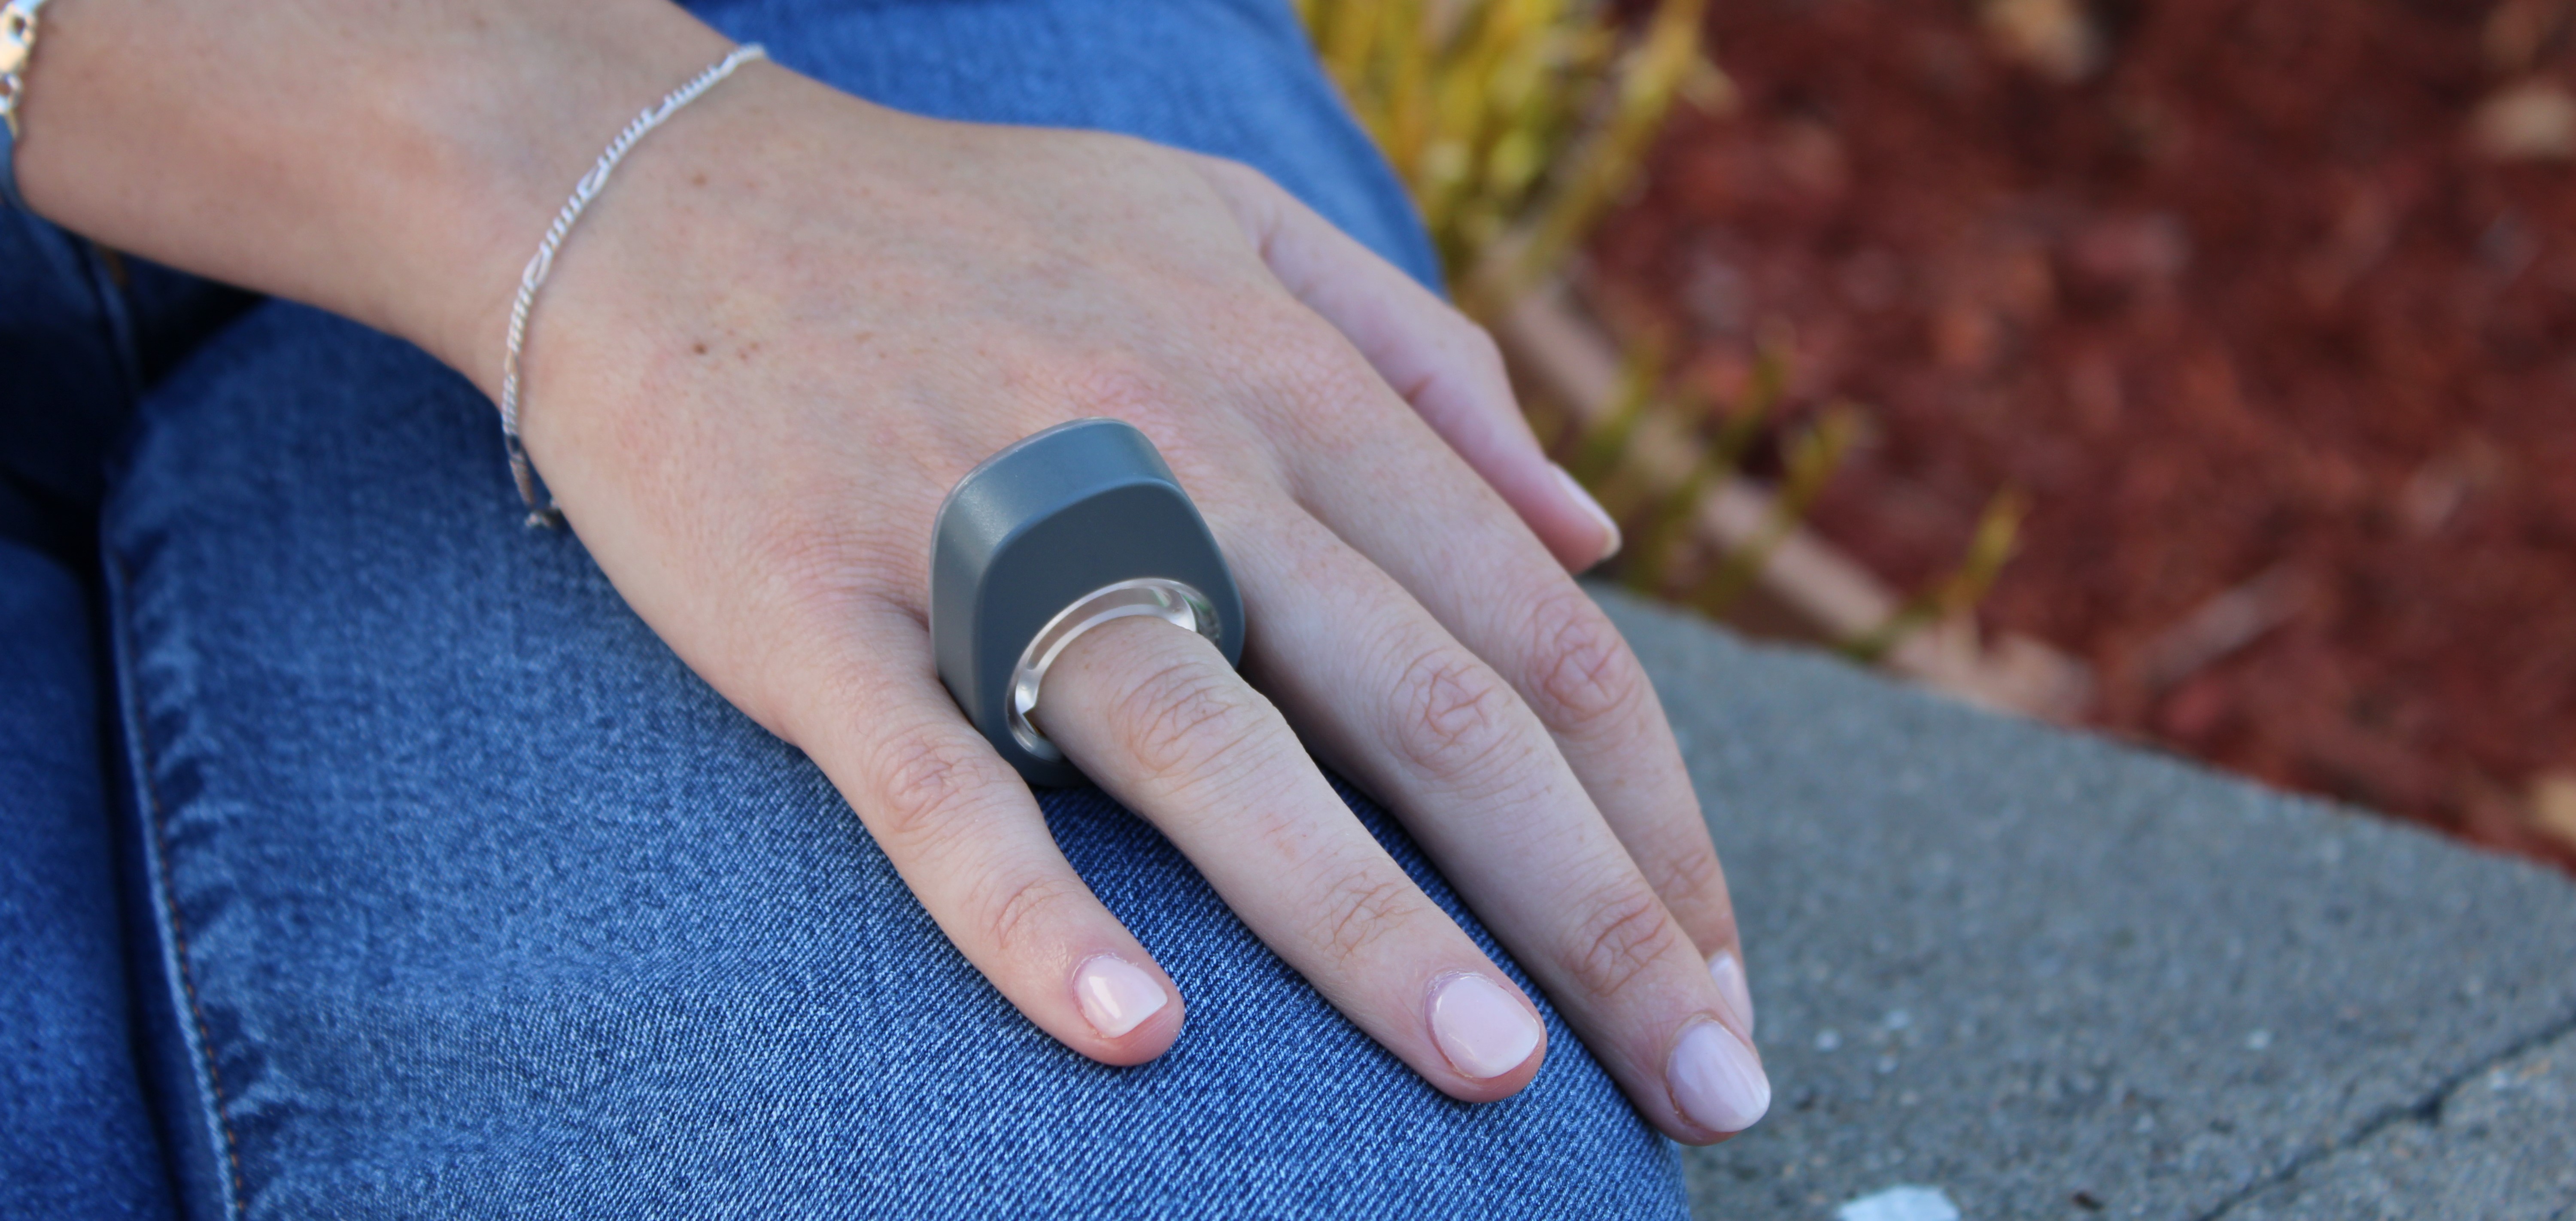
smartphoneBIOPAC recently expanded its established line of wireless devices by introducing the Research Ring, a wearable device with a specific focus on physiological signals such as Photoplethysmography (PPG), Electrodermal Activity (EDA), Electrocardiography (ECG), and body temperature. Products like the Research Ring allow the capture of high-quality data via an unintrusive and accessible wearable device, making them ideal for a wide range of potential applications. These include psychophysiology research, sports and exercise studies, sleep and stress research, and aging and wellness studies, to name just a few.

BIOPAC is no newcomer to providing the research and education communities with wireless and portable solutions designed for gathering physiological data. The Bionomadix line of wearable remote monitoring devices set the standard for such products and have been used in thousands of cited studies. For example, researchers conducting a study of on-the-job stress among healthcare professionals collected EDA and PPG signals using a BIOPAC wireless PPG and EDA amplifier and a wireless respiration with ECG amplifier. Wireless technology proved to be a key component of the study’s success as it allowed the data to be gathered without interfering with the immersive quality of the simulated work environment.

A team of researchers from the University of Porto in Portugal utilized a BIOPAC wearable physiological signal logger to collect EDA and ECG data while studying the correlation between physiological signals and expressive writing. In the study, published in the journal Experimental Psychology, participants were able to engage in writing exercises without the distraction of more cumbersome and intrusive wired solutions.

BIOPAC’s latest entry into its line of wearable wireless data collection devices promises to add greater convenience and versatility to this burgeoning sector. For more information on the new Research Ring, check out the recent webinar BIOPAC hosted with ring developer and partner, Senstream.


If you are interested in adding wearable devices to your next physiology study, reach out to your regional sales representative today to learn which BIOPAC wireless solutions are right for you.

Human Factors: Physiological Signals Enhance Ergonomics Research

Ergonomics plays a role in almost every aspect of human interaction with the world around us—how we work, entertain ourselves, rest, and relax. Simply put, ergonomics (sometimes termed “human factors and ergonomics” or simply “human factors”) refers to the way in which physiological and psychological principles are applied to design, particularly in ways that benefit a user’s physical and psychological well-being and productivity.

In practice, ergonomics addresses more than our physical interactions but also encompasses our mental, emotional, and interpersonal states. What unites these different applications of ergonomic theory is that they can be studied and better understood with many of the same tools and signals applied in other areas of physiological and psychophysiological research. These can include ECG, EOG, fNIRS, EEG, and EMG, to name just a few.

Ergonomics can be broken down into three primary domains. Physical ergonomics relates to how the body interacts with the physical environment, from the design of tools we use every day to the physical environments in which we live and work. Cognitive ergonomics focuses on how our mental abilities are influenced by the systems and tasks with which we are presented. Organizational ergonomics (also known as macroergonomics) explores how to optimize organizational structures, policies, and processes within various social settings, including work environments.

Eye TrackingOne example of how physiological signals are being applied in physical ergonomics research involves the application of electrooculogram (EOG) signals to analyze eye movements, particularly saccades, as a measurement of eye fatigue caused by exposure to digital screens. The ubiquity of such screens in both our work and recreational environments makes such research critical to maintaining user well-being and productivity. This 2018 study utilized EOG electrodes connected via SS2LB leads to an MP36 data acquisition unit running BSL software to record and analyze EOG signals. Researchers were able to determine the optimal reading and viewing distance to minimize eye fatigue and discomfort, improving user health and productivity.

Cognitive ergonomics come into play when discussing the ease-of-use for a product. This is particularly important when dealing with how less technologically savvy groups interact with new technology, a challenge is explored in a 2019 study into how to develop a home heart monitor that would be easy for older users to operate. The study compared user interaction with device hardware, a mobile app, and a cloud-based software platform while using a BIOPAC research-level system as a control. Researchers created the signal baseline with an ECG amplifier connected to a data acquisition and analysis unit, comparing these results to the quality of the signal the user was able to obtain using the self-administered home devices and applications. This approach accurately assesses both the user-friendliness and quality of data obtained by several telemedicine systems.

These examples offer just a small sample of the ways in which physiological signals are being applied in the study of ergonomics. For an in-depth exploration of the topic, watch our webinar series on Ergonomics and Fatigue.


To learn more about using BIOPAC hardware and software to enhance your ergonomics study or design research, contact your local sales representative.

A Brief Tour of Psychophysiology

Why are we interested in psychophysiological measurements? Which measurements are these exactly? By “measurements,” we are talking about micro-facial expressions, pupil dilation, peristaltic contractions of the intestines, heart activity, breathing patterns, electrodermal activity, and other responses not visibly apparent.

In the 1880s, an English philosopher named William James was among the first to explore what constitutes an “emotion.” James believed that everything, big and small, that happens to us and around us elicits a constant stream of feelings and responses. These responses can range from indifference, fear, excitement, happiness, stress—virtually the full gamut of the human emotional palette.

Why does this happen and how do we measure it?

There is always a response in our bodies as a consequence of input delivered via our senses, and there is a resulting “feeling” that happens. Sometimes the feeling doesn’t have much impact but at other times, its effect is profound. The term “emotion” is the label that we assign to these feelings. These feelings result in a response that affects our physiology. These physiological responses to ongoing events are objectively measurable and referred to as “affect.”

Data enters the brain via our senses, but it takes a small period of time to process the input; about 50 milliseconds if the event is a sound, and 100 milliseconds if visual. When data comes in, it travels through various neural pathways and our response to it is informed by our previous experiences. An extreme example to external input causing profound affective changes would be in someone with post-traumatic stress disorder (PTSD), in which certain sounds, or other situational input can trigger pronounced panic or discomfort. People with phobias (for example, fear of cats) will exhibit physiological changes far out of proportion to the actual danger posed by the perceived input. Someone who loves cats would undoubtedly experience a warm fuzzy feeling, whereas a person with a cat phobia would be panicked, resulting in dramatic and measurable changes in heart rate, respiration, and eccrine activity (skin sweating).

An evolutionary motivation baked in to our consciousness is the “fight or flight” response, in which we respond to danger and make a quick decision whether to run or defend ourselves. We all have different thresholds for which input might trigger this response. The line is often blurred between what constitutes actual danger or a seemingly innocuous sensory event that ignites an unpleasant memory or triggers the ghost of a previous traumatic experience.

Now that we have briefly explored a thumbnail sketch of psychophysiology, what kind of equipment is used for recording psychophysiological data? When we set up a psychophysiology experiment, we can record the changes occurring in the body and analyze the results with a great depth of accuracy. To record these signals, specific data acquisition hardware such as the BIOPAC MP36 is commonly used, with a SS2L transducer for recording ECG and a SS57L EDA (electrodermal activity) transducer. The software used to process and display these signals is very often AcqKnowledge (for research) or Biopac Student Lab (for education).

Although emotions cannot be captured or studied in a lab, the physiological changes that result from emotional experiences certainly can be.

For further reading about emotional affect, please see our blog “Circumplex Model of Affect and Motivational State.”

Other related BIOPAC resources:

BIOPAC offers a wide array of wired and wireless equipment that can be used in your research. To find more information on solutions for recording and analyzing signals such as ECG, heart rate, respiration, and more using any platforms mentioned in this blog post, you can visit the individual application pages on the BIOPAC website.

Photo by Noah Buscher on Unsplash


The Eyes Have It—Mobile Eye Tracking

Eye tracking has been a consistent player in the physiological research field for a number of years, and more recently a “mobile” variation of this technology has become increasingly widespread. But just what is mobile eye tracking and how does it work? Unlike eye tracking studies tethered to a lab, where a participant visually follows an object on a computer screen, mobile eye tracking data can be acquired outside of the lab. All that is required, in fact, is a pair of glasses. Not just any glasses, but ETVision glasses, capable of recording not only multiple parameters of a participant’s “eye image” but also the scene the participant is gazing at and responding to. Let’s look briefly on how eye tracking glasses work. The lightweight ETVision glasses are equipped with two eye-facing cameras combined with a pair of LEDs for recording the various components of the “eye image,” such as pupil size/position, gaze path, fixation (when the participant’s eyes lock onto an area of interest), internal and external data markers, vergence angle (angle between the eyes), and corneal reflections (CRs). The cameras also look at the contrast between the pupil and the surrounding iris. This constant real-time feedback is recorded every 5.5 milliseconds and the eye images are rendered at 180 frames per second.

In addition to eye cameras, a built-in forward-facing 720p scene camera records the viewable area in front of the participant. This enables the landscape or scenery the participant is looking at to be combined and synchronized with the eye image data (say, if the participant is driving a car or riding a mountain bike).

Did I say riding a mountain bike? Yes. Full eye tracking data can be collected and stored in a 256 GB SD card and the logged data exported to a .*csv file, which in turn can be imported into AcqKnowledge software along with other logged physiological data. The glasses also have a coated visor for reducing glare. (Glare causes squinting and the eye tracking cameras do not perform as well on eyes that are squinting or closing due to excessive light or reflections.)

In addition, a small microphone built into the eyeglasses enables two-way audio between the investigator and the participant. Already wear glasses? No problem. Eye tracking glasses can be worn over corrective lenses without issue. However, contact lenses should be cleaned before wearing them under eye tracking glasses. The glasses are connected to a small controller via a standard HDMI cable, and the controller houses a 256 GB SD card. In addition to the SD card used for logging remote data, the controller can also be connected to a host computer via WiFi or LAN. The lithium-polymer battery will run the eye tracking glasses for 5.5 hours on a full charge.

Using the AcqKnowledge software’s Media feature, the eye tracking video data can be replayed with a tight correlation to other physiological data collected during the experiment by the BioNomadix Logger. (Other data acquisition hardware types, such as MP160 or MP36R, can be used within the lab.) The eye tracking video and graph data can be displayed side-by-side on the screen. Placing the I-beam cursor at any point in the AcqKnowledge graph takes you to the corresponding point in the eye-tracking video (say, during activities such as driving a car). Eye tracking data for vertical position, horizontal position, pupil diameter, and more can be imported as channels into the AcqKnowledge graph. This data will be synchronized with the eye tracking video, along with any added event markers.

Interested in more details about ETVision Eye Tracking Glasses and AcqKnowledge software? To see it all in action, we invite you to view our free on-demand Mobile Eye Tracking Webinar.


BIOPAC offers a wide array of wired and wireless equipment that can be used in your research. To find more information on solutions for recording and analyzing signals such as ECG, heart rate, respiration, and more using any platforms mentioned in this blog post, you can visit the individual application pages on the BIOPAC website.

Photo by Amanda Dalbjörn on Unsplash

Meet Them Where They Are—Portable Wireless Solutions

Once relegated to tightly controlled lab environments where electrode-laden participants were observed at close quarters, researchers are now able to extend the lab into the everyday environment over nearly limitless distances. Top quality physiological data can be acquired from untethered subjects performing tasks ranging from sleeping comfortably in their own beds to engaging in high-impact sports. How and when did this deep dive into unfettered physiology become possible? We offer a brief examination of the solutions currently offered as the 2020s emerge.

BioNomadix BioShirt

Lightweight, comfortable, and some might even say fashionable, the BioNomadix BioShirt uses a respiration sensor and fabric electrodes to wirelessly record respiration and ECG from ambulatory subjects performing unfettered tasks in short or long-term studies, in the lab, or in the real world. The shirt connects to a BioNomadix wireless Respiration & ECG Transmitter (BN-RSPEC) secured in a small pocket on the front of the BioShirt—no electrodes, gels, or wires need apply. Wireless data can be transmitted to a BioNomadix Smart Center, Logger or matched Receiver+MP160/MP150 System. BioShirts provide a high level of comfort and are ideal for long-term physiological monitoring. The ECG and respiratory signal are obtained by means of sensors made of yarns that are fully integrated into the shirt’s textile structure. Sensors are made of fibers directly woven during the production process, and connections between sensors are obtained using conductive fibers for a totally unobtrusive, highly comfortable sensorized garment. The base yarn is composed of anallergic and antibacterial materials to guarantee safe and prolonged use. Machine washable with mild detergent—do NOT use fabric softener.

Smart Center

The BioNomadix Smart Center is a small-form USB-powered data acquisition unit that can record data from up to three wireless BioNomadix transmitters at a time. The transmitters are automatically detected and paired using a guided setup wizard. Smart Center is compatible with 14 different BioNomadix Transmitter types encompassing all major body signals. AcqKnowledge data acquisition and data analysis software also supports monitoring transmitter battery levels, automatic configuration of derived signals and guided analysis based on the type of recorded signals. Adhesive Velcro disks are included for mounting on various surfaces. Smart Center offers a compact and sophisticated physiology platform that sets up in minutes. Simply plug the Smart Center into the computer, set up the transmitters and subject, then start recording high quality data with AcqKnowledge software.

BioNomadix Wireless Wearable Physiology Logger

Offering the industry’s only system that delivers a comprehensive, 24-hour data logging solution in an easy-to-use, easy-to-wear package, the BioNomadix Logger truly delivers “physiology anywhere.” The BioNomadix Logger is the perfect tool for applications that demand greater degrees of subject freedom and complex experimental design. BioNomadix Loggers wirelessly record physiological data as subjects freely and naturally live their lives.

BioHarness Telemetry and Logging Systems

BioHarness with AcqKnowledge software is a lightweight portable biological data logger and telemetry system that monitors, analyzes, and records a variety of physiological parameters including ECG, respiration, posture, and acceleration. BioHarness applications include physiology, psychology, psychophysiology, exercise physiology, ergonomics, human factors, and more. The BioHarness operates in Bluetooth transmitting mode for live viewing of data or data logging mode. In the data logging mode, BioHarness acquires and saves the data for later download to AcqKnowledge software using the included USB docking and charging cradle.

Eye Tracking Glasses ETV

The ETVision (ETV) wearable unit resembles a pair of eyeglasses that can be worn by itself or over the participant’s prescription eyeglasses. The glasses incorporate miniature “eye cameras” for viewing each eye and a “scene camera” that views what the participant is looking at. A built-in microphone is included, and an optional visor can be mounted to the front of the headgear. Recording video and audio data to an SD card for later data processing allows the participant to be completely untethered during data recording. This is useful while engaging in long term activities away from the lab such as walking, bicycling, or driving.

For more information about BIOPAC wireless solutions, we invite you to view the following resources:


BIOPAC offers a wide array of wired and wireless equipment that can be used in your research. To find more information on solutions for recording and analyzing signals such as ECG, heart rate, respiration and more using any platforms mentioned in this blog post, you can visit the individual application pages on the BIOPAC website.

Photo by Fabio Comparelli on Unsplash

Eye Tracking Insights

Try Not To Blink—This Won’t Hurt

What exactly, is eye tracking? Do I have to put on a helmet or stick something unpleasant into my eye? No, nothing so invasive, and not the least bit uncomfortable. Eye tracking is the process by which eye movements are recorded for the purpose of tracking where a subject is looking, what he/she is looking at, and the duration of the subject’s gaze on a given area. Eye tracking differs from electrooculogram (EOG) in that it records where and at what the subject is actually looking, whereas EOG primarily records the movements of the eye muscles. Rather than merely recording eye movement and position, eye tracking forges an invisible yet accurate connection between the subject and the objects within the subject’s field of vision. These “visual connections” of where the subject was looking during the study are clearly visible in the resulting data, as dramatic as tire tracks on an impressionable surface.

So how does eye tracking work? Using invisible near-infrared light combined with high-definition cameras, the eye tracking system projects invisible light onto the eye and records the direction from which it is reflected off the cornea. Eye tracking software is used to calculate the exact position and focal point of the eye. The sophisticated combination of eye tracking hardware and software allows for extremely accurate measuring and analyzing of visual behavior and fine eye movements. This makes it possible to create a detailed map of a subject’s field of vision and the specific visual elements honed in on by the subject. Eye tracking data is commonly acquired in tandem with other body signals for the purpose of determining the effects of what we are looking at has on our physiology. Common signals acquired during eye tracking studies are:

  • EEG (cognitive processes)
  • EDA (alertness)
  • ECG (anxiety)
  • EMG (muscle activity, conditioning)
  • EGG (pulse, respiration, temperature)

What are researchers looking for when conducting eye tracking studies? Eye tracking data is useful in a variety of different research fields including interface usability, reading analysis, psychological and emotional response, marketing research, training, clinical vision diagnosis, and more.

Eye tracking hardware mainly comes in two flavors. Screen based eye tracking involves having a subject sit in front of a computer monitor while being presented with various types of visual stimuli. A “bar type” eye tracker records the subject’s responses and interfaces with eye tracking software to present the stimulus and store the resulting data for analysis. BIOPAC’s AcqKnowledge software version 5.0.6 and higher, along with the BIOPAC MP160, MP36R, or Wireless Smart Center system, supports fully-integrated eye tracking functionality*. Rather than having to learn a second software program, the familiar AcqKnowledge interface has been extended to incorporate the EYE-TRACK-BAR and EYE-TRACK-BAR-XL remote screen eye tracking systems.

Mobile or “wearable” eye tracking systems utilize a pair of glasses with two types of built-in cameras. One camera faces the subject and tracks eye movements, gaze path, and other parameters, and a second camera (called a scene camera) records what the subject is looking at during the study. Mobile eye tracking allows the subject to engage in independent activities outside the lab, such as driving an automobile. Additional sensors record and log data from other body signals in real time, which can be loaded into the software for subsequent analysis.

For more information about eye tracking, we invite you to sign up for our free “Eye Tracking Fundamentals” webinar to be broadcast live on November 21, 2019 at 8:00 AM PST. Did you miss it or can’t attend? No problem. Follow the same link to watch it on demand.

*Eye Tracking Integration License for AcqKnowledge required.

Please also visit the following links for information about BIOPAC Eye Tracking products.

Eye Tracking Systems

Eye Tracking License


BIOPAC offers a wide array of wired and wireless equipment that can be used in your research. To find more information on solutions for recording and analyzing signals such as ECG, heart rate, respiration and more using any platforms mentioned in this blog post, you can visit the individual application pages on the BIOPAC website.

Photo by Marina Vitale on Unsplash

Neuroscience – A Brief History

What is neuroscience? In a nutshell, the study of neuroscience encompasses the physical and functional workings of the human brain and nervous system, drawing from a mix of cellular and molecular biology, anatomy, physiology, human behavior, and cognition. This field remains in a state of near-constant evolution, as the brain does not easily give up its secrets. Although the brain is home to a hundred billion neurons (brain cells), with nearly a quadrillion connections linking them, we have yet to fully and deeply understand the full breadth of a single cell.

But when and how did neuroscience originate? We know that as far back as 7,000 years ago, healers were boring holes into the skulls of their companions, a process known as trepanation. One can imagine the grim determination these ancients exhibited in their efforts to understand and relieve suffering, even if it was only with the intent of exorcising evil spirits. And it’s harder still to imagine how boring into someone’s living skull without anesthesia could possibly offer any measurable relief from suffering. However misguided these ministrations were, it’s clear that even millennia ago, the brain was recognized as an organ of great physiological significance.

For centuries, conventional wisdom recognized the heart as the seat of human consciousness. The Greek physician Hippocrates challenged this hypothesis, believing the brain to be the center of intelligence, yet the heart continued to hold sway with physicians and healers until long beyond Hippocrates’ time. This view persisted until the Roman physician Galen consistently observed that brain injuries sustained by gladiators often resulted in a marked decrease in cognition and mental acuity. (These injuries possibly foreshadowed today’s phenomenon of NFL CTE injuries.) Gradually, the brain began to take its rightful place in the pantheon of human physiology.

During medieval and Renaissance times, continuing important discoveries about the brain helped lay the foundation of what would become modern neuroscience, much of this new knowledge gleaned through illicit dissections, or by examining the brains of executed criminals. It’s safe to say that much scientific discovery—including that of human physiology—was hobbled by the religious constraints of the day. It wasn’t until the late 18th century, when Luigi Galvani observed the electrical activity of muscles and neurons, that key indicators about brain function became more apparent. Observations during this period often raised more questions than answers, however.

The 19th century brought further advances in the study of the brain and nervous system, notably by Emil du Bois-Reymond, who successfully demonstrated the electrical properties of nerve signals, and Paul Broca, who discovered through his pioneering work with brain-damaged patients that different regions of the brain were responsible for specific functions. This was later borne out by the German anatomist Korbinian Brodmann, who mapped the human cortex into 52 distinct areas, along with their corresponding functions.

In the 20th century, and particularly since the 1950s, neuroscience has evolved into an increasingly wide-ranging discipline, incorporating the brain and nervous system on a molecular level. This gave rise to many different types of neuroscience, which include affective, behavioral, molecular, cellular, clinical, computational, and a great many more. As the study of neuroscience has progressed, this field has produced no fewer than 19 Nobel Prize Laureates between 1904 and 2017. Neuroscience encompasses the most complex and sophisticated organ system in the body, a system that may possibly never be fully understood and certainly will continue to present wonders and challenges for centuries to come.

If you study neuroscience and want to learn more about how to get great data & meaningful life science measurements for human, animal, virtual, or MRI protocols, be sure to check out [button link=”https://www.biopac.com/webinars/” type=”small” newwindow=”yes”] BIOPAC Webinars[/button].

Photo by Jack Antal on Unsplash


fNIRS Systems—a NIR miracle

At the dawn of the 19th century, pioneering astronomer Sir William Herschel discovered the existence of infrared radiation, which is electromagnetic radiation invisible to the human eye but identifiable via its ability to heat objects. Infrared radiation is commonly divided into three categories, near, mid, or far infrared waves. In ensuing years, infrared radiation was found to be useful for industrial, scientific, military, and law enforcement applications, such as heat signature tracking and night vision goggles. Over two decades ago, a new technology called near infrared spectroscopy (NIRS) was developed for non-invasively measuring specific aspects of human physiology using near infra-red waves. While far infrared waves lie closest to the microwave region, near infrared waves are closest in length to the visible light part of the electromagnetic spectrum, and are microscopic in size. Unlike far infrared waves, near infrared waves do not produce any heat. In fact, we can’t feel them at all. They are the small waves used by common devices such as a
remote control.

Today, near infrared waves are commonly used  for studying many application areas of human physiology, notably by the fNIRS Imaging Systems to gather precise, high-density brain function and muscle oxygenation data.

How does fNIRS work with regard to human physiology? It’s an optical technology which sends light into the tissue and records the light that scatters back via a photo-diode and sensor attached to the subject. The fNIRS continuous wave technology uses an optical window in the near infrared spectrum that enables light to pass through. For example, when you hold your hand in front of a strong white light, the tissue can appear red and almost translucent. fNIRS shines light into the skull or muscle tissue, and using special detectors, records the resulting light scatter that returns to the surface.  The light penetrates skin, bone, and alights on the brain before its return trip to the surface detectors, and accomplishes this painlessly without heat. In fact, the subject does not even feel the near infrared energy and the light is harmless. The result is startling images and functional data of the brain at work. The fNIRS Systems (ranging from Educational to High-Density versions) include fNIRsoft software for processing, analyzing and visualizing functional near infrared (fNIR) spectroscopy signals through a graphical user interface. Additionally, the fNIRS Systems work with the BIOPAC MP160 Research System and AcqKnowledge software in conjunction with other physiological signals such as ECG, respiration, cardiac output, blood pressure, electrodermal activity, and stimulus response markers. AcqKnowledge software also provides automated analysis tools for event related potentials and ensemble averaging.

fNIRS brain function application areas include workload assignment, VR,  stress, attention, geriatrics, economics, ergonomics, learning and performance, sports science, HCI, pain perception, and cognitive workload – low or high.

fNIRS Systems can also be used to measure muscle oxygenation data, including oxidative capacity, muscle load, lateral imbalances (left vs. right muscle group) oxygenated hemoglobin and de-oxygenated hemoglobin in muscle activity.

We invite you to enjoy a comprehensive free fNIRS webinar and to visit our fNIRS products page.

BIOPAC offers a wide array of wired and wireless equipment that can be used in your research. To find more information on solutions for recording and analyzing signals such as ECG, heart rate, respiration and more using any platforms mentioned in this blog post, you can visit the individual application pages on the BIOPAC website.

Why Smart Technology Is Smarter

Physiological research studies require a great deal of focused expertise, including an ability to properly set up all necessary equipment for the study at hand. This has long consisted of overseeing a host of manual hardware connections and software settings, and mistakes can be frustrating. The good news is most users become proficient at these detailed configurations, but wouldn’t it be a welcome change if these setups were easier? Think about how helpful it would be if the hardware and software were “smarter” and actively worked on your behalf. This is now a reality with the smart technology offered by BIOPAC’s newly-released line of 100D Smart Amplifiers.

What is smart technology and what makes Smart Amplifiers smarter? To begin with, these amplifiers are significantly smaller than standard amplifiers (only 4.6 mm in length) and have no buttons or switches. The convenient lightweight design is a powerful benefit, enabling these amplifiers to be attached closer to the participant’s body. Because the amp itself is positioned near the signal source(via a lightweight 3-meter cable), the resulting data is of superbly high quality, with less noise and artifact than conventional amplifiers. But let’s get to the smart part. The smart technology in Smart Amplifiers enables them to do the setup work for you. Each Smart Amplifier, regardless of signal type,  self-configures to the optimally recommended settings, negating the need for user-defined adjustments or monitoring of physical switch positions. Simply plug the amplifier into the new AMI100D Input Module now included with every BIOPAC MP160 System, launch the AcqKnowledge software, and begin recording data.

To minimize setup time and errors in the lab, Smart Amplifiers utilize auto-detection and auto-identification technology. Not only do they self-configure, they also alert you (via a software dialog) whether the amplifier is connected to the correct channel. So basically, using Smart Amplifiers right out of the box is a three step process. 1) connect the amplifiers, 2) select any desired calculation channels for derived signals, 3) click Record. That’s it.

Frequently-used calculation channels or transformations are pre-configured for all signals and can be enabled by simply checking a box in the amplifier’s software UI. (For example, the ECG100D Smart Amplifier offers options to add heart rate and/or R-R interval, and will automatically place these derived signals in a separate calculation channel in the AcqKnowledge graph.)

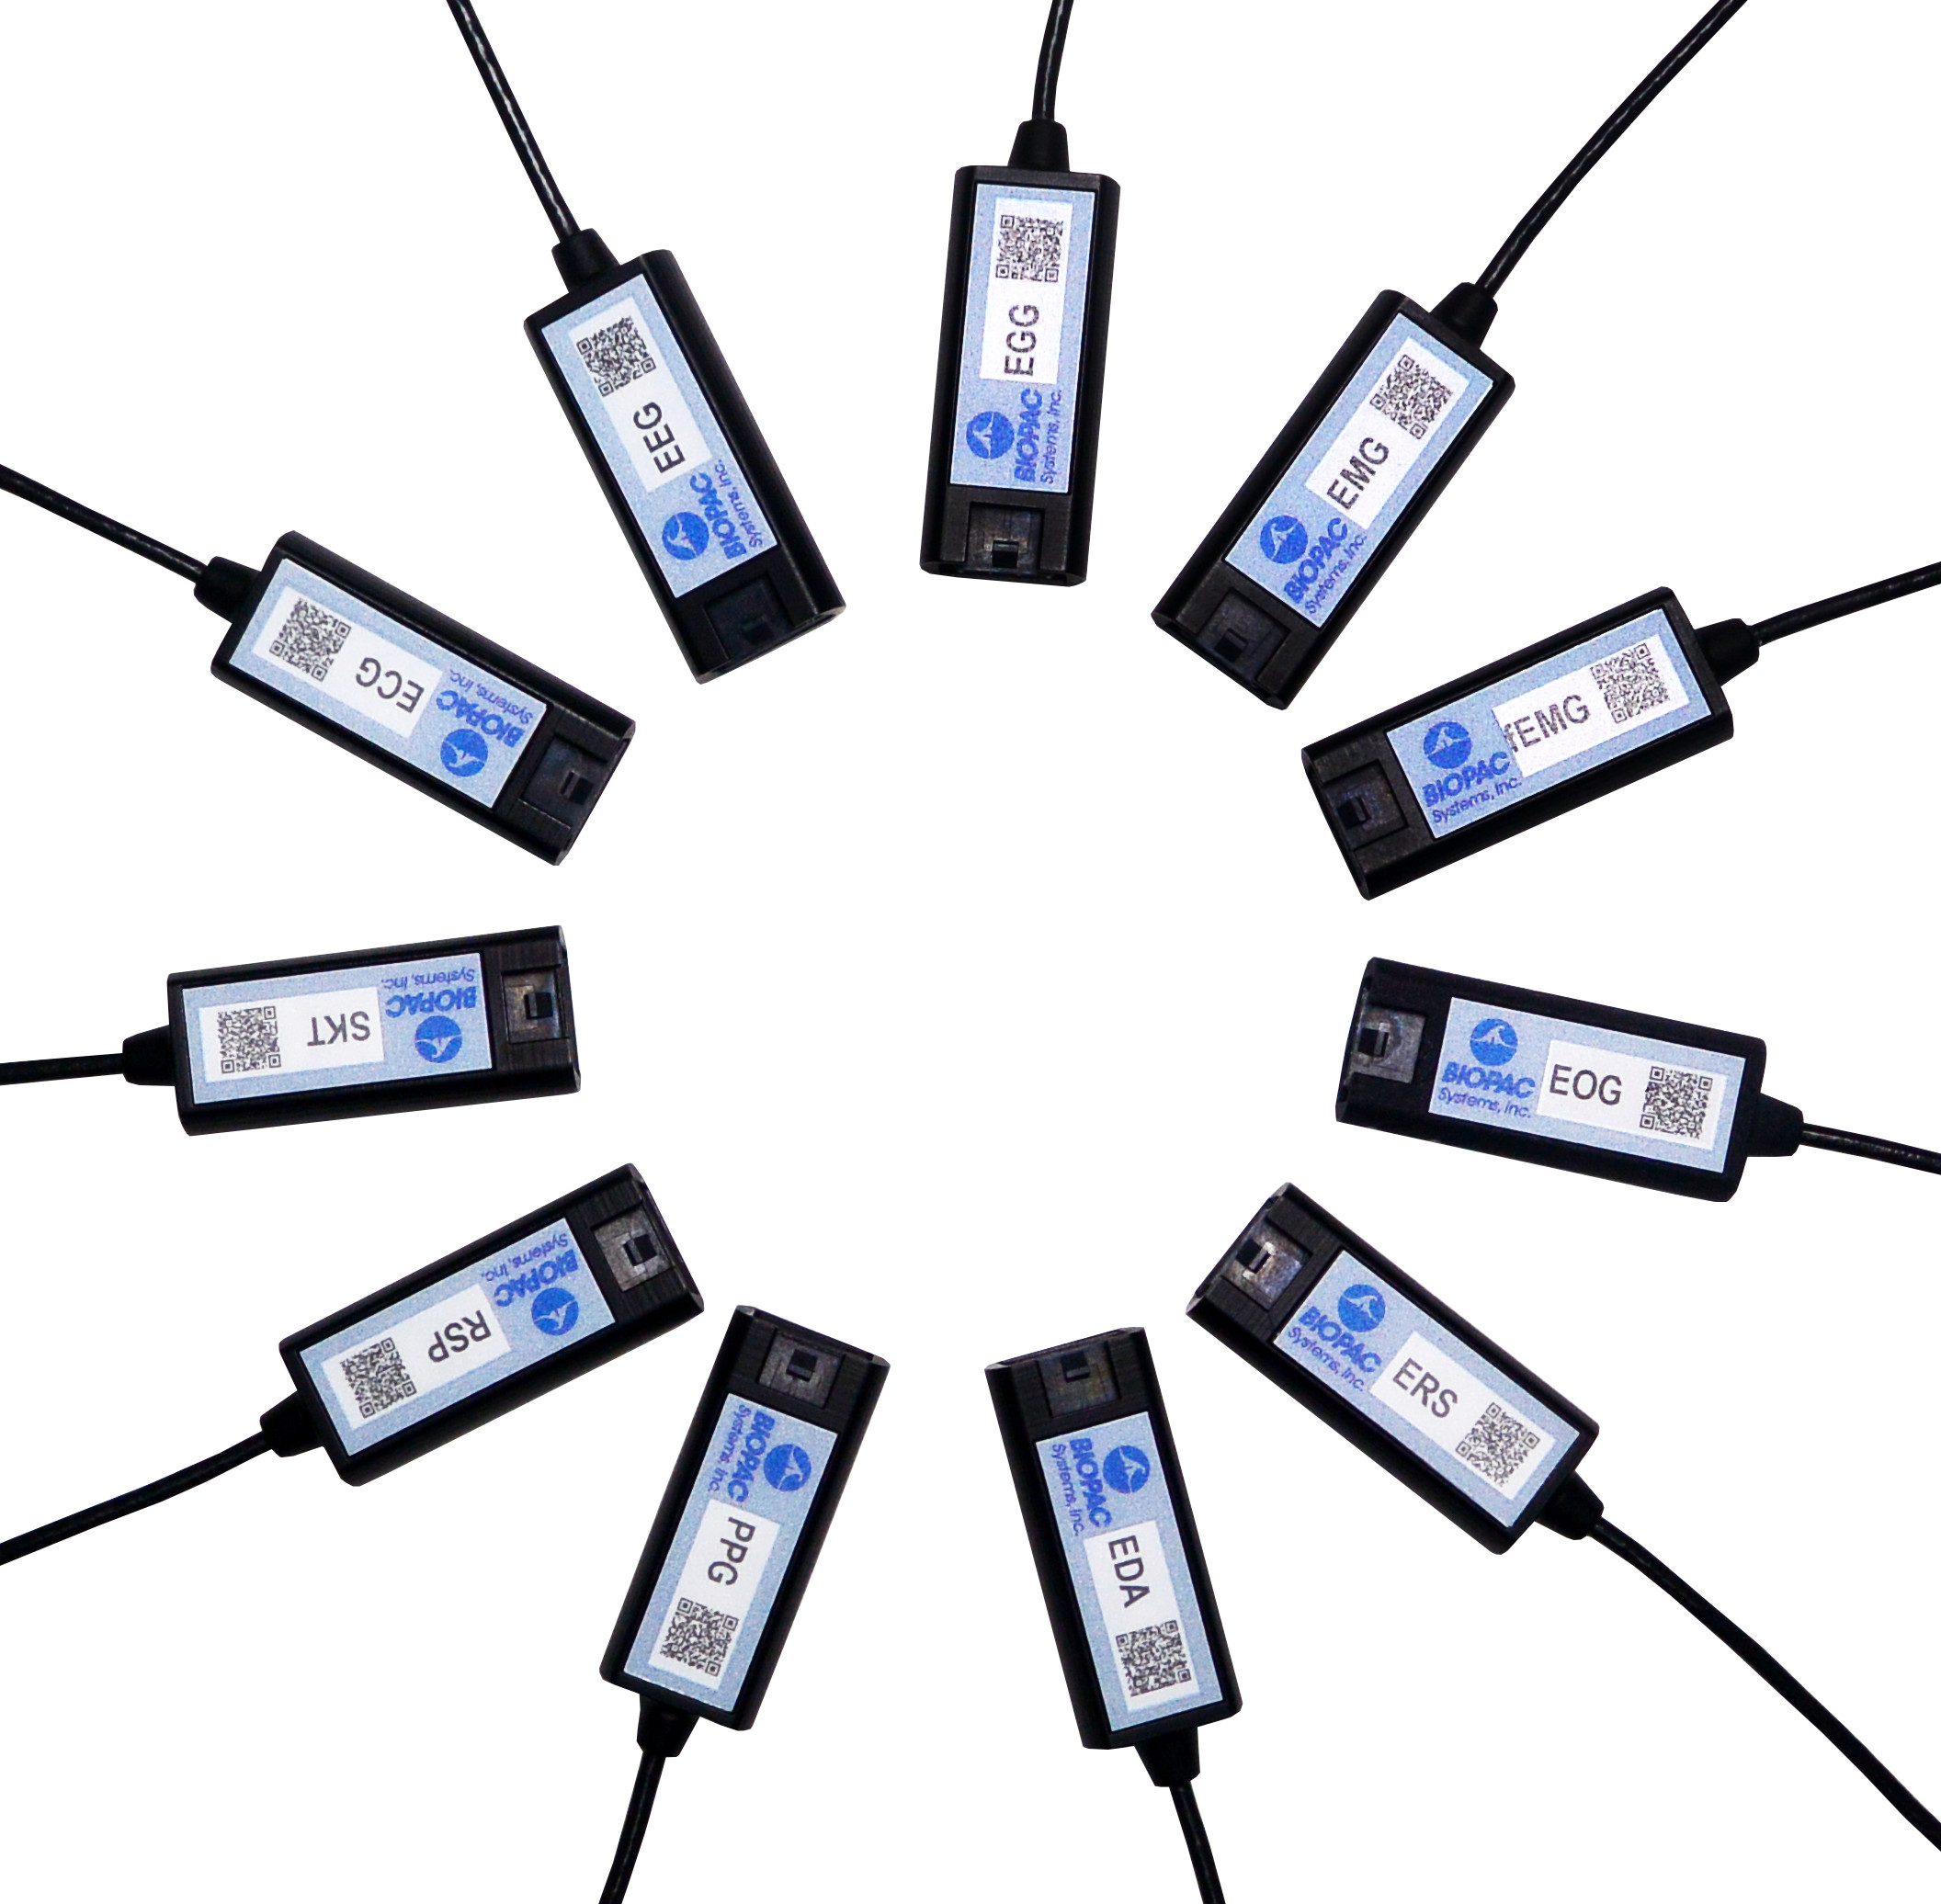
Smart Amplifiers are available for the following signals: ECG, EEG, EGG, EDA, RSP, PPG, ERS, EOG, SKT, EMG and new fEMG (facial and small muscle).

Significantly smaller footprint, simple setup, unparalleled user comfort, superlative data quality, compatible with previous-generation BIOPAC amplifiers (such as 100C and BioNomadix Series), portable and lightweight, Smart Amplifiers will be an epiphany for your research.

To see Smart Amplifiers in action, we invite you to watch our free on-demand webinar New Smart Technology for the Lab.

BIOPAC offers a wide array of wired and wireless equipment that can be used in your research. To find more information on solutions for recording and analyzing signals such as ECG, heart rate, respiration and more using any platforms mentioned in this blog post, you can visit the individual application pages on the BIOPAC website.

Synchronize Participant Video with Physiological Data

AcqKnowledge software includes a Media feature that allows you to record and link participant video with physiological data. A common issue that crops up when analyzing physiological data with linked participant video is a lack of synchronization between the resulting video playback and onscreen data. This most often occurs when a USB webcam-type video camera is used. These types of cameras typically support a 30 frame-per-second rate whereas AcqKnowledge and the MP System can sample at rates up to 200,000 Hz. These factors can introduce an unwanted delay or misalignment between the video playback and data in the resulting AcqKnowledge graph.

So how do we synchronize these disparate signals to dovetail perfectly before recording our data and video? Fortunately, AcqKnowledge provides adjustment tools for addressing this common issue. This simple procedure requires the use of the AcqKnowledge software’s powerful Stimulator feature and a BIOPAC OUT103 LED Video Sync Cable.

Here is the sync method in a nutshell: With the OUT103 LED connected to the Analog Output of the MP160 unit’s HLT100C module, the AcqKnowledge software’s Stimulator is used to output a 5-volt square wave pulse into an AcqKnowledge graph, Using this setup, the LED illuminates when the 5-volt pulse is applied. The trick now is to use the AcqKnowledge Media feature and webcam to record a short video of the LED illuminating while the 5-volt pulse is being applied.

In the resulting graph, it’s easy to see in the Media playback screen when the light comes on by slowly advancing the AcqKnowledge software’s I-beam cursor through the graph data. Does the LED in the recorded video illuminate before the cursor reaches the 5-volt pulse? After? Or at the same time? Chances are, the recorded light will pop on slightly before or after the cursor reaches the pulse.

To compensate for this, the AcqKnowledge Delta-T measurement is used to determine the time interval between the pulse and when the recorded LED illuminates. For example, if the recorded LED lights up an indicated 185 ms before the onset of the pulse, then this discrepancy can be removed by setting a delay of 185 ms in the Media setup tools. If the LED lights up after the pulse onset, a negative delay must be set (ex. -185 ms). Once the playback delay is eradicated, the experiment can continue with confidence that all video and physiological data will be properly aligned.

It’s features such as this that enhance the usability AcqKnowledge Media feature, making it a powerful tool for recording and synchronizing participant video and audio during experiments. After a bit of practice, dialing in the playback video for linked Media acquisitions becomes second nature.

To see AcqKnowledge Media Synchronization in action, we invite you to view a free on-demand webinar covering this procedure in detail.

BIOPAC offers a wide array of wired and wireless equipment that can be used in your research. To find more information on solutions for recording and analyzing signals such as ECG, heart rate, respiration and more using any platforms mentioned in this blog post, you can visit the individual application pages on the BIOPAC website.

error: Content is protected !!