A Heartbeat Away: HRV Unlocks Autonomic Insights

The beating of the heart holds the key to a myriad of physiological questions that are of interest to researchers. The measured variation in time intervals between consecutive heartbeats, otherwise known as Heart Rate Variability (HRV), provides valuable insights into the activity of the autonomic nervous system, reflecting the balance between sympathetic and parasympathetic influences on the heart.

HRV allows researchers to assess cardiac health, stress levels, and overall autonomic function, making it an invaluable component of physiological studies to investigate numerous areas such as cardiovascular health, mental health, stress, and exercise physiology to name just a few.

A recent study applied HRV to examine the effectiveness of yoga and Ayurveda, a form of alternative medicine traditionally practiced in India and Nepal, to regulate and treat lymphedema. Lymphedema is tissue swelling caused by an accumulation of protein-rich fluid that’s usually drained through the body’s lymphatic system. Because lymph drainage has been connected to autonomic function, researchers postulated that HRV would provide meaningful insight into the effectiveness of yoga and Ayurveda programs in treating lymphedema. A BIOPAC two-channel BSL data acquisition system was employed to gather HRV and respiration data of participants who underwent an intensive regimen of yoga exercise, limb soaking, herbal baths, and manual lymph drainage. Initial comparisons of HRV data between both the test and control groups showed significant improvement in the lymphedema patients following treatment.

beating heartIn many cases, researchers choose to combine HRV with other signals to provide a more detailed picture of a participant’s autonomic response to stimuli. A 2020 study sought to identify an effective noninvasive measure of how the sympathetic nervous system (SNS) responds to stimuli. Typically, such measurements involve the invasive recording of muscle sympathetic neural activity at the peroneal nerve. This study examined HRV and electrodermal activity (EDA), both separately and in combination, to see which provided the most effective measurement of SNS activity. Researchers measured participants’ SNS response to both a cold-pressor test (submerging hand in ice water) and while viewing emotionally challenging video images. Throughout both tests, continuous ECG and EDA signals were acquired and analyzed using a BIOPAC four-channel data acquisition system. An ECG100C and EDA100C were used to acquire the ECG and EDA signals, respectively. From their results, researchers concluded that the combination of HRV and EDA provided a better metric for SNS activity than HRV alone.

Whether alone or in combination with other signals, HRV offers researchers a powerful tool for measuring how the autonomic nervous system responds to a wide range of stimuli and conditions with applications across a broad spectrum of fields. Visit our Webinars page for multiple examples of how HRV is being used in research and check our HRV citations as well.


Are you designing a study that features HRV? BIOPAC’s regional sales reps can help you access the right tools for the job to ensure the best possible results. Contact us today!

Body Electric: Bioimpedance in Physiology Research

With nearly 70 percent of our bodies made up of water as well as a variety of dissolved salts, humans are natural conductors of electrical current. However, various elements of the human body restrict or impede the flow of electrical current, a phenomenon termed “bioimpedance.” Variations in restrictiveness to the flow of electrical current through an organism can provide researchers with a wealth of information on a range of physiological conditions.

Bioimpedance can be defined as the response of an organism to an externally applied electrical current. For more than a century, researchers have used bioimpedance as a safe and noninvasive metric for a range of physiological data, from measuring body composition through bioimpedance analysis (BIA) to investigating various biological systems such as cardiovascular function via impedance cardiography.

While not new, breakthroughs in technology and techniques for recording and analyzing bioimpedance have made it increasingly accessible to researchers. Through impedance cardiography and cardiac output, researchers gain access to a wide range of cardiovascular and hemodynamic data, including heart rate (HR), cardiac output (CO), acceleration index (AI), mean blood pressure (MBP), stroke index (IA), stroke volume (SV), and systemic vascular resistance, to name just a few.

The recent development of trans-radial electrical bioimpedance velocimetry (TREV) has provided researchers with a heightened level of accessibility when attempting to record high-quality data. Unlike traditional transthoracic methods of recording impedance cardiography signals, TREV measures blood movement through the radial and ulnar arteries of the forearm. The approach streamlines electrode placement, making it less prone to complications associated with other impedance cardiography methods.

bioimpedanceOne example of the practical application of impedance cardiography is in research on stress as it relates to coronary health. A 2019 study published by researchers at the University of Illinois at Urbana-Champaign compared the stress response of a group of young participants to that of participants over the age of 55 who had been diagnosed with coronary artery disease (CAD). Researchers recorded physiological signals, including electrocardiogram (ECG), impedance cardiogram (ICG), and continuous BP during rest, stress, and recovery. ECG and ICG signals were collected using BIOPAC BN-NICO wireless amplifiers and BN-EL50-LEAD4 leads. Researchers found ICG provided a reliable metric for stress response.

Recently, a team from the University of California, Santa Barbara (UCSB) employed TREV to demonstrate how this newer bioimpedance metric can be used to track event-related contractility in a maximal grip force experiment. The experiment employed TREV electrodes attached to the participant’s forearm and amplified by a NICO100D smart amplifier. Additionally, ECG electrodes were amplified by an ECG100D while the respiration cycle was recorded via a TSD221-MRI respiration belt. All data signals were acquired and analyzed using an MP160 system running AcqKnowledge software. The experiment confirmed the effectiveness of TREV as a reliable metric for connecting the cardio-sympathetic drive to other physiological conditions, such as force production.

While not new to physiological research, the application of bioimpedance continues to flourish and evolve. To learn more about how bioimpedance is being applied in the research setting as well as new techniques, check out BIOPAC’s webinar on bioimpedance and cardiac output focusing on TREV.


To learn more about incorporating impedance cardiography and TREV in your study, contact your regional BIOPAC sales representative today.

Balancing Act: HRV Provides Critical Marker for Psychophysiological Health

Two college wrestlers square off on the mat awaiting the signal that will begin their match. To the casual observer, the outcome seems impossible to predict. Their coach, however, knows one competitor has a clear advantage—a heart rate variability level (HRV) that is higher than his opponent’s. Examining HRV data provides more than insight into athletic performance, it offers a window into a broad spectrum of functions that influence psychophysiological health.

HRV balanceIn simple terms, HRV is the natural variation in the intervals between each heartbeat over time. Unlike a ticking clock, our hearts do not beat at a constant rate. As such, variations in heart rate can provide a wide range of valuable information on our bodily systems. This is because HRV represents a balancing act between our sympathetic and parasympathetic nervous systems, which together make up the autonomic nervous system. As we have discussed in previous posts, the autonomic nervous system controls nearly all the body’s involuntary functions.

The sympathetic nervous system is activated in times of stress or danger (i.e., the fight-or-flight response), during which our bodies sweat, our heart rates increase, and the interval between beats decreases. Conversely, the parasympathetic nervous system acts as a sort of switch, shutting down the sympathetic nervous system and activating a relaxed state (i.e., rest and digest). To do this, it releases acetylcholine, a neurotransmitter that makes the heart beat slower and at greater intervals.

When these two systems are in balance, they produce higher HRV through a more variable heart rate. Greater variability has been associated with the body’s ability to switch between these systems. Thus, HRV is used as a health marker, such that high HRV is associated with better cardiovascular health, mental focus, emotional health, stress management, and ability to recover from exercise, while low HRV is associated with inflammation, chronic fatigue, increased stress, depression, and chronic pain.

HRV has also been connected to willpower and is a predictor of persistence and self-control. HRV increases during periods of self-regulation sometimes called the “pause and plan response.” As such, HRV has been particularly useful in research into the mechanism associated with addiction. A 2019 study used HRV to explore how chronic pain patients treated with opioids could regulate drug cravings and depression through dispositional mindfulness. Electrocardiogram (ECG) data were sampled with a BIOPAC data acquisition unit while HRV was calculated with AcqKnowledge software.HRV chart

Because HRV plays such a critical role in physical and psychological health, several studies have investigated how to self-regulate HRV, including examining how it is affected by posture. A 2020 study used a  2-channel BSL data acquisition unit to gather ECG data to calculate HRV for a variety of bodily positions to determine their impact.

A similar study examined the link between HRV and resilience, i.e., the individual’s ability to return to stable physical and psychological equilibrium after experiencing stress. HRV calculations were made from data gathered via a BIOPAC ECG100C ECG amplifier, RSP100C respiratory amplifier, and EDA/GSR amplifier. The study identified possible trends connecting resilience factors and HRV levels during specific stress-inducing simulations.

Calculating HRV with BIOPAC hardware and software solutions provides researchers with a myriad of psychophysiological insights for their lab work. Learn more about HRV from our Knowledge Base entry, as well as application notes on data preparation for analysis and statistical and geometric measures.


For additional information on how BIOPAC can assist you with a wide range of research and educational applications, contact your local sales representative.


ECG – The Little Wave You Can’t Live Without

For millennia, ancient healers across the globe long recognized the human heart as immeasurably vital to human life. Other organs may take an occasional time out, but not the heart. This sinewy fist-sized pump contracts and relaxes an average 60 to 80 beats per minute and faithfully repeats this cycle some two and a half billion times over an average human lifespan, constantly driving and recirculating lifeblood through 100,000 miles of veins, arteries, and capillaries. It’s a monumental task that we take for granted, but if the process stops for more than a few minutes, so will this mysterious force we call life.

It’s intriguing to consider the wonder with which the ancients must have contemplated this organ that thumps so audibly. They knew it was of critical importance, and over the centuries learned its form and surface physiology, but what did they imagine animated it? What force kept the heart moving so steadily and faithfully, while remaining implacably divorced from the consciousness of its host? (Go ahead. Try to stop your heart. On second thought, don’t.)

The answer, in a word, is electricity. Although the stethoscope, invented in 1816 by French physician René Laennec, augmented audible heart sounds, it wasn’t until 1901 that Dutch physician Willem Einthoven developed a “string galvanometer,” capable of reliably recording the heart’s electrical activity. Einthoven’s work established a standard configuration for recording the electrocardiogram (ECG) and garnered him the Nobel Prize in 1924. Because the ECG reflects electrical activity, it is a useful “picture” of heart normality or abnormality through the observation and analysis of various distinct components of the cardiac cycle. If there are interruptions of the electrical signal generation or transmission, the ECG changes. These changes can be useful in diagnosing changes within the heart.

The methods for recording ECG have become increasingly sophisticated with the advent of digital technology and have put state-of-the art acquisition and analysis of ECG within reach of not only clinicians, but also researchers and educators. Wired in-lab systems such as the BIOPAC MP160 System with AcqKnowledge software are widely used for Research applications, while the MP36 System with Biopac Student Lab software are the industry standard for physiology education around the globe. Wireless systems such as BioNomadix or BioNomadix Smart Center can be used to collect ECG and other body signals in an untethered environment and the BioNomadix Logger is a great solution for acquiring ECG and other body signals over extended periods outside the lab.

We have come a long way since our forebears contemplated the mysteries of the vital mechanical wonder that beats in every chest, and we now have a myriad of accessible options for unlocking its secrets.

For further exploration of ECG, we invite you to enjoy the following comprehensive free ECG webinars:

Recording Great ECG

HRV & RSA – Fundamental ECG Analysis Techniques

BIOPAC offers a wide array of wired and wireless equipment that can be used in your research. To find more information on solutions for recording and analyzing signals such as ECG, heart rate, respiration and more using any platforms mentioned in this blog post, you can visit the individual application pages on the BIOPAC website.


Stressing over the effects of stress

Several studies show chronic stress is typically detrimental to health, while acute stress may be linked to positive effects in addition to the negative counterparts

With April comes National Stress Awareness Month, and it bears noting that different types of stress have varying effects. Where chronic stress is typically detrimental to health, acute stress may be linked to positive effects in addition to the negative counterparts. But is this trade-off worth it?

In a biological psychology experiment testing the effect of oxytocin on acute social stress, researchers found different results between men and women. Subjects underwent several stress tasks while their electrocardiography and impedance cardiography were recorded with a BIOPAC MP Research System and amplifiers. The researchers found that after being given oxytocin during the stressful event, men had less negative affect and women had greater math performance (compared to the control group).

A neurobiology study examined the effect stress had on an extinction memory process when a competing association was paired with a previously aversive cue. To test this, participants were presented with two images, one that was paired with a shock from a BIOPAC bar electrode, and one that was not. Extinction memory training immediately followed this stimulus, with extinction retrieval testing following a day later. Data gathered by a BIOPAC data acquisition system suggested significantly lower retrieval in the group that experienced the acute stress stimulus.

Another biopsychology experiment measured the effect of acute stress on pro-inflammatory cytokine levels in the blood. BIOPAC equipment was used to measure ECG while participants were given the Trier Social Stress Test. After reviewing the data and blood samples, the researchers determined that levels of the cytokine cell, interleukin-1β, increased significantly immediately after the stress test.

The physiological and psychological impacts of stress are clearly multifaceted with many potential results. In some situations, a heightened positive affect or greater analytical thinking may be beneficial. But is this boost in mental performance worth the increase of inflammatory cells and lower memory retention? As with many aspects of life, moderation is the safest answer, ensuring the negative effects do not become chronic problems.

For more information on BIOPAC’s wide range of tools for recording, displaying, and analyzing ECG measurements from human and animal subjects including respiration, heart rate variability, and RSA, visit BIOPAC’s electrocardiography pages and view BIOPAC’s full line of electrodes, amplifiers, and wearable, wireless transmitters and loggers.

BIOPAC Systems, Inc. provides life science researchers and educators with data acquisition and analysis systems that inspire people and enable greater discovery about life. Visit us at www.biopac.com.

Holiday Happiness: Gratitude or Gifts?

Studies investigated the anxiety of gift-giving, the effects of social support in stressful situations, and what impact meditation has on heart rate, ECG, and blood pressure.

December has arrived, and for many the holidays bring a rush to check items off of a long shopping list for parents, siblings, friends, in-laws, and many more. Often we struggle to find that “perfect” gift, but are the physical goods we exchange the true source of the warmth and happiness that characterizes the season?

An article by Nomura investigated anxiety induced by gift-giving. To test this, EDA data was recorded with a BIOPAC data acquisition system and STP100 while participants responded to stimuli. The participants visualized a specific relative while being presented with potential gift options, and were asked how likely they were to purchase the potential gift for that relative. The data found that people who self-reported thinking of in-laws were the most stressed, while those who reported thinking of children or same-gender friends were least stressed.

A psychosomatic study by Inagaki and Eisenberger found that mental and physical well-being benefit from forms of social support. They tested this by administering mild shocks with the BIOPAC STMISOLA to male patients who held the hand of a female partner lying in an fMRI. The results suggest that this support (hand-holding) provided possible stress-reduction for both the male and female participants.

Another article on nonverbal communication and well being by Shaltout, et al. tested the effects of meditation and the subsequent ECG, blood pressure, and heart rate effects. The BIOPAC ambulatory BioHarness and NIBP Blood Pressure System gathered data while participants underwent several mediation episodes, during which they were instructed to focus on loving kindness towards a subject. The results found that participants had decreased heart rate.

Research suggests direct, loving interactions with those who are close to us have many stress-reducing benefits. So when you are shopping for gifts, remember that spending time is more important than spending money. To read more studies about love and stress reduction, visit the BIOPAC publication page.

BIOPAC offers a variety of equipment that can be used in studies similar to the ones presented. To find more information on solutions for recording and analyzing signals such as EEG, EMG, respiration, and EDA using the MP160/MP150, MP36, and other platforms, you can visit the individual application pages on the BIOPAC website. 

BIOPAC Systems, Inc. provides life science researchers and educators with data acquisition and analysis systems that inspire people and enable greater discovery about life. Visit us at www.biopac.com.

The Physiology of Election Decision-Making

The psychophysiological factors of stress, the behaviors of others, and of introception can play major roles in decision-making, and BIOPAC systems provide measurements of how physiological factors such as these influence decisions.

People experienced varying stress levels because of the 2016 US presidential election. There are a variety of factors that can impact voting behaviors and decision-making. Several recent studies using BIOPAC systems investigated the psychophysiological effects of stress, the behaviors of others, and introception on decision-making.

Stress has been shown to be very influential in decision-making. In their study, Yamakawa, Ohira, and Mastunga Isowa (2016) investigated effects of acute stress and risk taking in decision-making. Participants were asked to perform a decision-making choice where they either kept or bet the money they were given. Cardiodynamic activity was measured with ECG using a BIOPAC MP system. Results suggest that with an increase in cortisol, adrenaline, heart rate, and subjective stress, participants were likely to make fewer risky choices. So, high levels of stress may be key in helping make better decisions when selecting a future president.

Perhaps it’s not stress that will influence the choice of the next POTUS (President of the United States), but rather the behaviors of others. Work by Bault, Joffily, Rustichini, and Coricelli (2011) sought to compare private and social decision-making to discover the effect of social comparison on risky choices. The objective of the study was to understand more about how individuals evaluated the outcomes of their decisions in private as opposed to in a social context. Combining data from functional MRI (FMRI) and skin conductance recordings, subjects’ reactions were measured using a BIOPAC MP150 System. Researchers found that participants took significantly longer to make a decision in a social setting than in a private one.

In the end, many feel that it is important to listen to your heart when deciding who you find qualified to be the next president. A study by Dunn et al. (2010) examined whether introception moderates the coupling of bodily responses to emotional experience and intuitive decision-making. Bodily response and heart rate were recorded using a BIOPAC Research System and electrodes to measure introception through changes in heart rate. Researchers found that introception was not related to arousal, valence ratings, or heart rate response to images.

For more information on BIOPAC’s wide range of tools for recording, displaying, and analyzing physiological measurements from human and animal subjects including respiration, heart rate variability, ECG and EDA, visit BIOPAC’s  psychophysiology page and view BIOPAC’s full line of electrodes, amplifiers, and wearable, wireless transmitters and loggers.

BIOPAC Systems, Inc. provides life science researchers and educators with data acquisition and analysis systems that inspire people and enable greater discovery about life. Visit us at www.biopac.com.

Respiration and ECG

By Alan Macy, BIOPAC Systems, Inc. The mechanical relationship between the diaphragm and heart and Respiratory Sinus Arrhythmia (RSA). are two influences of respiratory activity on the electrocardiogram (ECG).

By Alan Macy, BIOPAC Systems, Inc.

There are two influences of respiratory activity on the electrocardiogram (ECG). The first influence is characterized by the mechanical relationship between the diaphragm and heart. The second influence is a consequence of respiratory action on the vagus nerve and is known as Respiratory Sinus Arrhythmia (RSA).

  1. The position and movement of the diaphragm determine the position of the heart because the pericardium is firmly attached to the central tendon of the diaphragm. With deep inspiration, the diaphragm contracts and becomes flatter and less dome-shaped. As it does, the heart descends, moves backward, and rotates to the right so that it becomes narrower and more vertical. The apex beat is lower and more medial. During deep expiration, the diaphragm relaxes, elevates, and becomes more dome-shaped, and movements of the heart are the converse of those that occur during deep inspiration. The degree of the directional movements of the heart during quiet breathing is similar, but reduced, compared to deep breathing and, in some persons, may be hardly noticeable. Diaphragmatic breathing cyclically affects the position of the heart, thus modifying the ECG.
  2. Heart rate increases during inhalation and decreases during exhalation. Heart rate is normally controlled by centers in the medulla oblongata. One of these centers, the nucleus ambiguus, increases parasympathetic nervous system input to the heart via the vagus nerve. The vagus nerve decreases heart rate by decreasing the firing rate of the sinoatrial (SA) node. The SA node is the “pacemaker” of the heart. Upon expiration, the cells in the nucleus ambiguus are activated and heart rate slows down. In contrast, inspiration triggers inhibitory signals to the nucleus ambiguus and consequently the vagus nerve remains unstimulated. When recording the ECG, this phenomenon is experienced as subtle changes in the R-R interval that appears synchronized with respiration. This is the time period between two “R” waves on an electrocardiogram. The R-R interval associated with the ECG is shortened during inspiration and prolonged during expiration.

For more information on BIOPAC’s wide range of tools for recording, displaying, and analyzing ECG measurements from human and animal subjects including respiration, heart rate variability, and RSA, visit BIOPAC’s electrocardiography pages and view BIOPAC’s full line of electrodes, amplifiers, and wearable, wireless transmitters and loggers.

BIOPAC Systems, Inc. provides life science researchers and educators with data acquisition and analysis systems that inspire people and enable greater discovery about life. Visit us at www.biopac.com.

Electrocardiography (ECG)

Electrocardiography (ECG) is a graph of electrical activity of the heart (cardiac) muscle as it changes over time. The basic principle of the ECG is that periodic waves of propagated electrical stimulation cause cardiac muscle to alternately contract and relax.

By Alan Macy, BIOPAC Systems, Inc

Electrocardiography (ECG) results in a graph of electrical activity of the heart (cardiac) muscle as it changes over time. Cardiac muscle contracts in response to electrical depolarization of the heart muscle cells. The ECG is the measured sum, over time, of this electrical activity as it is recorded from electrode connections.

Willem Einthoven’s contribution to ECG recording technology was the development of the string galvanometer that had improved sensitivity over the capillary electrometer. In 1908, Willem Einthoven published a description of a medically useful ECG recording system. This ECG system employed a specific lead connection method presently known as the Einthoven lead system. The Einthoven lead vectors are based on the assumption that the heart is located in a conductive volume. The Einthoven lead vectors are defined as:

Lead I: LA – RA

Lead II: LL – RA

Lead III: LL – LA

Where:

LA is Left Arm

LL is Left Leg

RA is Right Arm

The basic principle of the ECG is that periodic waves of propagated electrical stimulation cause cardiac muscle to alternately contract and relax. These electrical stimulation waves are transmitted from cardiac muscle cell to cell via gap junctions that connect between the cells. The electrical waves spread through the cardiac muscle cells because of cascaded changes in ions between intracellular and extracellular fluid. When the cardiac muscle cells are in a resting (polarized) state, the insides are negatively charged compared to the outsides. Cell membrane pumps maintain this electrically polarized state. Contraction of cardiac muscle is triggered by depolarization. Following depolarization, the cardiac muscle cells return to their resting charge. This process is called repolarization. These waves of depolarization and repolarization result in a changing electrical potential and can be detected by placing electrodes on the surface of the body.

The normal cardiac cycle begins with spontaneous depolarization of the sinoatrial (SA) node, a small volume of specialized tissue located in the right atrium. The SA node sets the rate of the heartbeat. The SA generated wave of electrical depolarization then spreads through the right atrium and across the inter-atrial septum into the left atrium causing the atria to contract. This contraction pushes blood into the ventricles. The atria are separated from the ventricles by a ring of non-conductive tissue. Accordingly, the only conductive path of electrical depolarization, from atria to ventricles, is through the atrioventricular (AV) node. The AV node is a cluster of cells in the center of the heart between the atria and ventricles. The AV node is a pathway that slows the electrical depolarization wave before it enters the ventricles. The wave of depolarization travels down the interventricular septum, through the His-Purkinje fiber network, to the left and right ventricles. The AV node delay gives the atria time to contract, before the ventricles do, to establish robust pumping action. In addition, with normal conduction, the two ventricles contract simultaneously to further maximize cardiac performance. After a volume of cardiac muscle cells depolarizes, the cells repolarize for the next cardiac cycle.

The net (average) path of electrical depolarization, through the heart, is known as the electrical axis. A fundamental ECG measurement principle is that when the wave of electrical depolarization travels toward a recording lead, this results in a positive voltage on that lead. When the wave travels away from a recording lead this results in a negative voltage on that lead. During repolarization, net wave activity towards or from a recording lead results in the opposite polarity as compared to depolarization.

The nature of the repolarization wave is different, from that of the depolarization wave, in that repolarization is not a propagating phenomenon. Cardiac muscle cell repolarization only occurs after the depolarization action potential duration, so cell repolarization does not depend on the repolarization of an adjoining cell. Assuming the action potential of all cells have equal duration, the repolarization wave would follow the same sequence as depolarization wave. However, in considering the entire extent of cardiac muscle, action potential duration is not identical between cells.

Meaning of ECG waves –

P wave: Depolarization of the right and left atria

QRS complex: Depolarization of the ventricles

T wave: Repolarization of ventricles

Meaning of ECG intervals –

PQ interval: Time period between start of atrial depolarization to start of ventricular depolarization

QRS duration: Time period of ventricular depolarization

QT interval: Time period between start of ventricular depolarization and end of ventricular repolarization

RR interval: Time period of complete cardiac cycle (inverse of heart rate).


For more information on BIOPAC’s wide range of tools for recording, displaying, and analyzing ECG measurements from human and animal subjects, visit BIOPAC’s electrocardiograpy, epages and view BIOPAC’s full line of electrodes, amplifiers, and wearable, wireless transmitters and loggers.

BIOPAC Systems, Inc. provides life science researchers and educators with data acquisition and analysis systems that inspire people and enable greater discovery about life. Visit us at www.biopac.com.

Ensuring Error-free NIBP Measurements & Accurate Data

Correct subject set-up of upper arm cuff, CNAP® NIBP finger sensor and CNAP® controller is essential to ensure accurate data reading and collection of continuous blood pressure and hemodynamics with the NiBP 100D throughout the measurement.

By Dr. Jürgen Fortin, CEO, CNSystems

The NIBP100D provides proven accuracy for blood pressure and, using the  NIBP100-HD, full hemodynamics with validation in a number of settings and against research and clinical gold standards. Subject setup with the NIBP100D upper arm cuff and reusable finger sensor is extremely easy, however, please keep the following practical tips in mind to ensure accurate data collection:

1. Upper arm Cuff: Sizing and placement

Over the years, upper arm cuffs have become a standard measurement in basic research setup providing brachial pressure intermittently (timed intervals) rather than continuously (for every heart beat).

The NIBP100D has an upper arm cuff (Suntech Medical) integrated to provide calibration for the continuous finger sensor. For accurate calibration please mind the following steps:

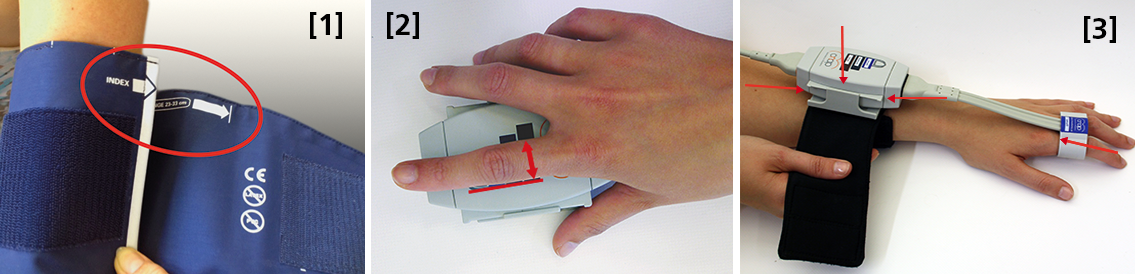
 Size: using a too small or too big upper arm cuff can lead to significant over- /or under- reading of blood pressure. Always ensure you choose the right size ( four sizes are provided with the NIBP100D) by using the range marker on the inside of the cuff–see image #3 in the photo above or review setup procedures here:

  • When wrapping the cuff around the upper arm before fixing the Velcro, ensure the white “index” arrow points into the indicated range area. If it does not, use the bigger or the smaller cuff! 
  • Placement: always align the artery marker (white arrow) on the cuff with the brachial artery (in the crook of the arm). The cuff can be placed ipsilaterally or contralaterally to the arm with the CNAP finger sensor on.
  • Wrapping: pull the upper arm cuff so tight that you could still get about 2 fingers under the wrapped cuff (air volume).

SunTech has developed a short video on the basics of measuring blood pressure. Although designed for a clinical audience, the video provides good information for researchers. Watch the SunTech NBP training video here.

2. CNAP finger sensor: Sizing and placement

Using a too small or too big finger sensor cuff can distort the continuous blood pressure readings. Avoid placing the sensor on finger joints, which may lead to a poor or even no signal. 

Size: Choose the right size from three different sizes by using the size indicator on the top of the CNAP Controller:

  • Put the proximal phalanx of the index finger on the indicator align with the grey line on the left. Choose the sensor size indicated on the shortest bar which is still visible.
  • Always use the larger sensor if you are in doubt about the size.
  • In some subjects it may be difficult to place the finger sensors on the proximal limb (i.e. finger-arthrosis, too short finger joints). In these cases, try placing the finger sensors on the middle limbs. However, make sure that the sensors are not placed over the finger joints. Hold the sensor in place or use medical tape until the sensor is inflated (start of measurement).

With the CNAP Software V5.2, sensor sizing becomes even easier—the size of the finger sensor is checked automatically upon start and the software gives notice if it does not fit. 

  • Placement: The finger sensor is placed on two neighboring fingers and slid back fully to the proximal limb!
  • Make sure not to place them on the finger joints!

3. CNAP Controller:  correct placement

The slide for the CNAP Controller allows for slight hand movement without dislocating the CNAP finger sensor. It is very important that the CNAP Controller is correctly placed:

  • Placement: Make sure that the CNAP Controller is placed in central position of the slide.
  • If the CNAP Controller is not placed correctly, the CNAP finger sensor might be pushed forward on the finger joints. 
  • View detailed pictures of CNAP Monitor Set Up Overview here.

4. Further recommendations

4.1. Start of measurement

  • Make sure that the subject keeps still and does not move his/her hand.
  • Do not change body posture during until a continuous signal is displayed!

4.2. Improving signal quality if signal is poor

  • Warm up fingers to improve blood flow (cover hand, hold hand in warm water prior to measurement, use disposable exam glove)
  • Check position of CNAP finger sensor: the sensor must not be placed on the finger joints.
  • Check if CNAP finger sensor size is correct.
  • Try to measure on the other hand.

4.3 Manual calibration with NBP

  • Trigger a manual NBP after moving or repositioning the subject/the subject’s hand or whenever hydrostatic change/offset happens.
  • Trigger a manual NBP whenever you feel that an update to the NBP reading may be beneficial
  • Triggering a manual NBP is possible at any time and in any mode. 
  • Additional information—view the CNAP NIBP100D operator’s manual here.

4.4 Removal of CNAP finger sensor

  • Do not remove the CNAP finger sensor when a measurement is still in progress. Stop measurement first, then remove the sensor!

 4.5. Battery

  • Never completely discharge the battery.
  • Immediately connect to power supply if battery charge status is below 25%.

To read a recent study which evaluated the agreement of the continuous noninvasive cardiac output measurements by CNAP in comparison with cardiac output measurements obtained invasively using transpulmonary thermodilution (TDCO), go here.

The NIBP100D provides validated, proven accuracy for blood pressure and, with the NIBP100-HD model, full hemodynamics. To ensure the acquisition of good data and accurate readings, researchers should follow the setup procedures outlined above.
For more information on BIOPAC’s Noninvasive Blood Pressure monitoring and measurement systems and advanced functionality in the area of cardiovascular hemodynamics, to include CNAP noninvasive blood pressure systems, visit BIOPAC’s NIBP page or view BIOPAC’s NIBP amplifiers (small animal applications are also supported) and related equipment for a wide variety of research applications.

BIOPAC Systems, Inc. provides life science researchers and educators with data acquisition and analysis systems that inspire people and enable greater discovery about life. Visit us at www.biopac.com.

error: Content is protected !!