Best Practices for Recording & Analyzing Data

Over the past several years, tools and techniques for recording and analyzing physiological data recording have seen steady and marked improvement. Modern life science data acquisition systems such as the MP160 System and powerful research-grade software suites such as AcqKnowledge bring high-end physiology tools within reach of the smallest lab. Even with continuing advances and reduced margin for error, it remains prudent to follow some fundamental guidelines for maximizing data quality and clarity.

Preparation is important. First, invest time exploring the system if it’s new or unfamiliar. An overview of the documentation, training videos, and available webinars, as well as some practice runs with the hardware and software will save time and effort when the time comes to conduct a study. This will also build proficiency at identifying the differences between good and poor data.

Next, familiarize yourself with the type of electrodes and/or transducers necessary for the physiological signals you will be acquiring, which includes proper electrode and skin site preparation. For example, gently abrading the skin prior to applying electrodes is normally recommended for most signal types, except for electrodermal activity (EDA), in which case it’s vital to NOT abrade the skin beforehand. It is also helpful to wait at least 5 minutes before starting a recording, which enables the electrode gel to be absorbed into the skin, helping reduce the impedance.

Performing an impedance check to ensure that the electrodes are making good contact with the skin is also highly recommended. This task is made easier by using an Electrode Impedance Checker (such as EL-CHECK), a simple device for quickly measuring the resistance between the skin and the electrode that provides an LED readout of the skin/electrode contact quality. If the resistance is too high (indicating poor contact) proper adjustments can be made before starting an experiment.

For certain signal types, excessive participant movement can introduce unwanted artifact into the signal, resulting in poor or skewed data. Make sure the participant remains as still as possible during studies involving these signals. Using tape to attach the electrode leads to the skin and keep them from moving excessively can also be helpful.

A thorough check of the system and all connections, cameras, and other hardware is important, so that any problems with equipment or setup can be addressed in advance, thus avoiding a show-stopping issue in the midst of an experiment. This would include performing a pilot study with trained personnel in order to head off any unforeseen issues with the data collection.

Creating a lab setup conducive to a relaxed environment for the participant and technician alike will yield better results. This means eliminating clutter, noise, and other distractions that can affect comfort and attention span. Some labs even avoid having their staff wear lab coats because this can heighten participant nervousness.

Keeping detailed notes on successful lab setups is also helpful and will streamline the preparation process for future experiments. Additionally, creating and saving graph templates for regularly-repeated experiments will save further time and effort.

For more about the fundamentals of recording great data, we invite you to view this free on-demand webinar Fundamentals of Physiology Recording.


BIOPAC offers a wide array of wired and wireless equipment that can be used in your research. To find more information on solutions for recording and analyzing signals such as ECG, heart rate, respiration and more using any platforms mentioned in this blog post, you can visit the individual application pages on the BIOPAC website.

Photo by John Schnobrich on Unsplash

Stressing over the effects of stress

Several studies show chronic stress is typically detrimental to health, while acute stress may be linked to positive effects in addition to the negative counterparts

With April comes National Stress Awareness Month, and it bears noting that different types of stress have varying effects. Where chronic stress is typically detrimental to health, acute stress may be linked to positive effects in addition to the negative counterparts. But is this trade-off worth it?

In a biological psychology experiment testing the effect of oxytocin on acute social stress, researchers found different results between men and women. Subjects underwent several stress tasks while their electrocardiography and impedance cardiography were recorded with a BIOPAC MP Research System and amplifiers. The researchers found that after being given oxytocin during the stressful event, men had less negative affect and women had greater math performance (compared to the control group).

A neurobiology study examined the effect stress had on an extinction memory process when a competing association was paired with a previously aversive cue. To test this, participants were presented with two images, one that was paired with a shock from a BIOPAC bar electrode, and one that was not. Extinction memory training immediately followed this stimulus, with extinction retrieval testing following a day later. Data gathered by a BIOPAC data acquisition system suggested significantly lower retrieval in the group that experienced the acute stress stimulus.

Another biopsychology experiment measured the effect of acute stress on pro-inflammatory cytokine levels in the blood. BIOPAC equipment was used to measure ECG while participants were given the Trier Social Stress Test. After reviewing the data and blood samples, the researchers determined that levels of the cytokine cell, interleukin-1β, increased significantly immediately after the stress test.

The physiological and psychological impacts of stress are clearly multifaceted with many potential results. In some situations, a heightened positive affect or greater analytical thinking may be beneficial. But is this boost in mental performance worth the increase of inflammatory cells and lower memory retention? As with many aspects of life, moderation is the safest answer, ensuring the negative effects do not become chronic problems.

For more information on BIOPAC’s wide range of tools for recording, displaying, and analyzing ECG measurements from human and animal subjects including respiration, heart rate variability, and RSA, visit BIOPAC’s electrocardiography pages and view BIOPAC’s full line of electrodes, amplifiers, and wearable, wireless transmitters and loggers.

BIOPAC Systems, Inc. provides life science researchers and educators with data acquisition and analysis systems that inspire people and enable greater discovery about life. Visit us at www.biopac.com.

The Physiology of Election Decision-Making

The psychophysiological factors of stress, the behaviors of others, and of introception can play major roles in decision-making, and BIOPAC systems provide measurements of how physiological factors such as these influence decisions.

People experienced varying stress levels because of the 2016 US presidential election. There are a variety of factors that can impact voting behaviors and decision-making. Several recent studies using BIOPAC systems investigated the psychophysiological effects of stress, the behaviors of others, and introception on decision-making.

Stress has been shown to be very influential in decision-making. In their study, Yamakawa, Ohira, and Mastunga Isowa (2016) investigated effects of acute stress and risk taking in decision-making. Participants were asked to perform a decision-making choice where they either kept or bet the money they were given. Cardiodynamic activity was measured with ECG using a BIOPAC MP system. Results suggest that with an increase in cortisol, adrenaline, heart rate, and subjective stress, participants were likely to make fewer risky choices. So, high levels of stress may be key in helping make better decisions when selecting a future president.

Perhaps it’s not stress that will influence the choice of the next POTUS (President of the United States), but rather the behaviors of others. Work by Bault, Joffily, Rustichini, and Coricelli (2011) sought to compare private and social decision-making to discover the effect of social comparison on risky choices. The objective of the study was to understand more about how individuals evaluated the outcomes of their decisions in private as opposed to in a social context. Combining data from functional MRI (FMRI) and skin conductance recordings, subjects’ reactions were measured using a BIOPAC MP150 System. Researchers found that participants took significantly longer to make a decision in a social setting than in a private one.

In the end, many feel that it is important to listen to your heart when deciding who you find qualified to be the next president. A study by Dunn et al. (2010) examined whether introception moderates the coupling of bodily responses to emotional experience and intuitive decision-making. Bodily response and heart rate were recorded using a BIOPAC Research System and electrodes to measure introception through changes in heart rate. Researchers found that introception was not related to arousal, valence ratings, or heart rate response to images.

For more information on BIOPAC’s wide range of tools for recording, displaying, and analyzing physiological measurements from human and animal subjects including respiration, heart rate variability, ECG and EDA, visit BIOPAC’s  psychophysiology page and view BIOPAC’s full line of electrodes, amplifiers, and wearable, wireless transmitters and loggers.

BIOPAC Systems, Inc. provides life science researchers and educators with data acquisition and analysis systems that inspire people and enable greater discovery about life. Visit us at www.biopac.com.

Start the First Class with EDA and Emotional Responses!

By Howard Iver Thorsheim, Ph.D., St. Olaf College. I wanted to start the first day of my class with an activity that would engage students’ curiosity and enthusiasm, to set the stage for introducing the course and going over the syllabus!

By Howard Iver Thorsheim, Ph.D., St. Olaf College

Howard Iver Thorsheim is Professor of Psychology and Neuroscience at St. Olaf College, Northfield, Minnesota, USA. In these blogs he offers his first-person insights into effective teaching techniques gleaned from a combination of scholarly research and over 40 years in the classroom.

I find Electrodermal Activity (EDA) to be a great way to demonstrate psychophysiology measurement at the beginning of a course: students easily understand it. It takes little time to set up and record because it only involves two sensors on the finger tip pads. It works every time as a “window” to emotions with clear responses to a variety of stimuli (e.g., visual, auditory, gustatory, olfactory).

I show students a picture of a rock climber climbing a cliff, then ask them to jot down some notes of what they might feel when climbing like the woman pictured, and then buzz with a person sitting next to them about what they wrote. I ask for a show of hands of who has mentioned the bag hanging from the climber’s belt. Depending on the amount of time I choose to devote to the activity, I lead the entire class through a number of probing questions; for example:

“Who knows what the bag is for?” (Chalk for fingers.)

“Why does the climber use chalk?”  (Reduce slipperiness from sweat.)

“Why do fingers get slippery?” (Emotion.)

“What other people encounter emotion daily?”

I then set the stage for EDA: changes in skin conductivity are due to the amount of sweat in sweat glands of the skin, which are produced by the sympathetic branch of the autonomic nervous system responding to emotion.

I explain to the class that I will be the first volunteer, and guarantee that no shock is involved using BIOPAC equipment. I connect electrodes on the volar pads of my index and middle fingers, and take a deep breath, which will generate EDA. Then I tell the class I will think of emotion-producing situations, and ask them if they can see any EDA detected by the equipment. There will be a few good chuckles because in anticipation of doing so, my response will already appear. Two of several easy classroom measurements of EDA include latency (about 1 to 3 seconds between a stimulus and beginning of the electrodermal response), and peak amplitude (the maximum size of the response). My eBook Doing Psychophysiology–Getting Started on the Apple iBooks Store has a graphic narrative and a one-minute video explanations about EDA, as well as other psychophysiology measures you can show your students. The Biopac Student Lab system also includes two lessons in which students can engage in interactive learning activities while measuring EDA; a lesson on the principles of biofeedback and one on the standard physiological measures of a polygraph.

An excellent summary of Electrodermal Activity is provided in the following chapter:

Dawson, M. E., Schell, A. M. & Fillion, D. L. (2007). The electrodermal system. In J. T. Cacioppo, L. G. Tassinary, & G. G. Berntson (Eds.). Handbook of psychophysiology (3rd ed. pp. 159-181). New York: Cambridge University Press.

Learn more about BIOPAC’s education solutions, including complete teaching systems for psychophysiology and the life sciences. BIOPAC also provides a wide range of research systems for recording, displaying, classifying, and analyzing psychophysiological measurements.

BIOPAC Systems, Inc. provides life science researchers and educators with data acquisition and analysis systems that inspire people and enable greater discovery about life. Visit us at www.biopac.com.

Professor Thorsheim is a licensed Psychologist, educator, and author. He has published or presented over 125 papers, journal articles, books, book chapters or monographs, and received a patent in 1985 as a co-inventor for an educational book design with interactive elements. His work has been funded by marquee foundations across the globe. His most recent work is Doing Psychophysiology: Getting Started, available from Knowledge Growers, Inc., available as an iBook download in 51 countries.


Electrocardiography (ECG)

Electrocardiography (ECG) is a graph of electrical activity of the heart (cardiac) muscle as it changes over time. The basic principle of the ECG is that periodic waves of propagated electrical stimulation cause cardiac muscle to alternately contract and relax.

By Alan Macy, BIOPAC Systems, Inc

Electrocardiography (ECG) results in a graph of electrical activity of the heart (cardiac) muscle as it changes over time. Cardiac muscle contracts in response to electrical depolarization of the heart muscle cells. The ECG is the measured sum, over time, of this electrical activity as it is recorded from electrode connections.

Willem Einthoven’s contribution to ECG recording technology was the development of the string galvanometer that had improved sensitivity over the capillary electrometer. In 1908, Willem Einthoven published a description of a medically useful ECG recording system. This ECG system employed a specific lead connection method presently known as the Einthoven lead system. The Einthoven lead vectors are based on the assumption that the heart is located in a conductive volume. The Einthoven lead vectors are defined as:

Lead I: LA – RA

Lead II: LL – RA

Lead III: LL – LA

Where:

LA is Left Arm

LL is Left Leg

RA is Right Arm

The basic principle of the ECG is that periodic waves of propagated electrical stimulation cause cardiac muscle to alternately contract and relax. These electrical stimulation waves are transmitted from cardiac muscle cell to cell via gap junctions that connect between the cells. The electrical waves spread through the cardiac muscle cells because of cascaded changes in ions between intracellular and extracellular fluid. When the cardiac muscle cells are in a resting (polarized) state, the insides are negatively charged compared to the outsides. Cell membrane pumps maintain this electrically polarized state. Contraction of cardiac muscle is triggered by depolarization. Following depolarization, the cardiac muscle cells return to their resting charge. This process is called repolarization. These waves of depolarization and repolarization result in a changing electrical potential and can be detected by placing electrodes on the surface of the body.

The normal cardiac cycle begins with spontaneous depolarization of the sinoatrial (SA) node, a small volume of specialized tissue located in the right atrium. The SA node sets the rate of the heartbeat. The SA generated wave of electrical depolarization then spreads through the right atrium and across the inter-atrial septum into the left atrium causing the atria to contract. This contraction pushes blood into the ventricles. The atria are separated from the ventricles by a ring of non-conductive tissue. Accordingly, the only conductive path of electrical depolarization, from atria to ventricles, is through the atrioventricular (AV) node. The AV node is a cluster of cells in the center of the heart between the atria and ventricles. The AV node is a pathway that slows the electrical depolarization wave before it enters the ventricles. The wave of depolarization travels down the interventricular septum, through the His-Purkinje fiber network, to the left and right ventricles. The AV node delay gives the atria time to contract, before the ventricles do, to establish robust pumping action. In addition, with normal conduction, the two ventricles contract simultaneously to further maximize cardiac performance. After a volume of cardiac muscle cells depolarizes, the cells repolarize for the next cardiac cycle.

The net (average) path of electrical depolarization, through the heart, is known as the electrical axis. A fundamental ECG measurement principle is that when the wave of electrical depolarization travels toward a recording lead, this results in a positive voltage on that lead. When the wave travels away from a recording lead this results in a negative voltage on that lead. During repolarization, net wave activity towards or from a recording lead results in the opposite polarity as compared to depolarization.

The nature of the repolarization wave is different, from that of the depolarization wave, in that repolarization is not a propagating phenomenon. Cardiac muscle cell repolarization only occurs after the depolarization action potential duration, so cell repolarization does not depend on the repolarization of an adjoining cell. Assuming the action potential of all cells have equal duration, the repolarization wave would follow the same sequence as depolarization wave. However, in considering the entire extent of cardiac muscle, action potential duration is not identical between cells.

Meaning of ECG waves –

P wave: Depolarization of the right and left atria

QRS complex: Depolarization of the ventricles

T wave: Repolarization of ventricles

Meaning of ECG intervals –

PQ interval: Time period between start of atrial depolarization to start of ventricular depolarization

QRS duration: Time period of ventricular depolarization

QT interval: Time period between start of ventricular depolarization and end of ventricular repolarization

RR interval: Time period of complete cardiac cycle (inverse of heart rate).


For more information on BIOPAC’s wide range of tools for recording, displaying, and analyzing ECG measurements from human and animal subjects, visit BIOPAC’s electrocardiograpy, epages and view BIOPAC’s full line of electrodes, amplifiers, and wearable, wireless transmitters and loggers.

BIOPAC Systems, Inc. provides life science researchers and educators with data acquisition and analysis systems that inspire people and enable greater discovery about life. Visit us at www.biopac.com.

Electrodes for Physiological Recording

By Alan Macy, BIOPAC Systems, Inc.

In the context of human physiological recording, an electrode is a conductive probe which is used to sense the presence of biopotentials arising at points in the body. When biopotentials are generated in the body, they can be sensed using a differential voltage amplifier. When a biopotential source activates, electrons are moved within the volume of the source thus creating a voltage potential difference (positive to negative) across the volume of the source. Biopotential sources are continually changing in the body, so the associated differential voltage potentials change too.

Electrodes establish an equipotential area when attached to a location on or in the body. An equipotential area means that anywhere on the surface area of the electrode the potential (voltage) will be the same. This is because electrodes are substantially more conductive than the surrounding tissue. To record a biopotential signal, two electrodes are required. The pair of electrodes will measure the voltage which is impressed between the two equipotential areas created by the electrodes.

Biopotential recording electrodes are of two types, namely invasive and noninvasive. Invasive electrodes are designed to sense biopotentials inside the body, meaning they are inserted inside the body, past the skin boundary. Historically, invasive electrodes have been designed as needles or wires to better penetrate the skin. By controlling the conductive and insulating areas of the needle or wire, the electrode can be used to sense biopotentials originating at any depth in the body volume. If the invasive electrode is to be inserted into the body for a long time, then the electrode might take a different shape, such as a conductive disk which can be sutured into place.

Noninvasive electrodes are designed to sense biopotentials which manifest on the outside skin surface. These kinds of electrodes do not penetrate the skin surface layer. Because the body is a volume conductor, biopotentials originating anywhere in the body travel to the entire skin surface area. As an example, a polarized biopotential wave is generated by the heart during the course of each beat. This signal is easily detectable between any two locations on the body’s skin surface that are physically oriented to different sides of the heart.

In practice, it’s best to collect biopotential data as near to the biopotential generating site as possible for the best recording. This is because the body generates a large number of biopotential signals, sourced from a variety of excitable cells. Because the body is conductive, a myriad of these signals will superimpose at any body recording location. As the distance grows between a particular source and the differential recording location, the source signal attenuates. Sources, that are subject to a range of attenuation, will simply add to the desired signal being measured, as they are included in the volume conduction path defined by the differential biopotential recording.

When collecting biopotential data from surface electrodes, the contact area of the electrode has an impact on the frequency and amplitude components recorded in the biopotential. Because the body volume is relatively conductive, increased electrode surface area has a tendency to reduce biopotential amplitudes and suppress higher frequency components. This happens because multiple, and often uncorrelated, biopotential sources in the body can act in random opposition as the various biopotentials superimpose in the conductive body volume and then express on the skin surface. A biopotential averaging process takes place in the body tissue volume and an aspect of the averaged signal is reflected on the skin surface area. This biopotential signal averaging quality increases in scope as the size the measurement surface electrodes increases.

If a biopotential electrode is reduced in size and then inserted into the body near the location of interest, then measured signals will typically increase in amplitude and frequency components. These kinds of electrodes are called needle or wire electrodes and typically have an insulating needle shaft with a conductive tip. Despite certain benefits of needle electrodes, complications can arise when breaking the skin barrier and inserting foreign objects into a subject’s body. Needle electrodes can be difficult to use because they have smaller surface area than surface electrodes. Furthermore, smaller contact surface area always means that the electrode contact impedance is higher. Very high contact impedance, typically in excess of 1 Mohm, specifies the need for excellent lead shielding and specialized input amplifier characteristics.

Biopotential measurements from surface electrodes on the body have material harmonic content of less than 500 Hz. Nearly all of the signal power which can be collected from surface electrodes is between DC and 500 Hz. If the electrode is smaller, such as a conductive-tipped needle, and inserted through the skin surface to near the biopotential of interest, biopotential signal frequencies can exceed 10,000 Hz.

For more information on BIOPAC’s wide range of tools for recording, displaying, and analyzing biopotential measurements from human and animal subjects, visit BIOPAC’s electrocardiograpy, electromyography,  or electroencephalograpy pages and view BIOPAC’s full line of electrodes, amplifiers, and wearable, wireless transmitters and loggers.

BIOPAC Systems, Inc. provides life science researchers and educators with data acquisition and analysis systems that inspire people and enable greater discovery about life.  Visit us at www.biopac.com.

Electroencephalography (EEG) Pt. 2

Short-term Electroencephalography or EEG measurements are typically performed in synchrony with well-controlled, environmental, stimuli. Signal-averaging measurements, of this type, are known as Event Related Potentials (ERPs).

By Alan Macy, BIOPAC Systems, Inc.

This blog is a continuation of the previous discussion of Electroencephalography or EEG. Short-term Electroencephalography or EEG measurements are typically focused on the nature of cognition. These types of recordings are typically performed in synchrony with well-controlled, environmental, stimuli. Signal-averaging measurements, of this type, are known as Event Related Potentials (ERPs). There are a range of ERP signals, stretching between 50 ms to many seconds, with respect to the occurrence of the event. ERPs require signal averaging methods, to be observed, because their amplitude levels (0.2-2 uV) are usually lower than the ambient EEG signal level.

ERPs can be generated by a wide range of stimuli. The stimulus event can be targeted to any specific human sense or combination of senses (auditory, visual, olfactory, touch or taste). ERPs indicate the superimposed potentials of neuronal activity that synchronously generate when a subject processes sensory information. There are two general types of human subject ERPs. Early ERP wave components occur before 100 milliseconds after the stimulus. Late ERP components occur after 100ms after the stimulus. Early ERPs are known as exogenous potentials and late ERPs are known as endogenous potentials. Exogenous potentials depend on neuronal sensory structure responses that occur prior to cognition.  Endogenous potentials depend on cognitive responses to the sensory stimuli.

Slow Cortical Potentials (SCPs) are a class of ERPs that are characterized by slowly-moving, stimulus-related changes in the EEG signal. SCPs originate in cell concentrations in the top cortical layer of the brain. SCP waves (0.01-3 Hz) are EEG signals that occur before and after stimulus presentation. They encompass such pre-stimulus measures as Contingent Negative Variation (CNV) and Readiness Potential (RP).  The CNV is a slow-changing negative potential that happens between an initial warning and a “go” stimulus.  NV amplitude depends on the subject’s expectation of an imagined, forthcoming event. The RP is associated with the beginning of movement.  The RP precedes movement and is identified as a slow-changing negative potential that maximizes with movement onset. The RP is observed when signal averaging the EEG, from the motor cortex, synchronously with movement.

EEG can be useful to:

  • Monitor alertness and conscious states
  • Evaluate inhibitory control over behavior
  • Locate areas of neural damage
  • Establish levels of cognitive engagement
  • Investigate brain disorders, such as Alzheimer’s, epilepsy and seizures
  • Establish brain / computer interfaces
  • Monitor sleep

For more information on BIOPAC’s wide range of tools for recording, displaying, and analyzing EEG signals from human and animal subjects, including automated EEG analysis, seizure detection, evoked responses and many others, visit BIOPAC’s EEG Analysis page or view BIOPAC’s full line of electrodes, amplifiers, and wearable, wireless transmitters and loggers.

BIOPAC Systems, Inc. provides life science researchers and educators with data acquisition and analysis systems that inspire people and enable greater discovery about life.  Visit us at www.biopac.com.

Electroencephalography (EEG) Pt. 1

An EEG recording can be short or long-term. Shorter-term, signal-averaged, EEG measurements are typically used to evaluate precognitive and cognitive processes with respect to specific stimuli.

by Alan Macy, BIOPAC Systems, Inc.

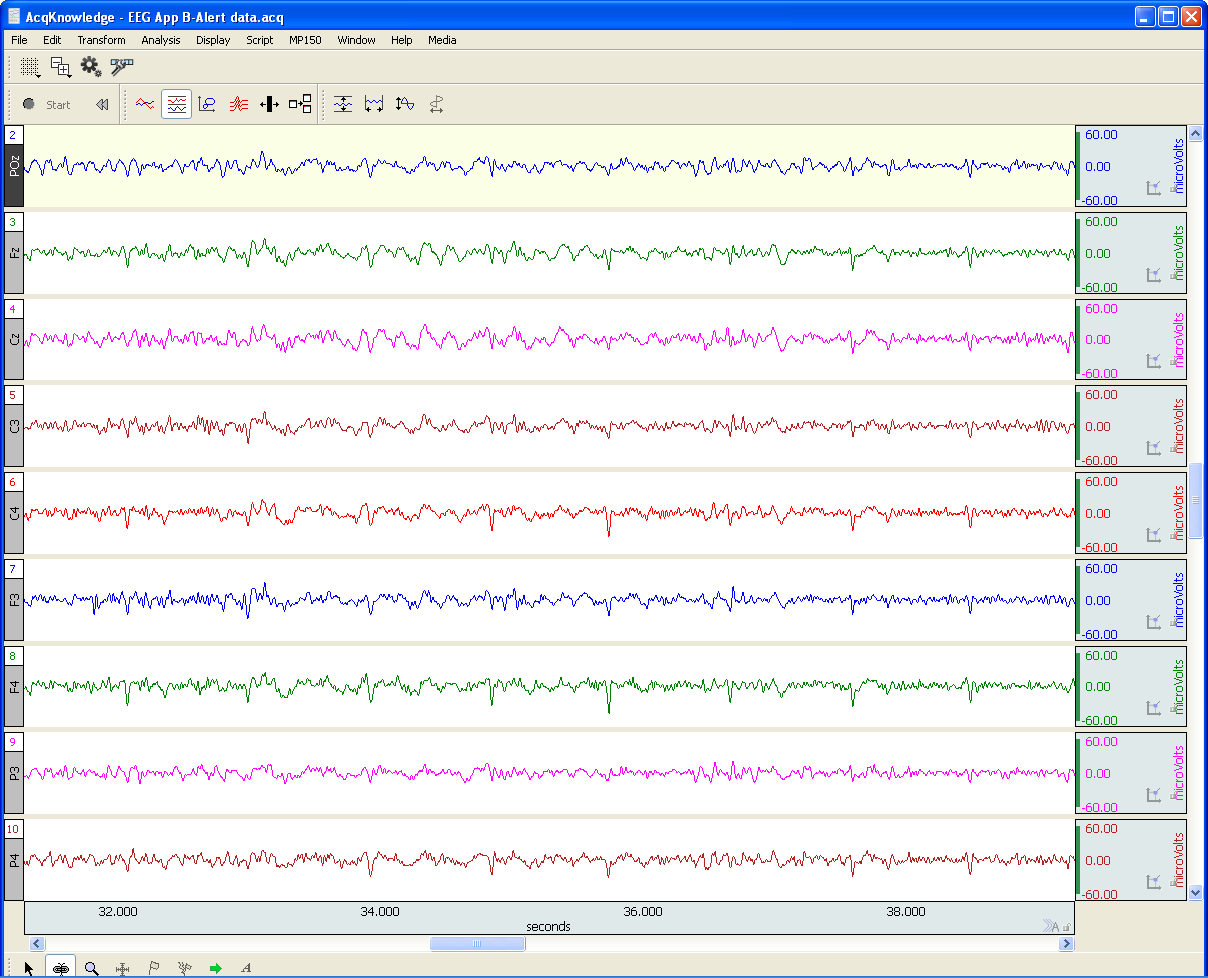
EEG or Electroencephalography is the measurement of differences in electrical potential (voltage) between points on the scalp. These voltages differences are the result of ionic current flow within neurons, and glial cells, in the brain. The measured scalp voltages are primarily in the 200 nV-200 uV amplitude range, 0.01 Hz – 100 Hz frequency range, and are typically simultaneously recorded at multiple sites on the scalp. The EEG is usually collected using the 10-20 electrode montage. This arrangement of electrodes typically references left or right hemisphere electrodes to the left or right earlobe (or mastoid), respectively. However, a wide range of signal referencing methods are used depending on the situational requirements.

An EEG recording (knows as an electroencephalogram) can be short or long-term. Shorter-term, signal-averaged, EEG measurements are typically used to evaluate precognitive and cognitive processes with respect to specific stimuli. These EEG signals have relatively low amplitude levels, typically 200 nV – 2 uV, so signal averaging methods are required to discern these signals from background concurrent EEG sources. Longer-term, non-signal-averaged, EEG measurements are used to discern the subject’s, real-time, conscious state. Different and observable wave rhythms are evident during such recordings. Commonly observed rhythms include: Delta, Theta, Alpha, Beta and Gamma waves. These waves can be continuously recorded and are in the range of 2 uV – 200 uV.

Delta waves (0.5-4 Hz) are considered slow rhythms and tend to be the highest in amplitude. Delta waves are normally the dominant rhythm in infants. Delta waves are found in sleeping adults and consistent Delta is considered abnormal in conscious adults.  Delta waves are low-frequency EEG patterns that increase during sleep in the normal adult.  Although Delta waves are generally prominent during sleep, there are cases when Delta rhythms are recorded from awake individuals. Delta waves may increase during difficult mental activities requiring concentration and other continuous-attention tasks. Delta rhythms depend on activity of motivational systems, in the brain, and participate in the identification of prominent phenomena.  The presence and amplitude of Delta rhythms are highly variable within and between individuals.

Theta waves (4-8 Hz) are considered slow rhythms. Theta waves are normal in children up to 13 years old.  Theta waves are found in sleeping adults and consistent Theta is considered abnormal in conscious adults. Theta rhythms are low-frequency EEG patterns that increase during sleep in the normal adult. Although Theta rhythms are generally prominent during sleep, there are cases when theta rhythms are recorded from awake individuals.  Theta rhythms are involved in memory and emotional regulation. Theta waves will spike during emotional responses to frustrating events or situations.  Theta waves are associated with the inhibition of elicited responses, in that Theta activity has been found to temporarily increase when a person is actively trying to repress a behavioral response. The presence and amplitude of theta rhythms are highly variable within and between individuals.

Alpha waves (8-13 Hz) are considered moderate rhythms and usually seen in the occipital regions of the head and are higher in amplitude on the dominant side. Alpha waves appear when relaxing and closing the eyes. Alpha waves are suppressed when opening the eyes or coming to an alert state. Alpha waves are the primary rhythm observed in relaxed adults and are present during most of life after 13 years old. Each region of the brain has a characteristic Alpha rhythm amplitude and the largest Alpha waves are from the occipital and parietal regions of the cerebral cortex. Alpha rhythms correlate with inhibitory processes in the brain. Reduced Alpha wave occurrence and amplitude, in relation to Delta-Theta activity, is associated with reduced inhibitory control over behavior.

Beta waves (13-30 Hz) are considered fast rhythms. Beta waves are typically observed on both sides of the head and are most evident frontally (executive function). Beta waves may be substantially reduced in areas of cortical damage.  Beta waves are considered normal and are the dominant rhythm in subjects whose eyes are open or are otherwise attentive to external stimuli or exerting specific mental effort. Beta rhythms also occur during rapid eye movement (REM) sleep. In this situation, the typical Alpha rhythm is suppressed and supplanted by Beta waves. This replacement of Alpha rhythm is called desynchronization, or “Alpha block”, because it represents a change in the synchronized activity of neural systems in the brain. It is thought that Beta waves represents arousal of the cortex to a higher state of alertness and may also be associated with memory retrieval.

Gamma waves (30-100 Hz) are considered fast rhythms. Gamma waves are present during mixed sensory processing, such as perceptual tasks that combine hearing and seeing. Gamma waves are also evident during short-term memory matching of recognized sights, sounds or sensations. A reduction in Gamma wave activity might be associated with cognitive decline, especially when compared to Theta wave activity levels.

Long-term EEG signal characteristics are related to consciousness. As conscious activity increases, the dominant EEG rhythms shift to higher frequencies. When asleep, with the exception of REM, the dominant EEG rhythms move to lower frequencies.  In deep sleep, the EEG is characterized by low frequency Delta waves.

This blog is continued in Part 2.

For more information on BIOPAC’s wide range of tools for recording, displaying, and analyzing EEG signals from human and animal subjects, including automated EEG analysis, seizure detection, evoked responses and many others, visit BIOPAC’s EEG Analysis or view BIOPAC’s full line of electrodes, amplifiers, and wearable, wireless transmitters and loggers.

BIOPAC Systems, Inc. provides life science researchers and educators with data acquisition and analysis systems that inspire people and enable greater discovery about life.  Visit us at www.biopac.com.

Electrodermal Activity (EDA)

Typically, EDA is measured as skin conductance and a small direct constant voltage (0.5 vdc) is used as excitation source across the skin electrodes.

By Alan Macy, BIOPAC Systems, Inc.

Electrodermal activity measurement is subject to electrically-related characteristics of the skin. There are two phenomena associated with this type of skin activity. One is skin potential, which is a self-generated potential intrinsic to the skin. This potential is a consequence associated with dissimilar skin layers placed in proximity coupled with the presence and movement of interstitial fluids. An evoked skin potential response is called the sympathetic skin response. This change in skin potential can be evoked by electrical, auditory or magnetic stimulation. The other phenomenon associated with skin electrical activity can be measured when a stimulation (excitation) current is injected through, or a voltage is applied across, attached skin electrodes. The current or voltage stimulation is typically at constant (DC) level, or at low frequency, because the skin impedance is high. The application of excitation current or voltage produces a corresponding voltage or current, respectively, that changes over time subject to physiological state. In these cases, the skin’s resistance, impedance, conductance or admittance is being measured, corresponding to the type of electrical stimulation used.

EDA Measurements – subject to electrical excitation type:

Skin Resistance – Direct Constant Current (not commonly used)

Skin Conductance – Direct Constant Voltage (most commonly used)

Skin Impedance – Alternating Constant Current (not commonly used)

Skin Admittance – Alternating Constant Voltage (sometimes used)

Typically, EDA is measured as skin conductance and a small direct constant voltage (0.5 vdc) is used as excitation source across the skin electrodes. The skin admittance method (alternating constant voltage excitation) may provide some advantages in measurement in that this method does not polarize the skin electrodes during EDA recording. Skin conductance is usually measured in units of “Siemens” although sometimes “mho” is used. The unit “mho” comes from the reverse spelling of “ohm”, the unit of resistance. One mho equals one Siemen.  The conductivity of the skin is small, so values are given in microsiemens (uS) or micromhos (umho).

Changes in the electrically-related characteristics of the skin is correlated to eccrine sweat gland activity. Eccrine glands are in nearly all skin locations and are found, in highest concentrations, on the palms of hands, fingertips and soles of the feet. EDA, measured as skin conductance, is a physiological signal that indicates increased sympathetic nervous system (SNS) activity. This aspect of EDA is representative of changes in the electrical conductance of the skin due to eccrine (sweat) gland activity. SNS activity increases sweat gland secretions. Eccrine glands only receive activation signals from the SNS, so increased EDA is an indicator of increased arousal.

There are two aspects to skin conductance measurements, namely phasic and tonic. Tonic value is the average skin conductance level (SCL), that is relatively consistent over time, and is related to arousal. The phasic component  of skin conductance is the change of the skin conductance, over a short time period, in reaction to a stimulus. For a skin conductance response (SCR), the skin conductance rises in a short time period and then returns to tonic levels. SCRs are characterized by four different parameters: the response peak amplitude, latency of response, rise time to the response peak, and recovery time after peak.

For more information on BIOPAC’s EDA research solutions, including real-time live raw EDA data as well as real-time filtering or calculation channels including High-pass filtered/AC Coupled EDA, visit BIOPAC’s EDA Analysis page or view BIOPAC’s full line of electrodes, amplifiers, and wearable, wireless transmitters and loggers.

Additionally, a link to a recently updated EDA SCR Analysis Guide for Psychological Experiments came be found here.

BIOPAC Systems, Inc. provides life science researchers and educators with data acquisition and analysis systems that inspire people and enable greater discovery about life.  Visit us at www.biopac.com.

Electrocardiogram Waveshape – Pt 1

When recording ECG, it’s important to consider the impacts of electrode placement and amplifier filters on the measured biopotential. Electrode placement is important because different orientations of biopotential surface electrodes with respect to the heart’s position will result in different signal shapes.

By Alan Macy, BIOPAC Systems, Inc.

When recording ECG, it’s important to consider the impacts of electrode placement and amplifier filters on the measured biopotential. Electrode placement is important because different orientations of biopotential surface electrodes with respect to the heart’s position will result in different signal shapes. As the heart contracts and expands, during the course of pumping blood, a time-varying, voltage signal is propagated over the volume of the heart. This voltage signal conducts to the surface of the body and is detectable between any two points on the body that straddle the heart. The signal can look quite different depending on whether the signal is collected from left hand to right hand or from right hand to left leg. When the ECG signal is recorded far from the heart, electrode placement is not critical to obtain similar-looking ECG waveforms when recording over time. As electrodes are placed increasingly close to the heart, then electrode placement becomes quite specific to recreate similar-looking ECG signals. This is because the body is a volume conductor and the heart is not a point-source of electrical signal activity.

The ECG waveform has been specified to consist of frequency components in the range of 0.05 Hz to 150 Hz, even though the characteristic ECG waveform shape is largely composed of components from 0.05 Hz to 35 Hz. However, even if the ECG’s primary waveshape is preserved, bandwidth limits affect usability of the data. For a high-resolution ECG recording, the signal bandwidth should be maximized. Although the Association for the Advancement of Medical Instrumentation (AAMI) standard recommends an ECG bandwidth of 0.05-150 Hz, surface electrodes measurements can show ECG components up to 500 Hz. [1]

As with any physiological measurement from a subject, the balance lies in attempting to isolate the signal of interest from residual noise sources. In the case of ECG recording, interfering noise is often generated by skeletal muscle that lies in the superposition path defined by electrode placement. This noise (recorded as the electromyogram) can be especially problematic if the subject is intentionally moving during the ECG measurement. Other noise sources include interference resulting from mains-generated displacement currents (50/60 Hz hum).

Depending on the nature of the ECG measurement requirements, filtering methodology can be a helpful ally to reduce the effects of interfering noise sources.  The critical aspects of filtering are a function of the filter’s magnitude and phase characteristics.  Choice of filter topologies can have a significant effect on the shape of the ECG.  Given that AAMI guidelines are primarily concerned with ECG filter flatness from 0.05-150 Hz, typically, second-order (or higher) Butterworth filters are used to define these limits.

The discussion of ECG waveshape is continued in Electrocardiogram Waveshape Pt. II.

[1] http://circ.ahajournals.org/content/115/10/1306.full

For more information on BIOPAC’s ECG solutions, visit BIOPAC’s ECG-Cardiology page or view BIOPAC’s full line of electrodes, amplifiers, and wearable, wireless transmitters and loggers.

For more information on BIOPAC Systems, visit us at www.biopac.com.

error: Content is protected !!