Practical Tips for Recording Physiological Data in MRI

The MRI system incorporates a VERY strong magnetic field and both emits and records radio frequency (RF) energy. This has impacts on subject and experimenter safety and on data accuracy.

By Alan Macy, BIOPAC Systems, Inc.

When recording physiological signals from subjects in MRI systems, two issues are very important:

  1. The MRI system incorporates a VERY strong magnetic field. It is extremely important that no significant magnetically susceptible objects are taken into the room that houses the MRI System.  All materials have some degree of magnetic susceptibility. However, materials with mass magnetic susceptibility values, similar to or have magnitude less than that of water (-0.91E-8 m^3/kg), are typically permitted to be used in the vicinity of MRI Systems. No electrodes, electrode leads, transducers or cabling, that contain significant magnetically susceptible components, should be used when recording data from a subject in the MRI.
  2. The MRI System both emits and records radio frequency (RF) energy. This energy is typically in the range of 5 to 500 MHz. For a 3T MRI, the characteristic proton precession frequency will be 3T * 42.7 MHz or 128.1 MHz.  MRI generated RF energy will, at least, partially reflect from encountered conductors and induce current flow in those conductors. Signal reflections and induced currents can disrupt sensitive imaging operations by creating signal artifacts. Also, RF induced currents, if not properly controlled, can cause local heating.

Care must be taken to limit the flow of RF energy both in and out of the room that houses the MRI. RF energy from the MRI superimposes with the very small biopotentials and transducer signals in the vicinity of the subject. Alternatively, RF energy from recording or other equipment in the MRI Control Room (e.g. digital clocks and power supply switching noise) can leak into the MRI chamber, via subject cabling, and cause degradation of the image created by the MRI. It can be complicated to record biopotentials, from a subject’s body, during an MRI scan. These signals are very tiny and the RF energy, and associated magnetic field shifting, generated by the MRI corrupts the recording. Accordingly, successful biopotential recording in the MRI involves the use of specialized amplifiers, optimized cabling, patch-panel filtering, advanced signal processing and/or synchronization with MRI scanning processes to perform clean measurements.

When RF energy is pulsed into the subject, this energy spreads throughout the subject because the subject is a volume conductor. As the MRI magnetic gradient shifts in synchrony with RF energy pulsing, the gradient shift induces a current flow in conductors that intersect with the field. From a practical standpoint, RF energy pulsing and gradient-induced current flows often manifest themselves as repetitive artifact signals directly in the band of the physiological generated biopotentials. This is because RF energy pulsing and magnetic field gradient switching are performed synchronously for imaging and the repetition rates for image slice generation usually fall within the range of 1-100 Hz. Depending upon the biopotential frequency range (from lowest to highest: EGG, EOG, ECG, EEG and EMG), different amplification and signal processing techniques can be used to isolate the signal of interest. Furthermore, it’s often helpful to control imaging processes so that the MRI artifact signal spectrum does not unduly impact the measured physiological signal spectrum.

For more information on BIOPAC’s MR Safe and MR Conditional solutions, visit BIOPAC’s MRI page or view BIOPAC’s full line of electrodes, amplifiers, and wearable, wireless transmitters and loggers.

Download a related and important application note that describes the relationship between MRI imaging sequences and associated physiological measurements, when subjects are monitored in the MRI. In particular, this note addresses newfound insights on the impact that imaging sequence types have upon simultaneously recorded electrocardiography (ECG) and impedance cardiography (ICG) subject measurements.

BIOPAC Systems, Inc. provides life science researchers and educators with data acquisition and analysis systems that inspire people and enable greater discovery about life.  Visit us at www.biopac.com.

Signal Artifact Associated with MRI

By Alan Macy, BIOPAC Systems, Inc.

When performing MRI and simultaneously recording time-series physiological data, there are two basic types of artifact associated with MRI processes. The first type of artifact is associated with the presence of the large constant MRI magnetic field.  This type of artifact is typically called “magnetohydrodynamic effect” (MHD). MHD artifact results from movement of conductive fluid (blood) and from the movement of charge inside the body, when exposed to a magnetic field. A motional electromotive force (Vemf) is generated when a conductor moves through a magnetic field. Also, a charge moving in a magnetic field may have its travel path affected by the field. This two phenomenon can distort, and superimpose with, an existing biopotential signal. The most prominent MHD effects occur in the vicinity of the heart. The aortic arch is aligned perpendicularly to the MRI magnetic field and this geometry is conducive to creating large magnitude MHD artifacts in the ECG signal. Aortic blood flow is highest during systole, which corresponds to the ST segment in the ECG signal, so the largest MHD artifacts occur during this period. MHD effects are easily seen when measuring ECG inside the MRI, even when scanning is off. In this situation, the ECG signal will usually distort to the point of being non-diagnostic, such as lengthening QRS time and increasing T-wave amplitude.

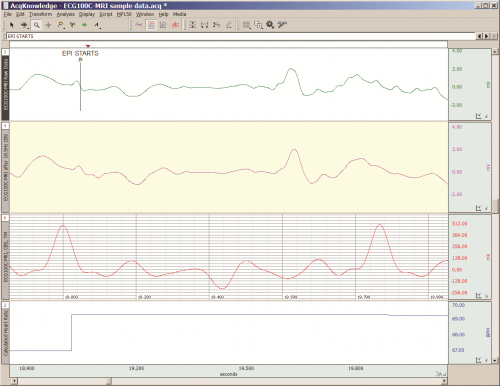
The second type of artifact is associated with the time-based scanning processes occurring within the MRI. During scanning, two sources generate artifacts during biopotential measurements in the MRI. The first source is associated with magnetic field gradient switching during EPI or other scanning sequence. As the magnetic field changes orientation with respect to the biopotential electrode lead-subject-amplifier loop, a current is induced in the loop. The magnitude of induced current is proportionally linked to the loop area and number of turns in the loop. The second source is associated with radio-frequency (RF) pulsing coincident with gradient switching during the scanning sequence.  The RF is at the Larmor frequency and couples to the biopotential loop conductors, which include electrodes, electrode leads and subject. RF energy can circulate in this loop because the biopotential signal conductors will travel through the cable harness to the patch panel connectors separating chamber room from control room. RF energy will couple throughout the cabling harness due to distributed capacitance in the cable, thus establishing an RF conducting loop that includes subject, electrodes, electrode leads and distributed capacitance in cable harness.

For more information on BIOPAC’s MR Safe and MR Conditional solutions, visit BIOPAC’s MRI page or view BIOPAC’s full line of electrodes, amplifiers, and wearable, wireless transmitters and loggers.

Download a related and important application note that describes the relationship between MRI imaging sequences and associated physiological measurements, when subjects are monitored in the MRI. In particular, this note addresses newfound insights on the impact that imaging sequence types have upon simultaneously recorded electrocardiography (ECG) and impedance cardiography (ICG) subject measurements.

BIOPAC Systems, Inc. provides life science researchers and educators with data acquisition and analysis systems that inspire people and enable greater discovery about life.  Visit us at www.biopac.com.

Impedance Cardiography

By Alan Macy, BIOPAC Systems, Inc.

ICG is a measurement method that is primarily used to determine aspects of Cardiac Output (CO).   CO is the total amount of blood, pumped from both the left and right ventricles of the heart for each of its successive systolic phases, over the course of one minute.  The systolic phase, or systole, is when the heart muscle contracts and pumps blood from the chambers (left and right ventricles) into the arteries.  Typical resting cardiac output is 4.9 liters/minute for an adult human female and 5.6 liters/min for an adult human male.

Left ventricular cardiac output is the CO from the left ventricle only and can be estimated via a non-invasive technique called Impedance Cardiography (ICG), which provides an approximation of Stroke Volume (SV).  If SV and Heart Rate (HR) are known, then CO can be determined by:


SV * HR = Cardiac Output


ICG is measured by introducing a constant current (I) through the thoracic volume and then measuring the resulting voltage (V).   The following equation is used to determine thoracic impedance (Z).

 Z = V/I

 Where V and I are the root mean square (rms) values of the measured voltage and supplied (known) current.  ICG systems induce a constant magnitude, alternating current (I) through the thorax via electrodes.  A separate set of electrodes (placed between the current electrodes) monitor the voltage (V) developed across the thorax.  Because the magnitude of I is constant, V will vary in direct proportion to Z.


The applied current (I) flows through the volume of the thorax, which includes skin, skeletal muscle, the lungs, the heart and blood.  Because blood is a conductor, the changes in blood volume during a cardiac cycle produce a measurable change in thoracic impedance.  Researchers have developed equations for estimating left ventricular SV based on thoracic impedance, with the most widely used equation being that developed by Kubicek, et al. (1966):

 SV = rho x (L/Zo)² x LVET x (dZ/dt Max)

 Where:

 SV = Stroke volume (ml)

rho = Resistivity of blood (Ohms·cm) which is assumed to be a constant 135 Ohms·cm (Quail, Traugott, Porges, & White, 1981).

L = Length or distance between inner band (voltage monitoring) electrodes (cm)

Zo = Basal Thoracic Impedance (Ohms)

LVET = Left Ventricular Ejection Time (seconds)

dZ/dt Max = Absolute value of the cyclic peak of the derivative of Zo (Ohms/sec)

LVET varies inversely with heart rate under a broad range of circumstances.  LVET should not be treated as a constant in the Kubicek equation.  Unlike Length (L), which is constant during a session, Thoracic Impedance (Zo) also varies some, although not as much as LVET.   Blood resistivity (rho) also may vary with changes in hematocrit levels and red blood cell orientation, but that variation has largely been ignored because of the difficulties associated with having to draw blood to measure rho.

Impedance Cardiography (ICG) is an indirect measurement of Stroke Volume (SV).  Studies have been performed to correlate ICG to SV, using thermodilution as reference and have found that accuracy improves when variables such as age, height, sex, waist circumference and weight are factored into the SV estimation.  Accordingly, ICG measures are best interpreted as a relative, versus absolute, indication of SV.  Even so, as a relative measure, ICG can provide a clear indication of important physiological processes associated with homeostasis and hemodynamic changes.

Research in psychophysiology, and other areas of physiology, focuses on the left ventricle because it pumps blood that supplies the metabolic requirements of striated (skeletal and cardiac) musculature and thus fundamentally supports behavior and exercise.  For Impedance Cardiography (ICG), the left ventricle is principally important because the dZ/dt signal primarily indicates left ventricular blood ejection into the aorta.  There is very little influence from right ventricular blood ejection in the ICG signal.

For more information on BIOPAC’s ECG solutions, visit BIOPAC’s ECG-Cardiology page or view BIOPAC’s full line of electrodes, amplifiers, and wearable, wireless transmitters and loggers.

For more information on BIOPAC Systems, visit us at www.biopac.com.

Electrocardiogram Waveshape Pt. 2

In some situations, it can be helpful to craft a compromise between maximizing ECG signal bandwidth, preserving the essential ECG waveshape, reducing the impact of skeletal myo-electrical noise and removing mains interference.

By Alan Macy, BIOPAC Systems, Inc.

This blog continues the discussion of Electrocardiogram waveshape.

In some situations, it can be helpful to craft a compromise between maximizing ECG signal bandwidth, preserving the essential ECG waveshape, reducing the impact of skeletal myo-electrical noise and removing mains interference. If this collective compromise is not well-considered, certain problems can arise. For example, if notch filters are used to remove mains interference in the ECG signal processing channel, significant distortion can be introduced into the ECG waveshape. Accordingly, notch filters are generally avoided or only used in combinations with lowpass filters to minimize undesired effects.

When constraining the ECG signal bandwidth, it becomes increasingly important to be aware of the phase linearity of the filters used to bandlimit the channel. For example, if a 35 Hz, second order, lowpass, Butterworth filter is used instead of one at 150 Hz, then an observable “ringing” will be evident after the QRS interval. This ringing occurs because of the phase non-linearity of the 35Hz Butterworth filter. However, if the 35 Hz filter is adjusted to have more “Bessel-like” phase qualities, the problematic ringing can be eliminated. When limiting the ECG signal frequency band to less than 0.05-150 Hz, reasonably phase linear highpass and lowpass filters will preserve the essential waveshape of the ECG. Phase linearity implies constant group delay. Constant group delay means that all frequencies in the filter passband are delayed by the same amount of time. Phase linear analog filters, and their digital equivalents, can be designed to process an ECG signal with minimal, filter-induced, distortion.

In addition to the above-listed simple strategies, a host of digital signal processing methods are available to optimize the previously mentioned compromise. Methods include linear and non-linear adaptive filters, synchronous adaptive noise cancellation, dynamic neural networks, coherent averaging, transform domain singular value decomposition and Legendre moments. [2]
References:

[2] http://www.ijric.org/volumes/Vol7/Vol7No7.pdf

For more information on BIOPAC’s ECG solutions, visit BIOPAC’s ECG-Cardiology page or view BIOPAC’s full line of electrodes, amplifiers, and wearable, wireless transmitters and loggers.

BIOPAC Systems, Inc. provides life science researchers and educators with data acquisition and analysis systems that inspire people and enable greater discovery about life.  Visit us at www.biopac.com.

error: Content is protected !!