TREV Q&A: Unpacking Trans-radial Electrical Bioimpedance Velocimetry

As researchers look for cleaner, more direct ways to capture sympathetic nervous system (SNS) activity, Trans-radial Electrical Bioimpedance Velocimetry (TREV) has emerged as a powerful new approach for measuring beat-by-beat changes in cardiac contractility to index sympathetic drive.headshot To explain how the technique works and where it fits alongside more established measures, we sat down with Viktoriya Babenko, PhD, BIOPAC’s in-house TREV expert and research specialist. Babenko helps researchers implement advanced cardiovascular and autonomic measurements, combining her extensive hands-on experience with bioimpedance technologies and a strong grounding in the interpretation of physiological signals. In the Q&A below, she describes the physiological principles behind TREV, how it differs from traditional electrodermal activity (EDA), electrocardiogram (ECG), and impedance cardiography (ICG) approaches, and why it offers a uniquely direct and practical window into sympathetic drive for both laboratory and neuroimaging research.

At a high level, what is Trans-radial Electrical Bioimpedance Velocimetry (TREV), and what does it measure?

TREV is a noninvasive method for estimating cardiac contractility as a continuous, beat-by-beat index of SNS activity. Rather than measuring bioimpedance across the chest like traditional ICG, TREV measures impedance changes across the radial and ulnar arteries of the forearm.

As the heart contracts, it generates a pressure wave that travels through the arterial system and causes red blood cells to momentarily align. This alignment reduces electrical resistance in the blood, which TREV continuously tracks. The impedance signal measured by TREV provides velocity, acceleration, and ultimately a contractility index, where stronger contractions reflect greater sympathetic drive.

Why is cardiac contractility such a useful index of SNS activity?

Cardiac contractility reflects the vigor with which the heart contracts during each heartbeat and is strongly modulated by sympathetic tone, either through direct neural innervation or circulating catecholamines like epinephrine. Increased sympathetic activation leads to stronger, faster contractions, while reduced sympathetic drive results in weaker contractile force.

Because of this close physiological relationship, contractility is considered one of the most direct and objective noninvasive measures of SNS activity. Unlike heart rate alone, which reflects both sympathetic and parasympathetic influences, contractility provides a more targeted window into sympathetic drive specifically.

How does TREV differ from traditional ICG- or ECG-based approaches?

Traditional approaches for indexing sympathetic drive, such as combining ECG and thoracic ICG to extract the pre-ejection period (PEP), are powerful but complex. They typically require 10 electrodes placed across the neck, chest, and torso, along with careful preprocessing and time-based feature extraction between both ICG and ECG to get PEP.waveform
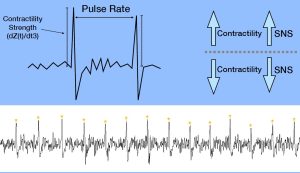
TREV dramatically simplifies this process by using just four strip electrodes placed on the forearm. The resulting contractility waveform produces a single sharp peak per heartbeat, where the amplitude directly reflects contractile strength. Analysis is as simple as extracting peak amplitudes, rather than identifying precise timing relationships across ECG and ICG signals, making TREV faster to set up and easier to analyze.

What is the physiological rationale for using the forearm and radial and ulnar arteries as the measurement site?

The radial and ulnar arteries provide a relatively simple and accessible vascular model that is well-suited for bioimpedance measurements. When the heart contracts, a pressure wave propagates rapidly through the arterial tree and reaches the forearm, aligning red blood cells even before bulk blood flow arrives.

This pressure-wave-driven alignment is sufficient to cause measurable drops in impedance, allowing TREV to estimate cardiovascular dynamics without the anatomical and physiological complexity of the thorax. Measuring at the forearm also reduces sensitivity to respiratory and pulmonary effects that complicate thoracic impedance measurements.

What cardiovascular or hemodynamic parameters can be derived from TREV?

TREV provides estimates of blood velocity, acceleration, and the integral of velocity (blood position) derived from the impedance waveform. Most importantly, the second derivative of the impedance signal yields a contractility index (blood flow “jerk”) that reflects sympathetic modulation of the heart on a beat-by-beat basis.

While multiple parameters are available, BIOPAC primarily recommends TREV as a tool for tracking cardiac contractility over time, particularly in studies interested in stress, arousal, motivation, and cognitive or emotional processes linked to sympathetic activation.

What does a typical TREV measurement session look like, from setup to data output?equipment
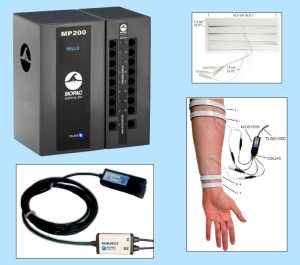
Once the arm is clean and dry, four hydrogel strip electrodes (EL526) are placed on the forearm and connected via the CBL246 adapter to the NICO100D system. I recommend watching the TREV Webinar titled “A Simple Next-Gen Method for Stress Research: TREV” for step-by-step guidance on electrode placement.

During data collection, the participant’s arm must remain fully supported and relaxed, ideally with the elbow and forearm stabilized through the wrist to minimize muscle activity. When collected under proper conditions, TREV produces a clean, continuous contractility waveform with one peak per heartbeat, allowing for straightforward beat-by-beat analysis of sympathetic drive.

What advantages does TREV offer compared to ECG, EDA, or other stress-related measures?

Many commonly used physiological signals, such as heart rate, blood pressure, or heart rate variability, are influenced by multiple factors, including hydration, temperature, respiration, and both branches of the autonomic nervous system (parasympathetic and sympathetic nervous systems). EDA provides a sympathetic index, but it is relatively slow, delayed, and indirect, reflecting eccrine sweat gland activity modulated by the SNS rather than cardiovascular dynamics.

TREV fills an important gap by offering a fast, dynamic, and more direct measure of sympathetic drive through cardiac contractility. It combines the physiological specificity of ICG-derived measures with a much simpler setup and analysis pipeline, making it especially attractive for experimental and applied research settings

What are the main challenges in acquiring clean, interpretable TREV data?

The primary challenge with TREV is its sensitivity to motion artifact. Muscle activity in the forearm generates electromyography (EMG) signals that are much larger than the impedance changes of interest and can easily overwhelm the TREV signal.

For this reason, careful experimental control is essential. The participant’s arm should be fully supported, relaxed, and free from movement or strain, while other body movements are generally permissible. When these conditions are met, TREV data quality is excellent, but the method does demand attention to posture and comfort.

In what research or applied settings is TREV showing the most promise?

TREV is particularly well-suited for research at the intersection of stress, cognition, emotion, and autonomic physiology. It has been successfully used in laboratory studies examining sympathetic responses to cognitive and emotional stressors, as well as in MRI environments to enable the simultaneous study of neural activity and SNS dynamics.

Across both standard laboratory settings and neuroimaging environments, TREV provides a continuous, beat-by-beat index of sympathetic activity, making it especially valuable for event-related experimental designs where precise timing and dynamic changes in autonomic responses are of interest. In the MRI specifically, this temporal resolution allows researchers to directly link moment-to-moment fluctuations in sympathetic drive with neural processes measured using functional MRI (fMRI), offering a powerful framework for studying how brain activity and cardiovascular sympathetic responses interact during task performance, affective processing, or stress-related appraisals. As with most MRI-based physiological measurements, specific hardware configurations and safety considerations apply, and researchers should contact the BIOPAC support team before data collection to ensure proper setup and compliance.

How does TREV perform in dynamic or real-world conditions, such as movement or exercise?

At present, TREV performs best in controlled conditions where the forearm can remain fully supported and at rest. Simple movements while seated may be permissible, provided that the arm containing the TREV electrodes remains immobile and relaxed. Due to its sensitivity to motion, TREV is not currently recommended for continuous data collection during active movement or exercise.

That said, TREV can still be extremely valuable in movement- or exercise-related research by comparing pre- and post-task states. This approach allows researchers to quantify sympathetic changes associated with physical or psychological challenges without collecting data during movement itself.

Looking ahead, how do you see the TREV method evolving over the next five to ten years?

As validation studies continue and more researchers adopt the method, TREV is likely to become a standard tool for indexing sympathetic drive in both basic and applied research. Ongoing work, including peer-reviewed publications, will further refine interpretation, best practices, and experimental design considerations.

In the longer term, improvements in signal processing, hardware integration, and multimodal data collection may expand TREV’s use into more naturalistic settings, helping bridge the gap between controlled laboratory studies and real-world physiological monitoring.


If you are planning a study and would like to learn more about integrating TREV, our team of experts can help guide you to the right equipment and strategies.

Related posts: Body Electrictric: Bioimpedance in Physiology Research and ‘Tis the Season for Stress: Research Tools for Anxious Times

Body Electric: Bioimpedance in Physiology Research

With nearly 70 percent of our bodies made up of water as well as a variety of dissolved salts, humans are natural conductors of electrical current. However, various elements of the human body restrict or impede the flow of electrical current, a phenomenon termed “bioimpedance.” Variations in restrictiveness to the flow of electrical current through an organism can provide researchers with a wealth of information on a range of physiological conditions.

Bioimpedance can be defined as the response of an organism to an externally applied electrical current. For more than a century, researchers have used bioimpedance as a safe and noninvasive metric for a range of physiological data, from measuring body composition through bioimpedance analysis (BIA) to investigating various biological systems such as cardiovascular function via impedance cardiography.

While not new, breakthroughs in technology and techniques for recording and analyzing bioimpedance have made it increasingly accessible to researchers. Through impedance cardiography and cardiac output, researchers gain access to a wide range of cardiovascular and hemodynamic data, including heart rate (HR), cardiac output (CO), acceleration index (AI), mean blood pressure (MBP), stroke index (IA), stroke volume (SV), and systemic vascular resistance, to name just a few.

The recent development of trans-radial electrical bioimpedance velocimetry (TREV) has provided researchers with a heightened level of accessibility when attempting to record high-quality data. Unlike traditional transthoracic methods of recording impedance cardiography signals, TREV measures blood movement through the radial and ulnar arteries of the forearm. The approach streamlines electrode placement, making it less prone to complications associated with other impedance cardiography methods.

bioimpedanceOne example of the practical application of impedance cardiography is in research on stress as it relates to coronary health. A 2019 study published by researchers at the University of Illinois at Urbana-Champaign compared the stress response of a group of young participants to that of participants over the age of 55 who had been diagnosed with coronary artery disease (CAD). Researchers recorded physiological signals, including electrocardiogram (ECG), impedance cardiogram (ICG), and continuous BP during rest, stress, and recovery. ECG and ICG signals were collected using BIOPAC BN-NICO wireless amplifiers and BN-EL50-LEAD4 leads. Researchers found ICG provided a reliable metric for stress response.

Recently, a team from the University of California, Santa Barbara (UCSB) employed TREV to demonstrate how this newer bioimpedance metric can be used to track event-related contractility in a maximal grip force experiment. The experiment employed TREV electrodes attached to the participant’s forearm and amplified by a NICO100D smart amplifier. Additionally, ECG electrodes were amplified by an ECG100D while the respiration cycle was recorded via a TSD221-MRI respiration belt. All data signals were acquired and analyzed using an MP160 system running AcqKnowledge software. The experiment confirmed the effectiveness of TREV as a reliable metric for connecting the cardio-sympathetic drive to other physiological conditions, such as force production.

While not new to physiological research, the application of bioimpedance continues to flourish and evolve. To learn more about how bioimpedance is being applied in the research setting as well as new techniques, check out BIOPAC’s webinar on bioimpedance and cardiac output focusing on TREV.


To learn more about incorporating impedance cardiography and TREV in your study, contact your regional BIOPAC sales representative today.

Stressing over the effects of stress

Several studies show chronic stress is typically detrimental to health, while acute stress may be linked to positive effects in addition to the negative counterparts

With April comes National Stress Awareness Month, and it bears noting that different types of stress have varying effects. Where chronic stress is typically detrimental to health, acute stress may be linked to positive effects in addition to the negative counterparts. But is this trade-off worth it?

In a biological psychology experiment testing the effect of oxytocin on acute social stress, researchers found different results between men and women. Subjects underwent several stress tasks while their electrocardiography and impedance cardiography were recorded with a BIOPAC MP Research System and amplifiers. The researchers found that after being given oxytocin during the stressful event, men had less negative affect and women had greater math performance (compared to the control group).

A neurobiology study examined the effect stress had on an extinction memory process when a competing association was paired with a previously aversive cue. To test this, participants were presented with two images, one that was paired with a shock from a BIOPAC bar electrode, and one that was not. Extinction memory training immediately followed this stimulus, with extinction retrieval testing following a day later. Data gathered by a BIOPAC data acquisition system suggested significantly lower retrieval in the group that experienced the acute stress stimulus.

Another biopsychology experiment measured the effect of acute stress on pro-inflammatory cytokine levels in the blood. BIOPAC equipment was used to measure ECG while participants were given the Trier Social Stress Test. After reviewing the data and blood samples, the researchers determined that levels of the cytokine cell, interleukin-1β, increased significantly immediately after the stress test.

The physiological and psychological impacts of stress are clearly multifaceted with many potential results. In some situations, a heightened positive affect or greater analytical thinking may be beneficial. But is this boost in mental performance worth the increase of inflammatory cells and lower memory retention? As with many aspects of life, moderation is the safest answer, ensuring the negative effects do not become chronic problems.

For more information on BIOPAC’s wide range of tools for recording, displaying, and analyzing ECG measurements from human and animal subjects including respiration, heart rate variability, and RSA, visit BIOPAC’s electrocardiography pages and view BIOPAC’s full line of electrodes, amplifiers, and wearable, wireless transmitters and loggers.

BIOPAC Systems, Inc. provides life science researchers and educators with data acquisition and analysis systems that inspire people and enable greater discovery about life. Visit us at www.biopac.com.

Holiday Happiness: Gratitude or Gifts?

Studies investigated the anxiety of gift-giving, the effects of social support in stressful situations, and what impact meditation has on heart rate, ECG, and blood pressure.

December has arrived, and for many the holidays bring a rush to check items off of a long shopping list for parents, siblings, friends, in-laws, and many more. Often we struggle to find that “perfect” gift, but are the physical goods we exchange the true source of the warmth and happiness that characterizes the season?

An article by Nomura investigated anxiety induced by gift-giving. To test this, EDA data was recorded with a BIOPAC data acquisition system and STP100 while participants responded to stimuli. The participants visualized a specific relative while being presented with potential gift options, and were asked how likely they were to purchase the potential gift for that relative. The data found that people who self-reported thinking of in-laws were the most stressed, while those who reported thinking of children or same-gender friends were least stressed.

A psychosomatic study by Inagaki and Eisenberger found that mental and physical well-being benefit from forms of social support. They tested this by administering mild shocks with the BIOPAC STMISOLA to male patients who held the hand of a female partner lying in an fMRI. The results suggest that this support (hand-holding) provided possible stress-reduction for both the male and female participants.

Another article on nonverbal communication and well being by Shaltout, et al. tested the effects of meditation and the subsequent ECG, blood pressure, and heart rate effects. The BIOPAC ambulatory BioHarness and NIBP Blood Pressure System gathered data while participants underwent several mediation episodes, during which they were instructed to focus on loving kindness towards a subject. The results found that participants had decreased heart rate.

Research suggests direct, loving interactions with those who are close to us have many stress-reducing benefits. So when you are shopping for gifts, remember that spending time is more important than spending money. To read more studies about love and stress reduction, visit the BIOPAC publication page.

BIOPAC offers a variety of equipment that can be used in studies similar to the ones presented. To find more information on solutions for recording and analyzing signals such as EEG, EMG, respiration, and EDA using the MP160/MP150, MP36, and other platforms, you can visit the individual application pages on the BIOPAC website. 

BIOPAC Systems, Inc. provides life science researchers and educators with data acquisition and analysis systems that inspire people and enable greater discovery about life. Visit us at www.biopac.com.

CNAP HD: Noninvasive Hemodynamic Monitoring in Research

Cardiac Output (CNCO® ) and further essential hemodynamic parameters calculated from the continuous non-invasive arterial pressure curve (CNAP®) by means of the Pulse Contour Analysis shows high accuracy and high trending ability (precision) compared to invasive clinical standards (e.g. thermodilution and PiCCO) with valuable benefit for scientific and clinical research.

By Dr. Jürgen Fortin, CEO, CNSystems

Pulse Contour Analysis (PCA) for deriving complete Hemodynamics from continuous blood pressure wave (CNAP)

Pulse Contour Analysis (PCA)[1] derives important physiological information on preload, contractility, afterload and compliance of the heart from the well validated CNAP® Continuous Noninvasive Arterial Pressure Curve[2],[3]. By adding biometric patient data Stroke Volume (SV) and therefrom Continuous Noninvasive Cardiac Output (CNCO®), both essential hemodynamic markers, are calculated. Further hemodynamic parameters such as Systemic Vascular Resistance (SVR) as well as all indexed values SI, CI or SVRI are derived completing the hemodynamic picture.

Validation: CNCO® is clinically validated against invasive methods

Non-invasive continuous CNCO® is the non-invasive continuous cardiac output calculated from CNAP® Arterial Pressure as described above.

Accuracy of CNCO® compared to clinical standards such as invasive thermodilution (TD) or PiCCO is expressed as percentage error. In 1999, Critchley and Critchley suggested a percentage error of 30% or less[4]. In clinical practice, however, percentage errors of 40-45% are more realistic for the interchangeability between two CO-measurement methods (meta-analysis by Peyton and Chong[5]).

Trending ability is the precise tracking of changes in CO. According to Critchley, Lee and Ho, reliable trending ability[6] is indicated by concordance rates of > 90%. Vincent and colleagues state that following hemodynamic trends may be more important than absolute values[7].

CNCO® shows both high accuracy as well as high trending ability (precision) compared to the invasive clinical standards thermodilution and PiCCO fulfilling all Critchley criteria:

Bland-Altman plots show

  • Small bias and narrow limits of agreement
  • Percentage errors ≤ 30% (according to strict Critchley standard [8],[9])
  • Concordance rates ≥ 90% (according to standard [10])

Read more on CNAP accuracy here and here.

Benefit of continuous BP, CO & SVR in research (examples)

Blood pressure, cardiac output and vascular resistance are used to differentiate between challenge and threat states (positive and negative stress)[11],[12] and to quantify emotional response[13] in psychophysiological studies. A challenging situation causes a far bigger rise in cardiac output than a threating state. Total peripheral resistance rises in threat state but shows strong decrease in the challenging situation.

CNCO® is available with the CNAP® HD feature, currently only available in Europe.

For more information on CNAP, to include references to studies and research and plots, click here.

[1] https://en.wikipedia.org/wiki/Cardiac_output#Pulse_Pressure_methods
[2] Jeleazcov C et. al. Precision and accuracy of a new device (CNAP®) for continuous noninvasive arterial blood pressure monitoring: assessment during general anaesthesia. BJA. 2010; 105(3):264-272
[3] Biais, M. et. al. Continuous non-invasive arterial pressure measurement: Evaluation of CNAPTM device during vascular surgery Ann Fr Anesthesia
[4] Critchley, L. A., & Critchley, J. A. (1999). A meta-analysis of studies using bias and precision statistics to compare cardiac output measurement techniques. Journal of clinical monitoring and computing, 15(2), 85–91
[5] Peyton PJ, Chong SW: Minimally invasive measurement of cardiac output during surgery and critical care. Anesthesiology 2010; 113:1220-35

[6] Critchley LA, Lee A, Ho AMH: A critical review of the ability of continuous cardiac output monitors to measure trends in cardiac output. Anesth Analg 2010; 111:1180-92.

[7] Vincent JL et al.: Clinical review: Update on hemodynamic monitoring – a consensus of 16. Critical Care 2011, 15:229.

[8] Critchley, L. A., & Critchley, J. A. (1999). A meta-analysis of studies using bias and precision statistics to compare cardiac output measurement techniques. Journal of clinical monitoring and computing, 15(2), 85–91

[9] Peyton PJ, Chong SW: Minimally invasive measurement of cardiac output during surgery and critical care. Anesthesiology 2010; 113:1220-35.

[10] Critchley LA, Lee A, Ho AMH: A critical review of the ability of continuous cardiac output monitors to measure trends in cardiac output. Anesth Analg 2010; 111:1180-92.

[11] Kirby, L. D., & Wright, R. A. (2003). Cardiovascular correlates of challenge and threat appraisals: A critical examination of the Biopsychosocial Analysis. Personality and Social Psychology Bulletin, 7, 216-233.

[12] Tomaka, J., Blascovich, J., Kelsey, R. M., & Leitten, C. L. (1993). Subjective, physiological, and behavioral effects of threat and challenge appraisal. Journal of Personality and Social Psychology, 65, 248-260.

[13] Lackner, H. K., Weiss, E. M., Schulter, G., Hinghofer-Szalkay, H., Samson, A. C., & Papousek, I. (2013). I got it! Transient Cardiovascular Response to the Perception of Humor. Biological Psychology, 93, 33–40.

For more information on BIOPAC’s Noninvasive Blood Pressure monitoring and measurement systems and advanced functionality in the area of cardiovascular hemodynamics, to include CNAP noninvasive blood pressure systems, visit BIOPAC’s NIBP page or view BIOPAC’s NIBP amplifiers (MRI and small animal applications are also supported) and related equipment for a wide variety of research applications.

BIOPAC Systems, Inc. provides life science researchers and educators with data acquisition and analysis systems that inspire people and enable greater discovery about life.  Visit us at www.biopac.com.

Signal Artifact Associated with MRI

By Alan Macy, BIOPAC Systems, Inc.

When performing MRI and simultaneously recording time-series physiological data, there are two basic types of artifact associated with MRI processes. The first type of artifact is associated with the presence of the large constant MRI magnetic field.  This type of artifact is typically called “magnetohydrodynamic effect” (MHD). MHD artifact results from movement of conductive fluid (blood) and from the movement of charge inside the body, when exposed to a magnetic field. A motional electromotive force (Vemf) is generated when a conductor moves through a magnetic field. Also, a charge moving in a magnetic field may have its travel path affected by the field. This two phenomenon can distort, and superimpose with, an existing biopotential signal. The most prominent MHD effects occur in the vicinity of the heart. The aortic arch is aligned perpendicularly to the MRI magnetic field and this geometry is conducive to creating large magnitude MHD artifacts in the ECG signal. Aortic blood flow is highest during systole, which corresponds to the ST segment in the ECG signal, so the largest MHD artifacts occur during this period. MHD effects are easily seen when measuring ECG inside the MRI, even when scanning is off. In this situation, the ECG signal will usually distort to the point of being non-diagnostic, such as lengthening QRS time and increasing T-wave amplitude.

The second type of artifact is associated with the time-based scanning processes occurring within the MRI. During scanning, two sources generate artifacts during biopotential measurements in the MRI. The first source is associated with magnetic field gradient switching during EPI or other scanning sequence. As the magnetic field changes orientation with respect to the biopotential electrode lead-subject-amplifier loop, a current is induced in the loop. The magnitude of induced current is proportionally linked to the loop area and number of turns in the loop. The second source is associated with radio-frequency (RF) pulsing coincident with gradient switching during the scanning sequence.  The RF is at the Larmor frequency and couples to the biopotential loop conductors, which include electrodes, electrode leads and subject. RF energy can circulate in this loop because the biopotential signal conductors will travel through the cable harness to the patch panel connectors separating chamber room from control room. RF energy will couple throughout the cabling harness due to distributed capacitance in the cable, thus establishing an RF conducting loop that includes subject, electrodes, electrode leads and distributed capacitance in cable harness.

For more information on BIOPAC’s MR Safe and MR Conditional solutions, visit BIOPAC’s MRI page or view BIOPAC’s full line of electrodes, amplifiers, and wearable, wireless transmitters and loggers.

Download a related and important application note that describes the relationship between MRI imaging sequences and associated physiological measurements, when subjects are monitored in the MRI. In particular, this note addresses newfound insights on the impact that imaging sequence types have upon simultaneously recorded electrocardiography (ECG) and impedance cardiography (ICG) subject measurements.

BIOPAC Systems, Inc. provides life science researchers and educators with data acquisition and analysis systems that inspire people and enable greater discovery about life.  Visit us at www.biopac.com.

Impedance Cardiography

By Alan Macy, BIOPAC Systems, Inc.

ICG is a measurement method that is primarily used to determine aspects of Cardiac Output (CO).   CO is the total amount of blood, pumped from both the left and right ventricles of the heart for each of its successive systolic phases, over the course of one minute.  The systolic phase, or systole, is when the heart muscle contracts and pumps blood from the chambers (left and right ventricles) into the arteries.  Typical resting cardiac output is 4.9 liters/minute for an adult human female and 5.6 liters/min for an adult human male.

Left ventricular cardiac output is the CO from the left ventricle only and can be estimated via a non-invasive technique called Impedance Cardiography (ICG), which provides an approximation of Stroke Volume (SV).  If SV and Heart Rate (HR) are known, then CO can be determined by:


SV * HR = Cardiac Output


ICG is measured by introducing a constant current (I) through the thoracic volume and then measuring the resulting voltage (V).   The following equation is used to determine thoracic impedance (Z).

 Z = V/I

 Where V and I are the root mean square (rms) values of the measured voltage and supplied (known) current.  ICG systems induce a constant magnitude, alternating current (I) through the thorax via electrodes.  A separate set of electrodes (placed between the current electrodes) monitor the voltage (V) developed across the thorax.  Because the magnitude of I is constant, V will vary in direct proportion to Z.


The applied current (I) flows through the volume of the thorax, which includes skin, skeletal muscle, the lungs, the heart and blood.  Because blood is a conductor, the changes in blood volume during a cardiac cycle produce a measurable change in thoracic impedance.  Researchers have developed equations for estimating left ventricular SV based on thoracic impedance, with the most widely used equation being that developed by Kubicek, et al. (1966):

 SV = rho x (L/Zo)² x LVET x (dZ/dt Max)

 Where:

 SV = Stroke volume (ml)

rho = Resistivity of blood (Ohms·cm) which is assumed to be a constant 135 Ohms·cm (Quail, Traugott, Porges, & White, 1981).

L = Length or distance between inner band (voltage monitoring) electrodes (cm)

Zo = Basal Thoracic Impedance (Ohms)

LVET = Left Ventricular Ejection Time (seconds)

dZ/dt Max = Absolute value of the cyclic peak of the derivative of Zo (Ohms/sec)

LVET varies inversely with heart rate under a broad range of circumstances.  LVET should not be treated as a constant in the Kubicek equation.  Unlike Length (L), which is constant during a session, Thoracic Impedance (Zo) also varies some, although not as much as LVET.   Blood resistivity (rho) also may vary with changes in hematocrit levels and red blood cell orientation, but that variation has largely been ignored because of the difficulties associated with having to draw blood to measure rho.

Impedance Cardiography (ICG) is an indirect measurement of Stroke Volume (SV).  Studies have been performed to correlate ICG to SV, using thermodilution as reference and have found that accuracy improves when variables such as age, height, sex, waist circumference and weight are factored into the SV estimation.  Accordingly, ICG measures are best interpreted as a relative, versus absolute, indication of SV.  Even so, as a relative measure, ICG can provide a clear indication of important physiological processes associated with homeostasis and hemodynamic changes.

Research in psychophysiology, and other areas of physiology, focuses on the left ventricle because it pumps blood that supplies the metabolic requirements of striated (skeletal and cardiac) musculature and thus fundamentally supports behavior and exercise.  For Impedance Cardiography (ICG), the left ventricle is principally important because the dZ/dt signal primarily indicates left ventricular blood ejection into the aorta.  There is very little influence from right ventricular blood ejection in the ICG signal.

For more information on BIOPAC’s ECG solutions, visit BIOPAC’s ECG-Cardiology page or view BIOPAC’s full line of electrodes, amplifiers, and wearable, wireless transmitters and loggers.

For more information on BIOPAC Systems, visit us at www.biopac.com.

error: Content is protected !!