Hands-on Learning: How Real‑Time Physiological Data Deepens Clinical Education

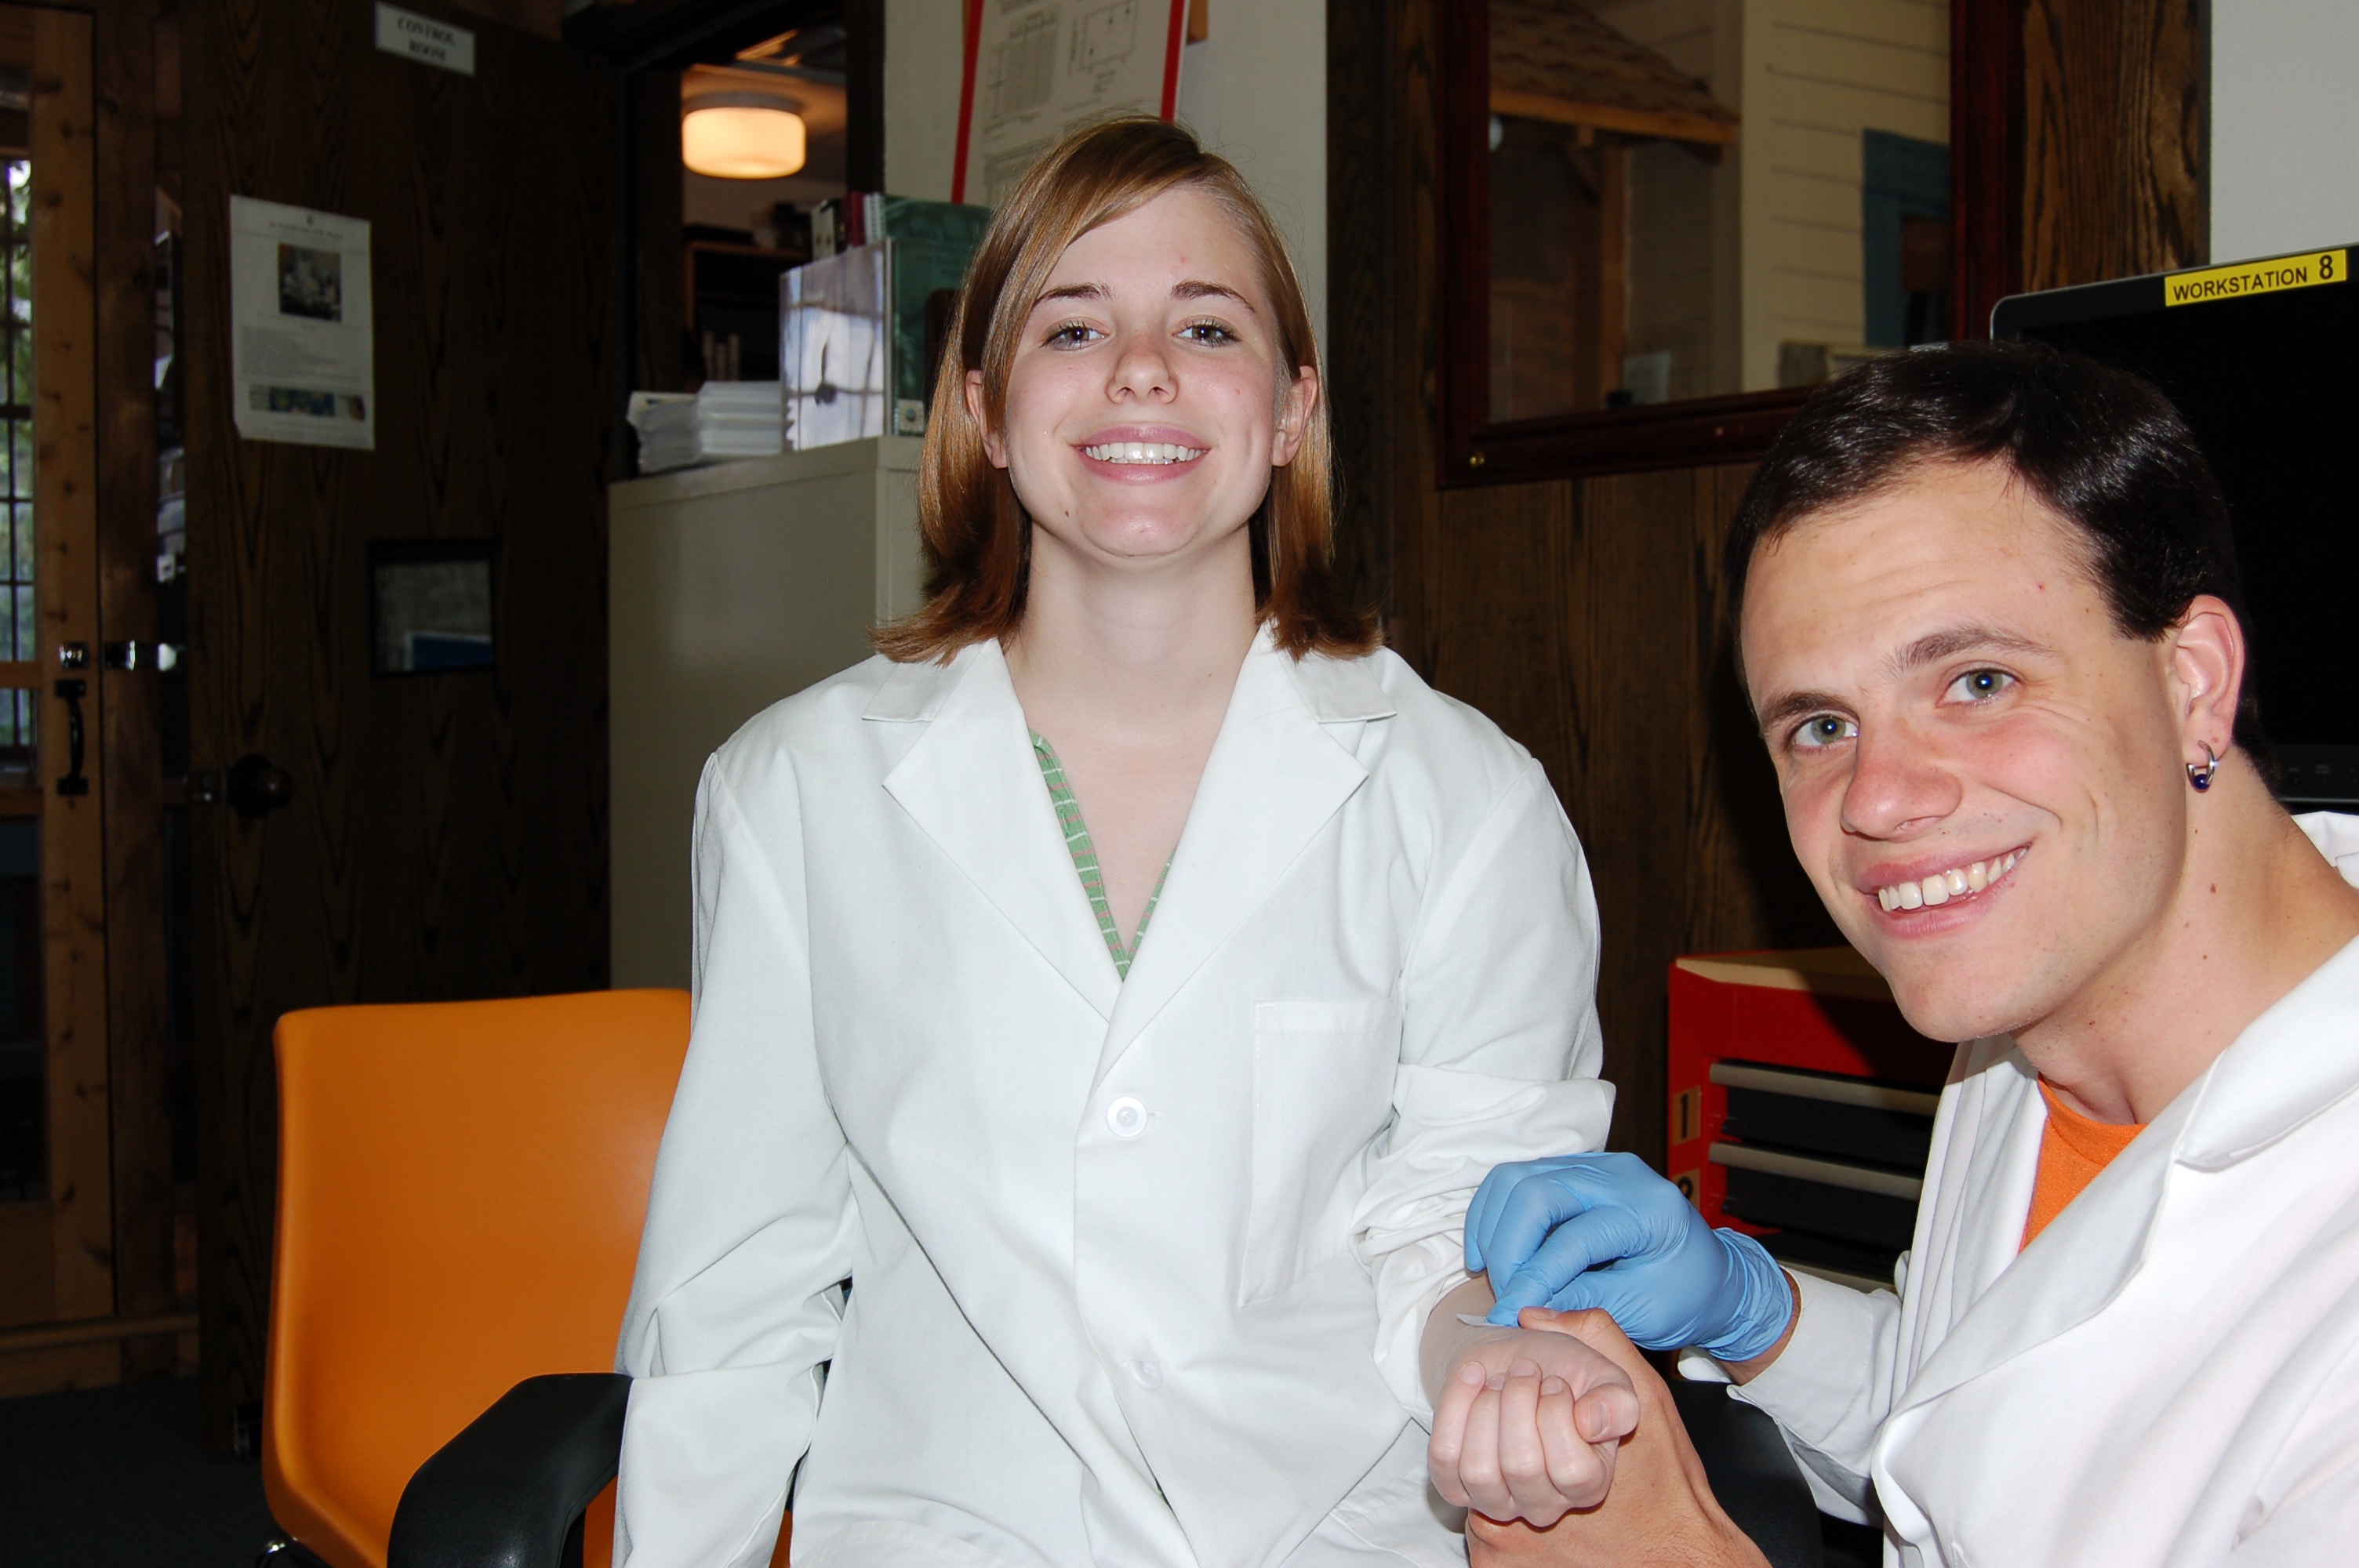
Physicist Albert Einstein noted, “The only source of knowledge is experience.” This principle is particularly relevant in healthcare education, where hands-on learning is vital for cultivating the skills needed to care for patients effectively. The practice of recording and analyzing physiological signals in the learning lab serves as a powerful teaching tool, enabling students to immerse themselves in real-world scenarios and reveal autonomic responses, cardiovascular patterns, and emotional states that are often hidden from view.

For students in nursing, dentistry, and pharmacology, engaging with these signals transforms abstract concepts into concrete, measurable experiences. By analyzing heart activity, visual attention, stress markers, and pharmacodynamic effects, students not only enhance their critical thinking skills but also prepare themselves for clinical challenges with greater confidence.

Physiological signals across the health sciences teach learners to interpret subtle features embedded in physiological waveforms. Modern teaching laboratories increasingly incorporate multimodal systems to help students better understand the complexity of human physiology.

Nursing programs emphasize accurate patient monitoring and interpretation of vital signs, including electrocardiograms (ECG) and heartrate variability (HRV). A 2025 study published in Sensors evaluated the validity of Apple Watch Series 6 HRV data against laboratory‑grade ECG recordings using a BIOPAC 3‑lead ECG system to provide a comparative baseline for measurement. By synchronizing event markers between the Apple Watch and BIOPAC timeline, researchers ensured precise temporal alignment for comparing R‑R intervals and HRV indices. The results showed near-perfect agreement in R-R interval timing under resting conditions, indicating that such wearable devices can serve as a reasonable tool for certain wellness-oriented assessments. At the same time, the BIOPAC system remains the gold standard for precise physiological analysis.

For nursing students, this study demonstrated that consumer wearables must be validated against clinical-grade systems before being relied upon for assessment or decision-making. By examining the comparative data, students can explore how artifacts, sampling frequencies, and sensor placement influence the fidelity of HRV measurements. Moreover, because HRV relates directly to autonomic balance and stress physiology, the study provides a meaningful touchpoint for nursing courses in pathophysiology and patient assessment. Through hands‑on lab sessions using BIOPAC ECG amplifiers, students can visualize waveform morphology, measure beat‑to‑beat variability, and learn how cardiovascular signals reflect underlying homeostatic regulation.

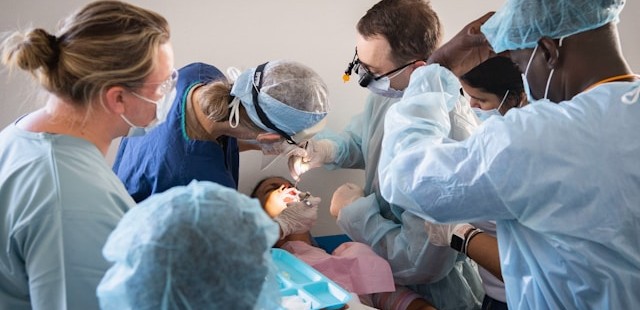
Dental students should understand not only the mechanics of clinical procedures but also the emotional and perceptual experiences of their patients, especially children. A 2025 cross-sectional pilot study in the European Archives of Paediatric Dentistry used an eye tracking and  data acquisition and analysis system from BIOPAC to measure children’s gaze behavior and physiological stress when viewing images of dentists, dental chairs, and operatory designs.

Using eye-tracking metrics such as mean dwell time, fixation count, time to first fixation, and total fixation time, researchers found that study participants stared longer at dentists wearing white coats, indicating a perception of compitance and safety, but also indimidation. In addition, gender matching mattered, as children showed longer fixation on dentists of the same gender. The study also found that warm‑colored dental chairs (especially yellow) attracted greater visual attention, particularly among younger children. Simultaneously, HRV and ECG signals recorded with the BIOPAC system revealed that younger children exhibited greater autonomic arousal than older peers when exposed to dental images.

These findings offer dental students actionable insights into clinic design, caregiver attire, and emotional perception, all of which influence pediatric patient comfort. The study demonstrates how combining eye tracking with physiological monitoring can reveal otherwise hidden psychological responses. For dental educators, integrating such physiological signal analysis into coursework helps students develop empathetic, patient‑centered care strategies.
colored pillsIn pharmacology courses, students learn how drugs influence physiological systems. A study published in Brain Sciences investigated the lingering cardiovascular effects of caffeine, challenging the assumption that its effects dissipate within six hours. Using BIOPAC respiratory transducers, noninvasive blood pressure modules, bioimpedance amplifiers, and ECG amplifiers connected to a data acquisition and analysis system researchers monitored participants before and after consumption of caffeinated and decaffeinated coffee. Results showed measurable changes in heart rate, respiratory patterns, and thoracic impedance well beyond the expected metabolic window, suggesting caffeine’s physiological effects outlast its pharmacokinetic half‑life.

For pharmacy students, these findings reinforce critical distinctions between pharmacokinetics (drug metabolism) and pharmacodynamics (physiological response). By analyzing real‑world signal data, learners gain a more nuanced understanding of how stimulants affect autonomic regulation. Such insights prepare future pharmacists to counsel patients on medication timing, drug interactions, and individual responses to common agents such as caffeine.

Across nursing, dentistry, and pharmacy, physiological signals provide potent educational value. They bridge the gap between theory and clinical application by giving students concrete, measurable access to physiological processes such as autonomic reactivity, cardiovascular regulation, and perceptual attention. Using both research and education-based lab systems, learners can visualize real-time physiological data, develop analytical skills, and cultivate a deeper understanding of the human body under stress, stimulation, and clinical observation.

As healthcare grows more data‑driven, integrating hands-on experience with signal acquisition into professional training helps future clinicians interpret complex physiological information with confidence. Whether validating wearable devices, improving pediatric patient experiences, or exploring drug‑induced autonomic effects, physiological signals empower students to connect scientific principles with evidence‑based, care. Check out our webinar, Advancing Practical Learning: Biosignal Essentials, to learn more.


If you’re exploring ways to incorporate physiological signals into your curriculum or simulation lab, our team is ready to help identify the best tools and workflows for your program.

A Brief Tour of Psychophysiology

Why are we interested in psychophysiological measurements? Which measurements are these exactly? By “measurements,” we are talking about micro-facial expressions, pupil dilation, peristaltic contractions of the intestines, heart activity, breathing patterns, electrodermal activity, and other responses not visibly apparent.

In the 1880s, an English philosopher named William James was among the first to explore what constitutes an “emotion.” James believed that everything, big and small, that happens to us and around us elicits a constant stream of feelings and responses. These responses can range from indifference, fear, excitement, happiness, stress—virtually the full gamut of the human emotional palette.

Why does this happen and how do we measure it?

There is always a response in our bodies as a consequence of input delivered via our senses, and there is a resulting “feeling” that happens. Sometimes the feeling doesn’t have much impact but at other times, its effect is profound. The term “emotion” is the label that we assign to these feelings. These feelings result in a response that affects our physiology. These physiological responses to ongoing events are objectively measurable and referred to as “affect.”

Data enters the brain via our senses, but it takes a small period of time to process the input; about 50 milliseconds if the event is a sound, and 100 milliseconds if visual. When data comes in, it travels through various neural pathways and our response to it is informed by our previous experiences. An extreme example to external input causing profound affective changes would be in someone with post-traumatic stress disorder (PTSD), in which certain sounds, or other situational input can trigger pronounced panic or discomfort. People with phobias (for example, fear of cats) will exhibit physiological changes far out of proportion to the actual danger posed by the perceived input. Someone who loves cats would undoubtedly experience a warm fuzzy feeling, whereas a person with a cat phobia would be panicked, resulting in dramatic and measurable changes in heart rate, respiration, and eccrine activity (skin sweating).

An evolutionary motivation baked in to our consciousness is the “fight or flight” response, in which we respond to danger and make a quick decision whether to run or defend ourselves. We all have different thresholds for which input might trigger this response. The line is often blurred between what constitutes actual danger or a seemingly innocuous sensory event that ignites an unpleasant memory or triggers the ghost of a previous traumatic experience.

Now that we have briefly explored a thumbnail sketch of psychophysiology, what kind of equipment is used for recording psychophysiological data? When we set up a psychophysiology experiment, we can record the changes occurring in the body and analyze the results with a great depth of accuracy. To record these signals, specific data acquisition hardware such as the BIOPAC MP36 is commonly used, with a SS2L transducer for recording ECG and a SS57L EDA (electrodermal activity) transducer. The software used to process and display these signals is very often AcqKnowledge (for research) or Biopac Student Lab (for education).

Although emotions cannot be captured or studied in a lab, the physiological changes that result from emotional experiences certainly can be.

For further reading about emotional affect, please see our blog “Circumplex Model of Affect and Motivational State.”

Other related BIOPAC resources:

BIOPAC offers a wide array of wired and wireless equipment that can be used in your research. To find more information on solutions for recording and analyzing signals such as ECG, heart rate, respiration, and more using any platforms mentioned in this blog post, you can visit the individual application pages on the BIOPAC website.

Photo by Noah Buscher on Unsplash


Fielding a Media Psychophysiology Team

Author: Ashley Churchill, M.A., BIOPAC Midwest Sales

Media psychophysiology research is being embraced by a variety of communication departments around the world. Media psychophysiology generally refers to the measurement of biological responses to messages in order to understand viewers’ cognitive and emotional processing of video, audio, or print messages. Media researchers often focus on measuring processes that occur as one interacts with media content over time and they look for insights into how and why certain media effects emerge (see Potter & Bolls, 2012 for more background).

Social science labs and communication researchers might feel daunted when starting up a lab if they are inexperienced in collecting physiology data. Here are three common strategies that will support the development of a media lab team and contribute to its success.

Ensure the research team has access to and is comfortable seeking out assistance from a variety of resources. Psychophysiology is a fundamentally interdisciplinary science. Incorporating it into your research requires that you draw on both technical and conceptual knowledge from disciplines outside of social science. To complicate things, formal psychophysiology resources can be difficult to find within the typical social science department. Effectively using external resources like subject librarians, university IT, faculty across departments, and BIOPAC’s support team, can help overcome this challenge.

Explain the conceptual aspects of media psychophysiology to your research assistants, whether they are volunteering for the semester or plan to stick around for a few years. Providing RAs with a conceptual background regarding relationships between media, psychology, and physiology can mean the difference between success and failure as far as effectively identifying and resolving problems during an experiment. It takes more than simple knowledge of electrode placement to make someone effective in a data collection role. Guiding RAs in a way that reflects this supports stronger research and researcher retention.

Preserve the practical knowledge generated by your team, do not let it leave with them. Learning how to conduct media psychophysiology research takes time and experience. As different team members rotate in and out of the lab over time, continue to support lab practices that preserve their knowledge and understanding of this research approach. Whether this takes the form of storing informative documentation or encouraging them to lead aspects of new member onboarding, these practices are important to improving the effectiveness of your team over time.

To find more information regarding media psychophysiology, check out our recent webinar featuring media psychophysiology expert Dr. Paul Bolls. To learn about signals that are common in media psychophysiology research— like fEMG, ECG, and EDA—visit our library of on-demand life science webinars.


BIOPAC offers a wide array of wired and wireless equipment that can be used in your research. To find more information on solutions for recording and analyzing signals such as ECG, heart rate, respiration, and more using any platforms mentioned in this blog post, you can visit the individual application pages on the BIOPAC website.

Photo by Vlad Hilitanu on Unsplash

Don’t Let COVID-19 Lock Down Your Labs

By: Jasmine Anderson, Biopac Student Lab Product Manager 

The COVID-19 pandemic turned higher education upside-down when stay-at-home orders forced educational institutions to shift to distance learning this Spring. In hindsight, no one could have predicted what 2020 would entail – and now, while facing the pandemic, the future seems even more impossible to plan. 

When the novel coronavirus put a lockdown on our higher education institutions, instructors were required to make swift decisions on how they would continue. In the news, institutions are slowly releasing their course of action on an individual basis and plans appear to vary across the board. Some schools are announcing that they’ll forge ahead this fall while others are opting to hold off on deciding or have already closed their campus. Regardless of the plan, a common theme shines through – the fact that everyone’s trying to do the best that they can, given these complicated and un–chartered circumstances.  

To help save practical labs, BIOPAC is releasing a new teaching platform, called BSL Home, that brings the lab experience directly to your students. With BSL Home students can learn physiology by recording from their own body and can run the hands-on lessons from their own home, in the dorm, at the library, wherever. The objective of Biopac Student Lab is to learn-by-doing and we’re here to help you navigate this new normal. To find out more about our distance learning solutions and regional events for the Biopac Student Lab community, please contact your local sales representative.

How are you navigating this new normal? 

To start the conversation, use the comment box to share your school’s strategy for saving the practical lab this fall. 


Top Signals for Life Science Instruction

Experience has shown that beginning physiology students are more engaged when acquiring and viewing signals from their own (or a lab partner’s) bodies in real time, particularly signals that are noninvasive to capture and easy to acquire. Watching a waveform trace across the screen and respond immediately to physical input is a sure-fire way to spark wonder and curiosity in a student. The following is a list (in no particular order) of the most common signals gathered in a beginning lab environment using the Biopac Student Lab System.

Electromyogram (EMG)

EMG is probably the top signal as far as simplicity, as the EMG signal can be consciously and directly controlled by the student, whether it be by simply making a fist to contract the forearm muscle or squeezing a hand dynamometer to measure grip strength. In addition to a raw EMG signal, a second channel showing integrated EMG can be simultaneously displayed. (Biopac Student Lab Lesson 1 and Lesson 2.)

Electroencephalogram (EEG)

EEG is another easy-to-acquire signal. Although not consciously controllable as EMG, the student can observe differences in the four simple periodic rhythms present in brain activity (alpha = 8-13 Hz, beta = 13-30 Hz, delta = 1-5 Hz, and theta = 4-8 Hz) while engaged in activities such as opening/closing eyes, solving simple mental math problems, or hyperventilating. (Biopac Student Lab Lesson 3 and Lesson 4.)

Electrocardiogram (ECG)

The ECG represents electrical events of the cardiac cycle whereas Ventricular Systole and Ventricular Diastole represent mechanical events (contraction and relaxation of cardiac muscle, passive opening and closing of intracardiac valves, etc.). Because the ECG reflects electrical activity, it is a useful “picture” of heart activity and presents several interesting components under various conditions, such as while sitting, standing, lying down, and after deep breathing or exercise. Various lead configurations highlight observable differences in the QRS complex which become apparent in analysis. (Biopac Student Lab Lessons 5, 6, and 7.)

Respiration (RSP) cycle and pulmonary function

As easy as breathing, measuring RSP signals under a variety of circumstances is another common study. Using a respiratory transducer (SS5LB) and an airflow transducer (SS11LB), we can record and analyze chest expansion and contraction during the breathing cycle, as well as pulmonary volumes/capacities and the effects of aerobic exercise. (Biopac Student Lab Lessons 8, 12, 13, and 15.)

Electrooculogram (EOG)

Large and small movements of the eye can be tracked and studied under various conditions by attaching simple adhesive electrodes to the forehead and temples in conjunction with the same SS2L electrode lead set used for recording EMG and ECG signals. (Biopac Student Lab Lesson 10.)

Reaction Time

Possibly the most fun signal to record. The participant holds a hand switch (SS10L) and pushes the button when an aural (click sound) or visual (light flash) stimulus is presented. The reaction time interval between the presentation of the stimulus and the participant’s voluntary reaction (button push) are recorded and analyzed. A variety of stimuli are presented, such as reaction to a fixed stimulus (e.g., every four seconds) opposed to a random stimulus (one to 10 seconds). Reactions are recorded holding the hand switch alternately in both the right and the left hand. It’s interesting to compare the difference in reaction time elicited from the dominant vs. non-dominant hand in response to the aural or visual stimulus. (BSL Lessons 11 and 11A.)

Other signals and studies commonly acquired in Biopac Student Lab are:

We also invite you to watch a free on-demand webinar detailing Biopac Student Lab Lessons.


BIOPAC offers a wide array of wired and wireless equipment that can be used in your research. To find more information on solutions for recording and analyzing signals such as ECG, heart rate, respiration and more using any platforms mentioned in this blog post, you can visit the individual application pages on the BIOPAC website.

Photo by JESHOOTS.COM on Unsplash


T4 Conference Wrap-up

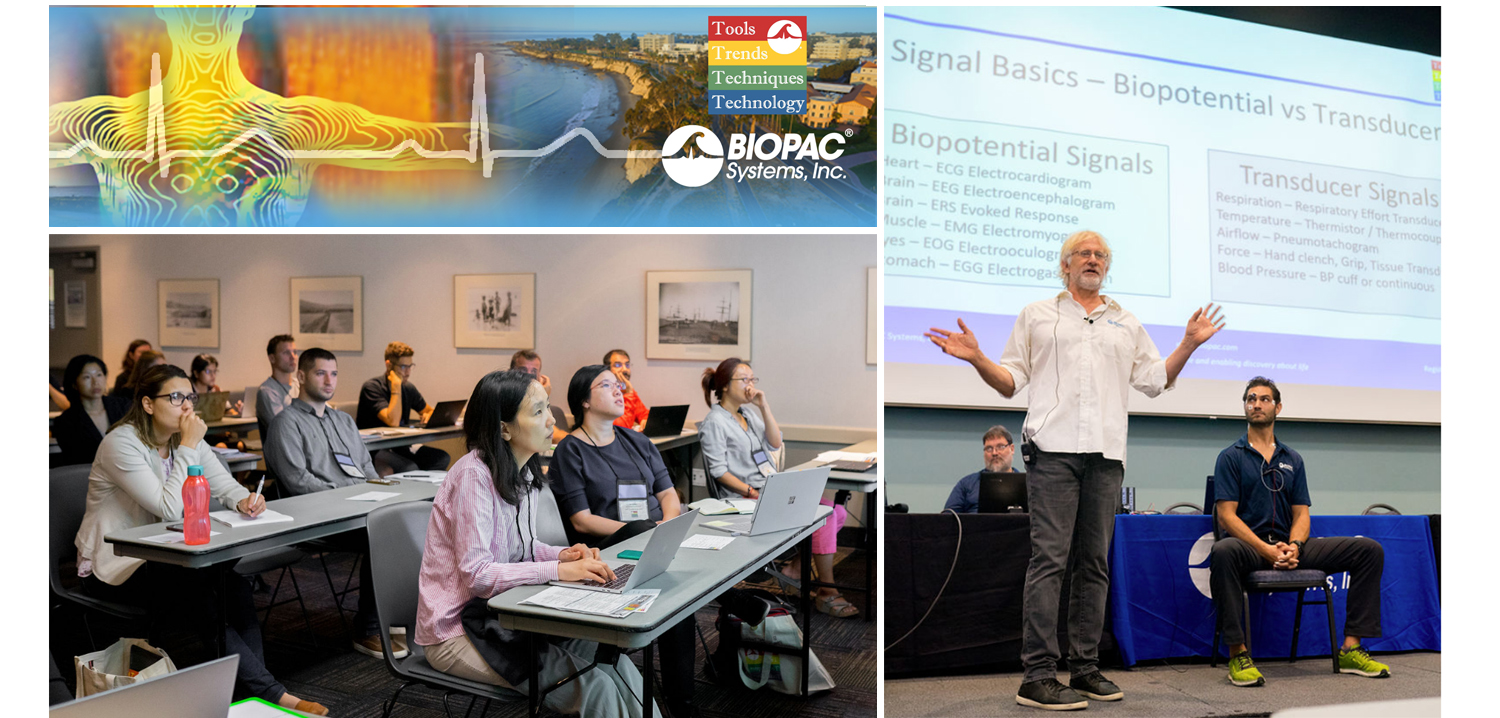
August is a month of barbecues, baseball, and last-minute vacations against the backdrop of a fading summer, and the eighth month of 2019 proved to be an equally exciting time at BIOPAC, with something of a pleasant vacation thrown in. On August 12-14, BIOPAC hosted its 2nd Biennial “Tools, Trends, Techniques, and Technology” Human Physiology Conference, known as “T4” to our friends and partners around the world. This three-day event, first held in 2017, featured lively, informative sessions hosted by BIOPAC staff, partners, noted academics, and industry experts, and covered a wide range of physiological techniques and disciplines. Over 150 attendees joined BIOPAC at the 2019 T4 Conference staged once again at the beautiful University of California at Santa Barbara campus. Participants and instructors winged in from China, Australia, Germany, Sweden, Italy, Spain, U.K., Ireland, and Egypt, as well as from wide regions of the U.S and Canada to soak up the idyllic surroundings of this ocean-side campus.

The focus of BIOPAC’s T4 Conference was to provide a fun, relaxed environment while hosting nearly 40 hands-on, human physiology training workshops chaired by over 20 distinguished instructors from around the globe. One of the many conference highlights was the “Mindfulness, Meditation, and Measurement: Mindfulness Exercises in Physiological Monitoring” session, hosted by Dr. Allan Weiss of the University of Southern California and  BIOPAC Co-founder and Director of R & D Alan Macy. These sessions, conducted in two parts over a two day period were booked beyond capacity, even though the early morning fog hadn’t yet lifted from the campus skyline.

The varied additional sessions covered a range from the basics, “Setting Up Your Lab, Getting Great Data and Troubleshooting,” (hosted by Dr. Terry Blumenthal of Wake Forest University, and BIOPAC’s Alan Macy and Tim Cook), and “Creating Your Own Lessons Using BSL PRO,” (hosted by Dr. Taffeta Elliot of the New Mexico Institute of Mining and Technology), to exciting new technologies such as “Integrating Screen-based Eye Trackers with AcqKnowledge,” with Keith Jackson of BIOPAC partner company EyeTech, BIOPAC CEO Frazer Findlay, and BIOPAC Engineering Manager Ed Peterlin. Additional wide-ranging physiological disciplines were also covered, including MRI techniques, stimulation, and exercise physiology. All sessions were conducted using BIOPAC hardware and software systems, as well as platforms provided by BIOPAC partners such as Cedrus, fNIR, WorldViz, Psychology Software Tools, and CNSystems. At the end of each day, it was time to relax and unwind with a beverage of choice, a a walk along the beach, and some good conversation. Each evening featured excellent meals and camaraderie in the relaxed yet elegant environment of some of Santa Barbara and Goleta’s most stunning surroundings. After three great days of immersive sessions, it came time for everyone to part ways, having forged new collaborative partnerships and an enhanced knowledge about the full potential of BIOPAC and BIOPAC partner products.

You don’t have to wait for T4 2021 to learn more about life science data—watch Fundamentals of Physiological Data Recording now!

For a closer look at T4, and a preview of what is sure to be an exciting 2021 event, we invite you to visit our T4 Human Physiology Conference page.

Looking for additional resources, tips, tricks, and expert advice on BIOPAC and BIOPAC Partner products? Please also visit our Webinars and Video Tutorial pages.


BIOPAC offers a wide array of wired and wireless equipment that can be used in your research. To find more information on solutions for recording and analyzing signals such as ECG, heart rate, respiration and more using any platforms mentioned in this blog post, you can visit the individual application pages on the BIOPAC website.

Best Practices for Recording & Analyzing Data

Over the past several years, tools and techniques for recording and analyzing physiological data recording have seen steady and marked improvement. Modern life science data acquisition systems such as the MP160 System and powerful research-grade software suites such as AcqKnowledge bring high-end physiology tools within reach of the smallest lab. Even with continuing advances and reduced margin for error, it remains prudent to follow some fundamental guidelines for maximizing data quality and clarity.

Preparation is important. First, invest time exploring the system if it’s new or unfamiliar. An overview of the documentation, training videos, and available webinars, as well as some practice runs with the hardware and software will save time and effort when the time comes to conduct a study. This will also build proficiency at identifying the differences between good and poor data.

Next, familiarize yourself with the type of electrodes and/or transducers necessary for the physiological signals you will be acquiring, which includes proper electrode and skin site preparation. For example, gently abrading the skin prior to applying electrodes is normally recommended for most signal types, except for electrodermal activity (EDA), in which case it’s vital to NOT abrade the skin beforehand. It is also helpful to wait at least 5 minutes before starting a recording, which enables the electrode gel to be absorbed into the skin, helping reduce the impedance.

Performing an impedance check to ensure that the electrodes are making good contact with the skin is also highly recommended. This task is made easier by using an Electrode Impedance Checker (such as EL-CHECK), a simple device for quickly measuring the resistance between the skin and the electrode that provides an LED readout of the skin/electrode contact quality. If the resistance is too high (indicating poor contact) proper adjustments can be made before starting an experiment.

For certain signal types, excessive participant movement can introduce unwanted artifact into the signal, resulting in poor or skewed data. Make sure the participant remains as still as possible during studies involving these signals. Using tape to attach the electrode leads to the skin and keep them from moving excessively can also be helpful.

A thorough check of the system and all connections, cameras, and other hardware is important, so that any problems with equipment or setup can be addressed in advance, thus avoiding a show-stopping issue in the midst of an experiment. This would include performing a pilot study with trained personnel in order to head off any unforeseen issues with the data collection.

Creating a lab setup conducive to a relaxed environment for the participant and technician alike will yield better results. This means eliminating clutter, noise, and other distractions that can affect comfort and attention span. Some labs even avoid having their staff wear lab coats because this can heighten participant nervousness.

Keeping detailed notes on successful lab setups is also helpful and will streamline the preparation process for future experiments. Additionally, creating and saving graph templates for regularly-repeated experiments will save further time and effort.

For more about the fundamentals of recording great data, we invite you to view this free on-demand webinar Fundamentals of Physiology Recording.


BIOPAC offers a wide array of wired and wireless equipment that can be used in your research. To find more information on solutions for recording and analyzing signals such as ECG, heart rate, respiration and more using any platforms mentioned in this blog post, you can visit the individual application pages on the BIOPAC website.

Photo by John Schnobrich on Unsplash

fNIRS Systems—a NIR miracle

At the dawn of the 19th century, pioneering astronomer Sir William Herschel discovered the existence of infrared radiation, which is electromagnetic radiation invisible to the human eye but identifiable via its ability to heat objects. Infrared radiation is commonly divided into three categories, near, mid, or far infrared waves. In ensuing years, infrared radiation was found to be useful for industrial, scientific, military, and law enforcement applications, such as heat signature tracking and night vision goggles. Over two decades ago, a new technology called near infrared spectroscopy (NIRS) was developed for non-invasively measuring specific aspects of human physiology using near infra-red waves. While far infrared waves lie closest to the microwave region, near infrared waves are closest in length to the visible light part of the electromagnetic spectrum, and are microscopic in size. Unlike far infrared waves, near infrared waves do not produce any heat. In fact, we can’t feel them at all. They are the small waves used by common devices such as a
remote control.

Today, near infrared waves are commonly used  for studying many application areas of human physiology, notably by the fNIRS Imaging Systems to gather precise, high-density brain function and muscle oxygenation data.

How does fNIRS work with regard to human physiology? It’s an optical technology which sends light into the tissue and records the light that scatters back via a photo-diode and sensor attached to the subject. The fNIRS continuous wave technology uses an optical window in the near infrared spectrum that enables light to pass through. For example, when you hold your hand in front of a strong white light, the tissue can appear red and almost translucent. fNIRS shines light into the skull or muscle tissue, and using special detectors, records the resulting light scatter that returns to the surface.  The light penetrates skin, bone, and alights on the brain before its return trip to the surface detectors, and accomplishes this painlessly without heat. In fact, the subject does not even feel the near infrared energy and the light is harmless. The result is startling images and functional data of the brain at work. The fNIRS Systems (ranging from Educational to High-Density versions) include fNIRsoft software for processing, analyzing and visualizing functional near infrared (fNIR) spectroscopy signals through a graphical user interface. Additionally, the fNIRS Systems work with the BIOPAC MP160 Research System and AcqKnowledge software in conjunction with other physiological signals such as ECG, respiration, cardiac output, blood pressure, electrodermal activity, and stimulus response markers. AcqKnowledge software also provides automated analysis tools for event related potentials and ensemble averaging.

fNIRS brain function application areas include workload assignment, VR,  stress, attention, geriatrics, economics, ergonomics, learning and performance, sports science, HCI, pain perception, and cognitive workload – low or high.

fNIRS Systems can also be used to measure muscle oxygenation data, including oxidative capacity, muscle load, lateral imbalances (left vs. right muscle group) oxygenated hemoglobin and de-oxygenated hemoglobin in muscle activity.

We invite you to enjoy a comprehensive free fNIRS webinar and to visit our fNIRS products page.

BIOPAC offers a wide array of wired and wireless equipment that can be used in your research. To find more information on solutions for recording and analyzing signals such as ECG, heart rate, respiration and more using any platforms mentioned in this blog post, you can visit the individual application pages on the BIOPAC website.

The Face of Facial Expression Analysis

Say you’re in a situation where it behooves you to keep a poker face. At an auto dealership negotiating a price on the new car of your dreams, or sitting across from your boss trying to make a case for a promotion. Your heart is pounding, sweat is forming in the crevasses of your palms, yet you need to keep yourself in check and not betray your excitement or apprehension. How skilled are we at masking emotions really? Emotions affect everyone in daily life, and play a key role in non-verbal communication. They are essential to understanding human behavior. A growing area of research is geared toward classifying and analyzing human emotions for a variety of studies, and methods for acquiring this data have become increasingly reliable and sophisticated. How do these studies work, and how is something as amorphous as the smallest twitch of a facial expression accurately recorded?

Facial “emotion reading” software such as FaceReader can detect minute variations in facial expressions by analyzing key points on the face (over 500) and has been “trained” with more than 10,000 manually annotated images to enhance facial modeling accuracy. Using this vast classification library, the input is distilled into six basic or universal emotions, (happy, sad, angry, surprised, scared, disgusted, or neutral.) Facial expression data is non-invasively gathered in real-time via a still or video camera, so no electrodes or leads are necessary.

But these refinements are more than skin deep. Additional tools for further quantifying facial expression data are commonly available. “Action Units” is the term used to describe individual or group facial muscle activity. The FaceReader Action Units add-on module allows automatic analysis of a selection of 20 common Action Units (such as raising of cheeks, wrinkling of nose, dimpling, and lip tightening) to measure affective attitudes (such as interest, boredom, and confusion).

Facial expressions can be visualized as bar graphs, in a pie chart, and as a continuous signal. Using FaceReader integrated with AcqKnowledge software and the MP160 System extends the functionality. Not only is the data automatically synchronized with other signals (ECG, fEMG, EDA, etc.,) but the recorded facial video can be monitored in the FaceReader display for real-time feedback.

Perhaps with a bit of practice, you can pull off that promotion and be able to afford that new car without tipping your hand!

For more information about FaceReader Software, watch the free On-Demand Webinar, “Using Facial Expressions to Understand Behavior” with BIOPAC CEO Frazer Findlay.


BIOPAC offers a wide array of wired and wireless equipment that can be used in your research. To find more information on solutions for recording and analyzing signals such as ECG, heart rate, respiration and more using any platforms mentioned in this blog post, you can visit the individual application pages on the BIOPAC website.

Think As Scientists Think—Empirical Research Skills

Learning to think as scientists think is empowering and drives this process and “Hard” and “soft” research skills combine well with Biopac Student Lab Lessons.

(Photo © 2016 Knowledge Growers, Inc.)

By Howard Iver Thorsheim, Ph.D., St. Olaf College

“Hard” and “soft” research skills combine well with Biopac Student Lab Lessons; for example:

  • Working as members of cooperative-learning teams;
  • Learning about basic psychophysiological measures;
  • Organizing supplies;
  • Following a protocol to greet a participant;
  • Explaining proposed procedure, and obtaining written informed consent using a form they draft;
  • Preparing participant, placing electrodes, and manipulating independent variables;
  • Debriefing participant;
  • Analyzing and graphing results;
  • Writing up research results in APA format.

Since the goal is learning skills for thinking, many of the usual requirements for rigorous research headed for publication can be relaxed for beginning students. This can motivate students for advanced student research honors projects or faculty/student research. Some examples of requirements that can be relaxed include naive participants (team members can serve as experimental participants in each other’s explorations—availability samples), sample sizes large enough to attain statistical power (instead two or three can be sufficient), and random assignment to conditions.

Learning to think as scientists think is empowering and drives this process, and some examples include students thinking about:

  • Articles of interest students find in data base searches that lead to their own research questions to explore;
  • Which psychophysiological measures they have practiced would provide information to help them learn more about their research question;
  • What they want their participants to do;
  • Key issues of experimental and statistical control, and
  • Any other equipment or supplies they might need to arrange for in addition to what is available within the limitations of available apparatus and facilities.

Before they may proceed, beginning students present their thinking on such issues to me as their consultant.

I provide a rubric with many tips, such as noting what they observed during the experiment that could have unintentionally influenced the results, describing strengths and limitations of their conclusions based on their findings, and answering the “So what?” question to extend their findings into their own life and think about the implications such findings might have for them.

See following for more ideas for teaching empirical research skills to help students think as scientists think, with research support:

Thorsheim, H. I. (2015). Experimental psychology. In D. S. Dunn (Ed.), The Oxford Handbook of Undergraduate Psychology Education. New York: Oxford University Press, 387-401. (Focus is.)


Learn more about BIOPAC’s education solutions, including complete teaching systems for psychophysiology and the life sciences. BIOPAC also provides a wide range of research systems for recording, displaying, classifying, and analyzing psychophysiological measurements.

BIOPAC Systems, Inc. provides life science researchers and educators with data acquisition and analysis systems that inspire people and enable greater discovery about life. Visit us at www.biopac.com.

Professor Thorsheim is a licensed Psychologist, educator, and author. He has published or presented over 125 papers, journal articles, books, book chapters or monographs, and received a patent in 1985 as a co-inventor for an educational book design with interactive elements. His work has been funded by marquee foundations across the globe. His most recent work is Doing Psychophysiology: Getting Started, available from Knowledge Growers, Inc., available as an iBook download in 51 countries.

error: Content is protected !!