Filtering

There are a few basic filter types and many methods available to implement those types. Commonly used filters are: Lowpass, Highpass and Bandpass.

By Alan Macy, BIOPAC Systems, Inc.

Filtering is a core signal processing function. Filtering is the act of discrimination between one type of data and another. In the case of physiological signal processing, filters are employed to attenuate undesired signal frequencies and emphasize others. There are a few basic filter types and many methods available to implement those types. Commonly used filters are: Lowpass, Highpass and Bandpass. In the case of a Lowpass filter (LPF), signal frequencies lower than the filter cutoff frequency are emphasized versus those higher than the cutoff frequency. For a Highpass filter (HPF), the signal frequencies higher than the filter cutoff frequency are emphasized versus those lower than the cutoff frequency. A Bandpass filter (BPF) has two cutoff frequencies, a low and high cutoff. In this case, signal frequencies between the filter cutoff frequencies are emphasized versus those lower then the low cutoff frequency and higher than the high cutoff frequency. All types of filters can be crafted as a combination of Lowpass, Highpass and Bandpass filters. For example, a comb filter can be constructed from a cascaded series of Bandpass filters.

Filters can be implemented as analog or digital. Analog filters are physically realized using electrical components, such as resistors, capacitors, inductors, delay lines and operational amplifiers. Digital filters are implemented as an algorithm, which may reside in a computer, embedded microprocessor or digital signal processor. Digital filters require the signal data to be digitized, prior to processing. An analog to digital converter is used to convert time-varying signal data into a sequential string of proportional numbers. Digital filters process this input string of numbers to generate an output string of numbers. This output string of numbers can then be converted back into a time-varying signal through the use of a digital to analog converter.

Analog filters can be reasonably well-emulated by the combination A/D converter > Digital Filter > D/A converter. In the case of physiological measurements, it’s most common to employ analog to digital converters to direct the signal data straight to the computer. Once in computer memory, digital filters can be applied to the data to extract the signals of interest.

There are two popular algorithms used to implement digital filters, Finite Impulse Response (FIR) and Infinite Impulse Response (IIR). Both FIR and IIR filters incorporate delay elements, multipliers and a summing junction, however FIR filters don’t use feedback and IIR filters do use feedback. Feedback in an IIR filter means that some portion of the filter’s output is introduced back to the filter’s input. Assuming a perfect IIR filter, the recursive process implies that any input signal to the filter will have a residual influence on the output of the filter for an arbitrary period of time. This is why feedback or recursive filters are called infinite impulse response filters. An impulse applied to an IIR filter will produce a response that lasts for eternity. In practice, however, the impulse response of IIR filters will ultimately drop to a value range which can no longer be properly characterized by the significant digits employed during processing. Accordingly, the effective impulse response of IIR filters remains finite.

An FIR filter does not incorporate feedback or recursion into its design. This type of filter pushes the signal data through the filter in just one direction. In order to make an effective FIR filter, typically many internal filter stages are needed. A FIR filter stage consists of a delay element combined with a multiplier element. A 101 stage FIR filter will have 101 sequential delay stages and 101 multiplier stages. The multiplier stages sample the data present after each delay stage and multiplies the sensed value by some predefined constant, called a coefficient. The multiplier stage outputs are all summed together to create the FIR filter output.

Because IIR filters are recursive and FIR filters are non-recursive, they differ in important ways. If not properly designed, IIR filters can be unstable. Instead, no matter how an FIR filter is designed, it’s inherently stable. IIR filters do not have perfectly linear phase, even if they can be designed to have reasonably linear phase in regions of interest. FIR filters can have perfectly linear phase. Linear phase means that the filter will delay all frequencies by the same time period. This time delay is known as group delay. Linear phase filters can faithfully mimic the essential shape of complex input waveforms, whereas non-linear phase filters may introduce certain distortions to the shape of an input waveform. Because of similarities in topology, certain types of IIR filters are well-suited to emulate certain analog filters. Because analog filter design methods are very advanced and well-documented, this topological similarity allows analog design methods to be transposed to the digital domain. For example, common analog or digital IIR filter can both implement a transfer function defined by a ratio of biquadric functions. These filters are known as biquads or second order filters. When designing a biquad IIR filter, the biquad analog transfer function is converted to digital form via a substitution process called the bilinear transformation.

For more information on BIOPAC’s wide range of tools for recording, displaying, and analyzing EEG measurements and filtering data from human and animal subjects, visit BIOPAC’s filtering or electroencephalography pages, and view BIOPAC’s full line of electrodes, amplifiers, and wearable, wireless transmitters and loggers.

BIOPAC Systems, Inc. provides life science researchers and educators with data acquisition and analysis systems that inspire people and enable greater discovery about life. Visit us at www.biopac.com.

Electrodes for Physiological Recording

By Alan Macy, BIOPAC Systems, Inc.

In the context of human physiological recording, an electrode is a conductive probe which is used to sense the presence of biopotentials arising at points in the body. When biopotentials are generated in the body, they can be sensed using a differential voltage amplifier. When a biopotential source activates, electrons are moved within the volume of the source thus creating a voltage potential difference (positive to negative) across the volume of the source. Biopotential sources are continually changing in the body, so the associated differential voltage potentials change too.

Electrodes establish an equipotential area when attached to a location on or in the body. An equipotential area means that anywhere on the surface area of the electrode the potential (voltage) will be the same. This is because electrodes are substantially more conductive than the surrounding tissue. To record a biopotential signal, two electrodes are required. The pair of electrodes will measure the voltage which is impressed between the two equipotential areas created by the electrodes.

Biopotential recording electrodes are of two types, namely invasive and noninvasive. Invasive electrodes are designed to sense biopotentials inside the body, meaning they are inserted inside the body, past the skin boundary. Historically, invasive electrodes have been designed as needles or wires to better penetrate the skin. By controlling the conductive and insulating areas of the needle or wire, the electrode can be used to sense biopotentials originating at any depth in the body volume. If the invasive electrode is to be inserted into the body for a long time, then the electrode might take a different shape, such as a conductive disk which can be sutured into place.

Noninvasive electrodes are designed to sense biopotentials which manifest on the outside skin surface. These kinds of electrodes do not penetrate the skin surface layer. Because the body is a volume conductor, biopotentials originating anywhere in the body travel to the entire skin surface area. As an example, a polarized biopotential wave is generated by the heart during the course of each beat. This signal is easily detectable between any two locations on the body’s skin surface that are physically oriented to different sides of the heart.

In practice, it’s best to collect biopotential data as near to the biopotential generating site as possible for the best recording. This is because the body generates a large number of biopotential signals, sourced from a variety of excitable cells. Because the body is conductive, a myriad of these signals will superimpose at any body recording location. As the distance grows between a particular source and the differential recording location, the source signal attenuates. Sources, that are subject to a range of attenuation, will simply add to the desired signal being measured, as they are included in the volume conduction path defined by the differential biopotential recording.

When collecting biopotential data from surface electrodes, the contact area of the electrode has an impact on the frequency and amplitude components recorded in the biopotential. Because the body volume is relatively conductive, increased electrode surface area has a tendency to reduce biopotential amplitudes and suppress higher frequency components. This happens because multiple, and often uncorrelated, biopotential sources in the body can act in random opposition as the various biopotentials superimpose in the conductive body volume and then express on the skin surface. A biopotential averaging process takes place in the body tissue volume and an aspect of the averaged signal is reflected on the skin surface area. This biopotential signal averaging quality increases in scope as the size the measurement surface electrodes increases.

If a biopotential electrode is reduced in size and then inserted into the body near the location of interest, then measured signals will typically increase in amplitude and frequency components. These kinds of electrodes are called needle or wire electrodes and typically have an insulating needle shaft with a conductive tip. Despite certain benefits of needle electrodes, complications can arise when breaking the skin barrier and inserting foreign objects into a subject’s body. Needle electrodes can be difficult to use because they have smaller surface area than surface electrodes. Furthermore, smaller contact surface area always means that the electrode contact impedance is higher. Very high contact impedance, typically in excess of 1 Mohm, specifies the need for excellent lead shielding and specialized input amplifier characteristics.

Biopotential measurements from surface electrodes on the body have material harmonic content of less than 500 Hz. Nearly all of the signal power which can be collected from surface electrodes is between DC and 500 Hz. If the electrode is smaller, such as a conductive-tipped needle, and inserted through the skin surface to near the biopotential of interest, biopotential signal frequencies can exceed 10,000 Hz.

For more information on BIOPAC’s wide range of tools for recording, displaying, and analyzing biopotential measurements from human and animal subjects, visit BIOPAC’s electrocardiograpy, electromyography,  or electroencephalograpy pages and view BIOPAC’s full line of electrodes, amplifiers, and wearable, wireless transmitters and loggers.

BIOPAC Systems, Inc. provides life science researchers and educators with data acquisition and analysis systems that inspire people and enable greater discovery about life.  Visit us at www.biopac.com.

Electroencephalography (EEG) Pt. 2

Short-term Electroencephalography or EEG measurements are typically performed in synchrony with well-controlled, environmental, stimuli. Signal-averaging measurements, of this type, are known as Event Related Potentials (ERPs).

By Alan Macy, BIOPAC Systems, Inc.

This blog is a continuation of the previous discussion of Electroencephalography or EEG. Short-term Electroencephalography or EEG measurements are typically focused on the nature of cognition. These types of recordings are typically performed in synchrony with well-controlled, environmental, stimuli. Signal-averaging measurements, of this type, are known as Event Related Potentials (ERPs). There are a range of ERP signals, stretching between 50 ms to many seconds, with respect to the occurrence of the event. ERPs require signal averaging methods, to be observed, because their amplitude levels (0.2-2 uV) are usually lower than the ambient EEG signal level.

ERPs can be generated by a wide range of stimuli. The stimulus event can be targeted to any specific human sense or combination of senses (auditory, visual, olfactory, touch or taste). ERPs indicate the superimposed potentials of neuronal activity that synchronously generate when a subject processes sensory information. There are two general types of human subject ERPs. Early ERP wave components occur before 100 milliseconds after the stimulus. Late ERP components occur after 100ms after the stimulus. Early ERPs are known as exogenous potentials and late ERPs are known as endogenous potentials. Exogenous potentials depend on neuronal sensory structure responses that occur prior to cognition.  Endogenous potentials depend on cognitive responses to the sensory stimuli.

Slow Cortical Potentials (SCPs) are a class of ERPs that are characterized by slowly-moving, stimulus-related changes in the EEG signal. SCPs originate in cell concentrations in the top cortical layer of the brain. SCP waves (0.01-3 Hz) are EEG signals that occur before and after stimulus presentation. They encompass such pre-stimulus measures as Contingent Negative Variation (CNV) and Readiness Potential (RP).  The CNV is a slow-changing negative potential that happens between an initial warning and a “go” stimulus.  NV amplitude depends on the subject’s expectation of an imagined, forthcoming event. The RP is associated with the beginning of movement.  The RP precedes movement and is identified as a slow-changing negative potential that maximizes with movement onset. The RP is observed when signal averaging the EEG, from the motor cortex, synchronously with movement.

EEG can be useful to:

  • Monitor alertness and conscious states
  • Evaluate inhibitory control over behavior
  • Locate areas of neural damage
  • Establish levels of cognitive engagement
  • Investigate brain disorders, such as Alzheimer’s, epilepsy and seizures
  • Establish brain / computer interfaces
  • Monitor sleep

For more information on BIOPAC’s wide range of tools for recording, displaying, and analyzing EEG signals from human and animal subjects, including automated EEG analysis, seizure detection, evoked responses and many others, visit BIOPAC’s EEG Analysis page or view BIOPAC’s full line of electrodes, amplifiers, and wearable, wireless transmitters and loggers.

BIOPAC Systems, Inc. provides life science researchers and educators with data acquisition and analysis systems that inspire people and enable greater discovery about life.  Visit us at www.biopac.com.

Electroencephalography (EEG) Pt. 1

An EEG recording can be short or long-term. Shorter-term, signal-averaged, EEG measurements are typically used to evaluate precognitive and cognitive processes with respect to specific stimuli.

by Alan Macy, BIOPAC Systems, Inc.

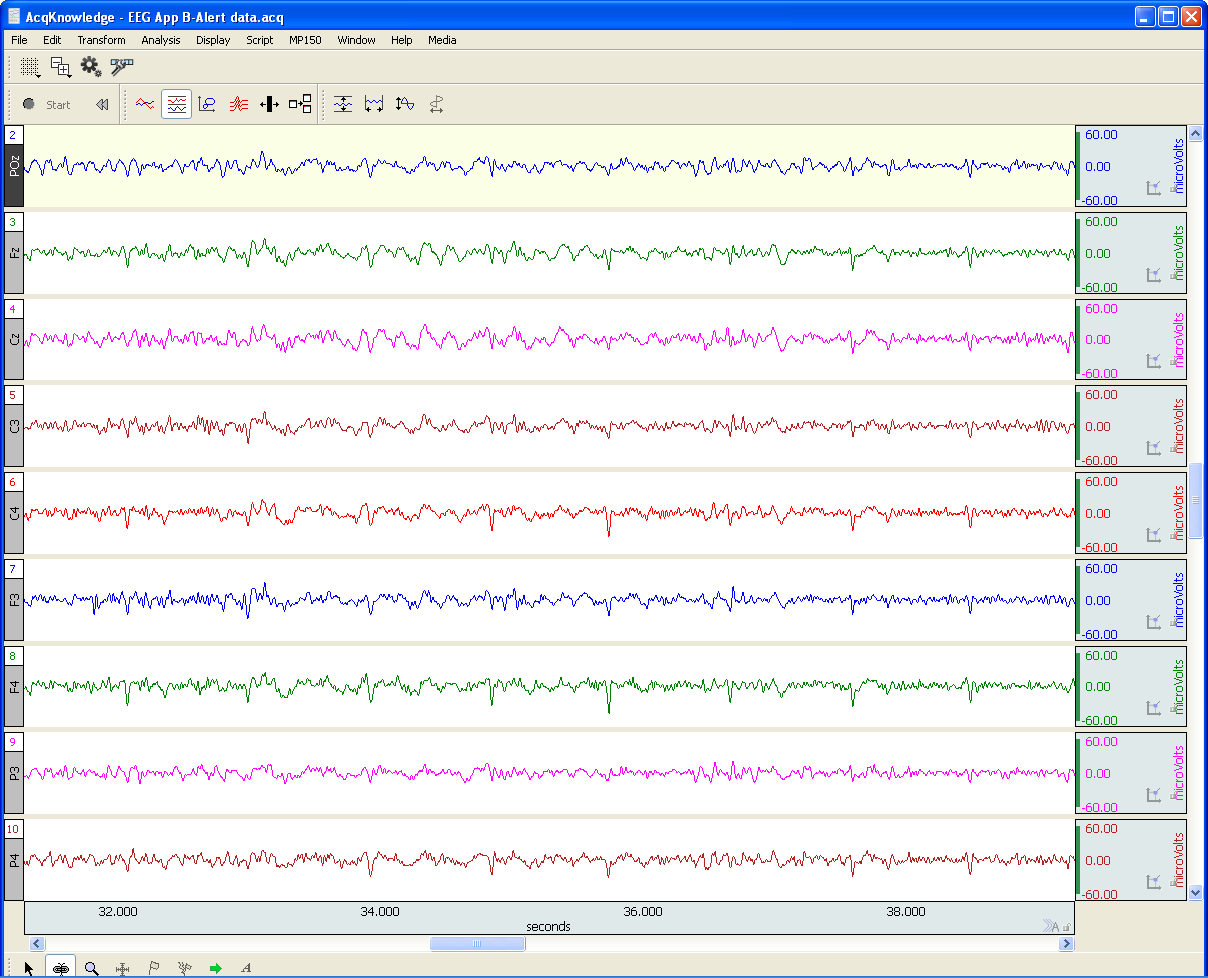
EEG or Electroencephalography is the measurement of differences in electrical potential (voltage) between points on the scalp. These voltages differences are the result of ionic current flow within neurons, and glial cells, in the brain. The measured scalp voltages are primarily in the 200 nV-200 uV amplitude range, 0.01 Hz – 100 Hz frequency range, and are typically simultaneously recorded at multiple sites on the scalp. The EEG is usually collected using the 10-20 electrode montage. This arrangement of electrodes typically references left or right hemisphere electrodes to the left or right earlobe (or mastoid), respectively. However, a wide range of signal referencing methods are used depending on the situational requirements.

An EEG recording (knows as an electroencephalogram) can be short or long-term. Shorter-term, signal-averaged, EEG measurements are typically used to evaluate precognitive and cognitive processes with respect to specific stimuli. These EEG signals have relatively low amplitude levels, typically 200 nV – 2 uV, so signal averaging methods are required to discern these signals from background concurrent EEG sources. Longer-term, non-signal-averaged, EEG measurements are used to discern the subject’s, real-time, conscious state. Different and observable wave rhythms are evident during such recordings. Commonly observed rhythms include: Delta, Theta, Alpha, Beta and Gamma waves. These waves can be continuously recorded and are in the range of 2 uV – 200 uV.

Delta waves (0.5-4 Hz) are considered slow rhythms and tend to be the highest in amplitude. Delta waves are normally the dominant rhythm in infants. Delta waves are found in sleeping adults and consistent Delta is considered abnormal in conscious adults.  Delta waves are low-frequency EEG patterns that increase during sleep in the normal adult.  Although Delta waves are generally prominent during sleep, there are cases when Delta rhythms are recorded from awake individuals. Delta waves may increase during difficult mental activities requiring concentration and other continuous-attention tasks. Delta rhythms depend on activity of motivational systems, in the brain, and participate in the identification of prominent phenomena.  The presence and amplitude of Delta rhythms are highly variable within and between individuals.

Theta waves (4-8 Hz) are considered slow rhythms. Theta waves are normal in children up to 13 years old.  Theta waves are found in sleeping adults and consistent Theta is considered abnormal in conscious adults. Theta rhythms are low-frequency EEG patterns that increase during sleep in the normal adult. Although Theta rhythms are generally prominent during sleep, there are cases when theta rhythms are recorded from awake individuals.  Theta rhythms are involved in memory and emotional regulation. Theta waves will spike during emotional responses to frustrating events or situations.  Theta waves are associated with the inhibition of elicited responses, in that Theta activity has been found to temporarily increase when a person is actively trying to repress a behavioral response. The presence and amplitude of theta rhythms are highly variable within and between individuals.

Alpha waves (8-13 Hz) are considered moderate rhythms and usually seen in the occipital regions of the head and are higher in amplitude on the dominant side. Alpha waves appear when relaxing and closing the eyes. Alpha waves are suppressed when opening the eyes or coming to an alert state. Alpha waves are the primary rhythm observed in relaxed adults and are present during most of life after 13 years old. Each region of the brain has a characteristic Alpha rhythm amplitude and the largest Alpha waves are from the occipital and parietal regions of the cerebral cortex. Alpha rhythms correlate with inhibitory processes in the brain. Reduced Alpha wave occurrence and amplitude, in relation to Delta-Theta activity, is associated with reduced inhibitory control over behavior.

Beta waves (13-30 Hz) are considered fast rhythms. Beta waves are typically observed on both sides of the head and are most evident frontally (executive function). Beta waves may be substantially reduced in areas of cortical damage.  Beta waves are considered normal and are the dominant rhythm in subjects whose eyes are open or are otherwise attentive to external stimuli or exerting specific mental effort. Beta rhythms also occur during rapid eye movement (REM) sleep. In this situation, the typical Alpha rhythm is suppressed and supplanted by Beta waves. This replacement of Alpha rhythm is called desynchronization, or “Alpha block”, because it represents a change in the synchronized activity of neural systems in the brain. It is thought that Beta waves represents arousal of the cortex to a higher state of alertness and may also be associated with memory retrieval.

Gamma waves (30-100 Hz) are considered fast rhythms. Gamma waves are present during mixed sensory processing, such as perceptual tasks that combine hearing and seeing. Gamma waves are also evident during short-term memory matching of recognized sights, sounds or sensations. A reduction in Gamma wave activity might be associated with cognitive decline, especially when compared to Theta wave activity levels.

Long-term EEG signal characteristics are related to consciousness. As conscious activity increases, the dominant EEG rhythms shift to higher frequencies. When asleep, with the exception of REM, the dominant EEG rhythms move to lower frequencies.  In deep sleep, the EEG is characterized by low frequency Delta waves.

This blog is continued in Part 2.

For more information on BIOPAC’s wide range of tools for recording, displaying, and analyzing EEG signals from human and animal subjects, including automated EEG analysis, seizure detection, evoked responses and many others, visit BIOPAC’s EEG Analysis or view BIOPAC’s full line of electrodes, amplifiers, and wearable, wireless transmitters and loggers.

BIOPAC Systems, Inc. provides life science researchers and educators with data acquisition and analysis systems that inspire people and enable greater discovery about life.  Visit us at www.biopac.com.

error: Content is protected !!