Projection VR: Virtual Rooms Turn Science Fiction into Reality

Fans of Star Trek have long marveled at the technological innovations spawned from the imaginations of its creators—from warp drives that bend space to transporters beaming individuals from point A to B. Few of these speculative innovations inspired more wonder than the “holodeck,” a room that creates a simulated sensory experience nearly indistinguishable from reality, where crew members can train, study, or engage in recreation within the space’s artificial environments.

The border between science fiction and fact can be fluid, as proven by the proliferation of virtual reality (VR) technology in recent years, providing an immersive experience like that promised by the fictional holodeck. When thinking about VR in the modern sense, one usually envisions a person fitted with a head-mounted display (HMD) that delivers visual stimuli directly to the eyes, with movement and views controlled by directional sensors in the HMD and hand controllers.

While this can certainly deliver an immersive experience, HMD systems have their limitations. HMDs and controllers are often tethered via cables to the high-end computers needed to generate realistic imagery. This can limit the user’s ability to move and interact naturally in a virtual environment. A variation is something much closer to the holodeck of science fiction—a room in which a virtual environment is projected onto walls rather than displayed on a headset screen. This is the world of projection VR.

Virtual reality innovators like WorldViz are taking projection VR to the next level by creating highly-customizable virtual environments that can be scaled and adapted to a variety of tasks. One application in which VR projection rooms are being used is to train emergency medical technicians (EMT) and other first responders in realistic environments, such as on a virtual roadside. Trainees can move about performing first aid as cars seem to rush by, safe from real traffic hazards.

Outside of training and educational applications, projection VR and VR rooms have proven to be affective in a variety of research studies. These technologies have been used in machine learning and behavioral studies focusing on children with autism spectrum disorders (ASD). In such applications, HMD systems may cause motion sickness or discomfort for the participants with ASD. Projection rooms, however result in no significant negative impacts on the participants’ comfort while still providing an immersive experience.

VR Driver StudyAs mentioned, projection VR experiences allow for additional technologies to be introduced seamlessly into the virtual experience. A 2020 study of driver gaze habits integrated driving environments created in Vizard 5.0 and projected on a screen with eye tracking to determine how drivers process visual information behind the wheel. Participants were able to interact with real driving controls while their “vehicle” moved through the virtual environment as they focused on visual cues.

VR projection rooms are no longer restricted to fictional flights of fancy. Their real world use is limited only by the imaginations of those applying these potent tools in the classroom and research lab.


For more information on how projection VR can benefit research, education, and training, join a webinar hosted by BIOPAC as we explore this virtual frontier where science fiction becomes science reality.

Scaling Up: The Challenges of Large-Group Studies

When formulating an approach to a research study, planning experiments, and choosing the right technology for the job, size matters. Research studies with human subjects generally fall into three scale-related categories: individual, small-group, and large-group studies. When we discuss “size” in this context, we are talking about the number of subjects sampled together at one time and in one location.

Single-participant studies sample data from subjects separately while dyadic research gathers input from two subjects at the same time and place. It may be necessary, however, to take readings from three, four, or dozens of study subject simultaneously. In such cases, researchers often want to measure how the participants react to identical stimuli or the same external conditions such as those found in a classroom, courtroom, or theater setting. Researchers may also seek to measure how subjects react or interact with other members of the study group such as during business exchanges, in a meeting room environment, or in game sessions or other competitive settings.

These large-group studies present critical challenges that may not normally occur in single-participant studies. First, the stimuli to which the participants respond must be presented in a uniform and synchronous manner. Whether the stimuli are visual or auditory, thermal or olfactory, electrical or haptic, all study subjects must be able to respond to the same stimulus.

A recent study in behavioral economics measured psychophysiological reactions to various stimuli in the form of market and trading games in which multiple interactions took place between a set of “players.” Timing was critical to accurately measure the participants’ physiological responses to trades, losses, and gains. Both the presentation of stimuli and the recording of the participants’ reactions had to be precisely synchronized.

Methods for recording subjects’ response may include biopotential data such as ECG/EKG, EEG, EMG; transducer signals that can include electrodermal activity (EDA), respiration, and temperature; eye tracking; video recording; subjective response; or fNIRS, to name just a few examples. In the above study, participants were equipped with a photodiode that recorded responses during a decision-making experiment. Signals from the photodiodes were transmitted to a 16-channel BIOPAC MP150 Data Acquisition System (since replaced by the MP160 Data Acquisition System), allowing the simultaneous, synchronous recording of timing data from up to 16 subjects.

Child StudiesSynchronizing data is just one consideration when conducting multi-participant studies. Other logistical challenges arise when participants must interact with their surroundings. Another large-group study compared physical and psychological activity among seven-year-old elementary school children as they learned geometry through movement-based teaching methods. This presented several challenges, including the age of the subjects and the need for freedom of movement. Such problems are common to large-group studies that require multiple participants to move unimpeded by recording apparatuses. Typically, a researcher will choose between either a minimally invasive tethered device that can be wired to a data acquisition unit (e.g., BIOPAC ECG100D Smart Amplifier) or a wireless device (e.g., BIOPAC BN-ECG2 Wireless ECG Amplifier) that permits additional freedom of movement. In this study, the researchers used wearable devices to record the children’s energy expenditure, intensity of movements, EDA, body heat flux, and skin temperature.

While large-group studies present an array of unique challenges to gathering data, these challenges can be overcome through careful planning and by choosing the right tools for the job. BIOPAC offers a wide range of scalable technologies, software, and accessories for conducting research with individual subjects, pairs, or large groups that can be adapted to an array of scenarios and research settings.

Fielding a Media Psychophysiology Team

Author: Ashley Churchill, M.A., BIOPAC Midwest Sales

Media psychophysiology research is being embraced by a variety of communication departments around the world. Media psychophysiology generally refers to the measurement of biological responses to messages in order to understand viewers’ cognitive and emotional processing of video, audio, or print messages. Media researchers often focus on measuring processes that occur as one interacts with media content over time and they look for insights into how and why certain media effects emerge (see Potter & Bolls, 2012 for more background).

Social science labs and communication researchers might feel daunted when starting up a lab if they are inexperienced in collecting physiology data. Here are three common strategies that will support the development of a media lab team and contribute to its success.

Ensure the research team has access to and is comfortable seeking out assistance from a variety of resources. Psychophysiology is a fundamentally interdisciplinary science. Incorporating it into your research requires that you draw on both technical and conceptual knowledge from disciplines outside of social science. To complicate things, formal psychophysiology resources can be difficult to find within the typical social science department. Effectively using external resources like subject librarians, university IT, faculty across departments, and BIOPAC’s support team, can help overcome this challenge.

Explain the conceptual aspects of media psychophysiology to your research assistants, whether they are volunteering for the semester or plan to stick around for a few years. Providing RAs with a conceptual background regarding relationships between media, psychology, and physiology can mean the difference between success and failure as far as effectively identifying and resolving problems during an experiment. It takes more than simple knowledge of electrode placement to make someone effective in a data collection role. Guiding RAs in a way that reflects this supports stronger research and researcher retention.

Preserve the practical knowledge generated by your team, do not let it leave with them. Learning how to conduct media psychophysiology research takes time and experience. As different team members rotate in and out of the lab over time, continue to support lab practices that preserve their knowledge and understanding of this research approach. Whether this takes the form of storing informative documentation or encouraging them to lead aspects of new member onboarding, these practices are important to improving the effectiveness of your team over time.

To find more information regarding media psychophysiology, check out our recent webinar featuring media psychophysiology expert Dr. Paul Bolls. To learn about signals that are common in media psychophysiology research— like fEMG, ECG, and EDA—visit our library of on-demand life science webinars.


BIOPAC offers a wide array of wired and wireless equipment that can be used in your research. To find more information on solutions for recording and analyzing signals such as ECG, heart rate, respiration, and more using any platforms mentioned in this blog post, you can visit the individual application pages on the BIOPAC website.

Photo by Vlad Hilitanu on Unsplash

VR—New Worlds to Explore

Use VR to Expand the Capabilities of Your Lab

The immersive technology of virtual reality (VR) literally offers whole new worlds to explore. Combining VR/Immersive Solutions with Physiology Data allows researchers to create virtual worlds that are impossible or prohibitively expensive in the real world. Additionally, researchers can synchronize VR events with physiological response data to record and analyze physiological, behavioral, and subjective response data. Multimodal stimulation can deliver visual (3D), auditory, olfactory, haptic, and/or electric stimulus to add an incredible degree of realism to the immersive world!

Interfacing a VR workstation with a data acquisition system can add a new dimension to your research by combining objective measures with a tightly controlled experimental protocol. Immersive environments can take the subject anywhere and allow you to unlock the boundaries of your physical lab space and budget.

  • Create rich 3D environments that are 100% personalized to match your protocol.
  • Send physiological data back to the VR world to make decisions based on the participant’s physiological responses

Participants can move around naturally within the virtual world while their physiological data is captured. Record any combination of signals: ECG, EDA, EEG, EOG, EMG, EGG, temperature, respiration, and pulse. Include eye tracking to track subjects’ gaze as they view the immersive environment during the experiment. Close synchronization between the stimuli and the physiological signals is achieved through digital markers.

Monitor data in real time and use detailed signal analysis for post-acquisition scoring of the data. Automated analysis routines can streamline the analysis process, eliminate subjectivity, and save time—see AcqKnowledge for some powerful options.

VR software provides you with an unlimited degree of flexibility to create a specific world and control people and items within the world. VR software is easy to use and adaptable, so researchers can make subtle changes to an experiment without having to redesign the entire protocol.

Immerse your subjects in a BIOPAC VR world and record physiological data as the virtual environment influences the subject. Applications are varied and include Psychology, Biomechanics & Kinesiology, Ergonomics, Marketing/Consumer Research, Healthcare, Computer Modeling/Simulation, Education, Training: hazard, medical, etc.,

Use a feedback loop for greater control and automation of the VR world. This allows the world to change in real time, based on the participant’s responses. Timing events are recorded for tight synchronization with physiological data for meaningful analysis.

See VR Resources here for more examples of how VR can expand the capabilities of your lab!

BIOPAC offers a wide array of wired and wireless equipment that can be used in your research. To find more information on solutions for recording and analyzing signals such as ECG, heart rate, respiration, and more using any platforms mentioned in this blog post, you can visit the individual application pages on the BIOPAC website.

Photo by stem.T4L on Unsplash

The Eyes Have It—Mobile Eye Tracking

Eye tracking has been a consistent player in the physiological research field for a number of years, and more recently a “mobile” variation of this technology has become increasingly widespread. But just what is mobile eye tracking and how does it work? Unlike eye tracking studies tethered to a lab, where a participant visually follows an object on a computer screen, mobile eye tracking data can be acquired outside of the lab. All that is required, in fact, is a pair of glasses. Not just any glasses, but ETVision glasses, capable of recording not only multiple parameters of a participant’s “eye image” but also the scene the participant is gazing at and responding to. Let’s look briefly on how eye tracking glasses work. The lightweight ETVision glasses are equipped with two eye-facing cameras combined with a pair of LEDs for recording the various components of the “eye image,” such as pupil size/position, gaze path, fixation (when the participant’s eyes lock onto an area of interest), internal and external data markers, vergence angle (angle between the eyes), and corneal reflections (CRs). The cameras also look at the contrast between the pupil and the surrounding iris. This constant real-time feedback is recorded every 5.5 milliseconds and the eye images are rendered at 180 frames per second.

In addition to eye cameras, a built-in forward-facing 720p scene camera records the viewable area in front of the participant. This enables the landscape or scenery the participant is looking at to be combined and synchronized with the eye image data (say, if the participant is driving a car or riding a mountain bike).

Did I say riding a mountain bike? Yes. Full eye tracking data can be collected and stored in a 256 GB SD card and the logged data exported to a .*csv file, which in turn can be imported into AcqKnowledge software along with other logged physiological data. The glasses also have a coated visor for reducing glare. (Glare causes squinting and the eye tracking cameras do not perform as well on eyes that are squinting or closing due to excessive light or reflections.)

In addition, a small microphone built into the eyeglasses enables two-way audio between the investigator and the participant. Already wear glasses? No problem. Eye tracking glasses can be worn over corrective lenses without issue. However, contact lenses should be cleaned before wearing them under eye tracking glasses. The glasses are connected to a small controller via a standard HDMI cable, and the controller houses a 256 GB SD card. In addition to the SD card used for logging remote data, the controller can also be connected to a host computer via WiFi or LAN. The lithium-polymer battery will run the eye tracking glasses for 5.5 hours on a full charge.

Using the AcqKnowledge software’s Media feature, the eye tracking video data can be replayed with a tight correlation to other physiological data collected during the experiment by the BioNomadix Logger. (Other data acquisition hardware types, such as MP160 or MP36R, can be used within the lab.) The eye tracking video and graph data can be displayed side-by-side on the screen. Placing the I-beam cursor at any point in the AcqKnowledge graph takes you to the corresponding point in the eye-tracking video (say, during activities such as driving a car). Eye tracking data for vertical position, horizontal position, pupil diameter, and more can be imported as channels into the AcqKnowledge graph. This data will be synchronized with the eye tracking video, along with any added event markers.

Interested in more details about ETVision Eye Tracking Glasses and AcqKnowledge software? To see it all in action, we invite you to view our free on-demand Mobile Eye Tracking Webinar.


BIOPAC offers a wide array of wired and wireless equipment that can be used in your research. To find more information on solutions for recording and analyzing signals such as ECG, heart rate, respiration, and more using any platforms mentioned in this blog post, you can visit the individual application pages on the BIOPAC website.

Photo by Amanda Dalbjörn on Unsplash

Meet Them Where They Are—Portable Wireless Solutions

Once relegated to tightly controlled lab environments where electrode-laden participants were observed at close quarters, researchers are now able to extend the lab into the everyday environment over nearly limitless distances. Top quality physiological data can be acquired from untethered subjects performing tasks ranging from sleeping comfortably in their own beds to engaging in high-impact sports. How and when did this deep dive into unfettered physiology become possible? We offer a brief examination of the solutions currently offered as the 2020s emerge.

BioNomadix BioShirt

Lightweight, comfortable, and some might even say fashionable, the BioNomadix BioShirt uses a respiration sensor and fabric electrodes to wirelessly record respiration and ECG from ambulatory subjects performing unfettered tasks in short or long-term studies, in the lab, or in the real world. The shirt connects to a BioNomadix wireless Respiration & ECG Transmitter (BN-RSPEC) secured in a small pocket on the front of the BioShirt—no electrodes, gels, or wires need apply. Wireless data can be transmitted to a BioNomadix Smart Center, Logger or matched Receiver+MP160/MP150 System. BioShirts provide a high level of comfort and are ideal for long-term physiological monitoring. The ECG and respiratory signal are obtained by means of sensors made of yarns that are fully integrated into the shirt’s textile structure. Sensors are made of fibers directly woven during the production process, and connections between sensors are obtained using conductive fibers for a totally unobtrusive, highly comfortable sensorized garment. The base yarn is composed of anallergic and antibacterial materials to guarantee safe and prolonged use. Machine washable with mild detergent—do NOT use fabric softener.

Smart Center

The BioNomadix Smart Center is a small-form USB-powered data acquisition unit that can record data from up to three wireless BioNomadix transmitters at a time. The transmitters are automatically detected and paired using a guided setup wizard. Smart Center is compatible with 14 different BioNomadix Transmitter types encompassing all major body signals. AcqKnowledge data acquisition and data analysis software also supports monitoring transmitter battery levels, automatic configuration of derived signals and guided analysis based on the type of recorded signals. Adhesive Velcro disks are included for mounting on various surfaces. Smart Center offers a compact and sophisticated physiology platform that sets up in minutes. Simply plug the Smart Center into the computer, set up the transmitters and subject, then start recording high quality data with AcqKnowledge software.

BioNomadix Wireless Wearable Physiology Logger

Offering the industry’s only system that delivers a comprehensive, 24-hour data logging solution in an easy-to-use, easy-to-wear package, the BioNomadix Logger truly delivers “physiology anywhere.” The BioNomadix Logger is the perfect tool for applications that demand greater degrees of subject freedom and complex experimental design. BioNomadix Loggers wirelessly record physiological data as subjects freely and naturally live their lives.

BioHarness Telemetry and Logging Systems

BioHarness with AcqKnowledge software is a lightweight portable biological data logger and telemetry system that monitors, analyzes, and records a variety of physiological parameters including ECG, respiration, posture, and acceleration. BioHarness applications include physiology, psychology, psychophysiology, exercise physiology, ergonomics, human factors, and more. The BioHarness operates in Bluetooth transmitting mode for live viewing of data or data logging mode. In the data logging mode, BioHarness acquires and saves the data for later download to AcqKnowledge software using the included USB docking and charging cradle.

Eye Tracking Glasses ETV

The ETVision (ETV) wearable unit resembles a pair of eyeglasses that can be worn by itself or over the participant’s prescription eyeglasses. The glasses incorporate miniature “eye cameras” for viewing each eye and a “scene camera” that views what the participant is looking at. A built-in microphone is included, and an optional visor can be mounted to the front of the headgear. Recording video and audio data to an SD card for later data processing allows the participant to be completely untethered during data recording. This is useful while engaging in long term activities away from the lab such as walking, bicycling, or driving.

For more information about BIOPAC wireless solutions, we invite you to view the following resources:


BIOPAC offers a wide array of wired and wireless equipment that can be used in your research. To find more information on solutions for recording and analyzing signals such as ECG, heart rate, respiration and more using any platforms mentioned in this blog post, you can visit the individual application pages on the BIOPAC website.

Photo by Fabio Comparelli on Unsplash

Eye Tracking Insights

Try Not To Blink—This Won’t Hurt

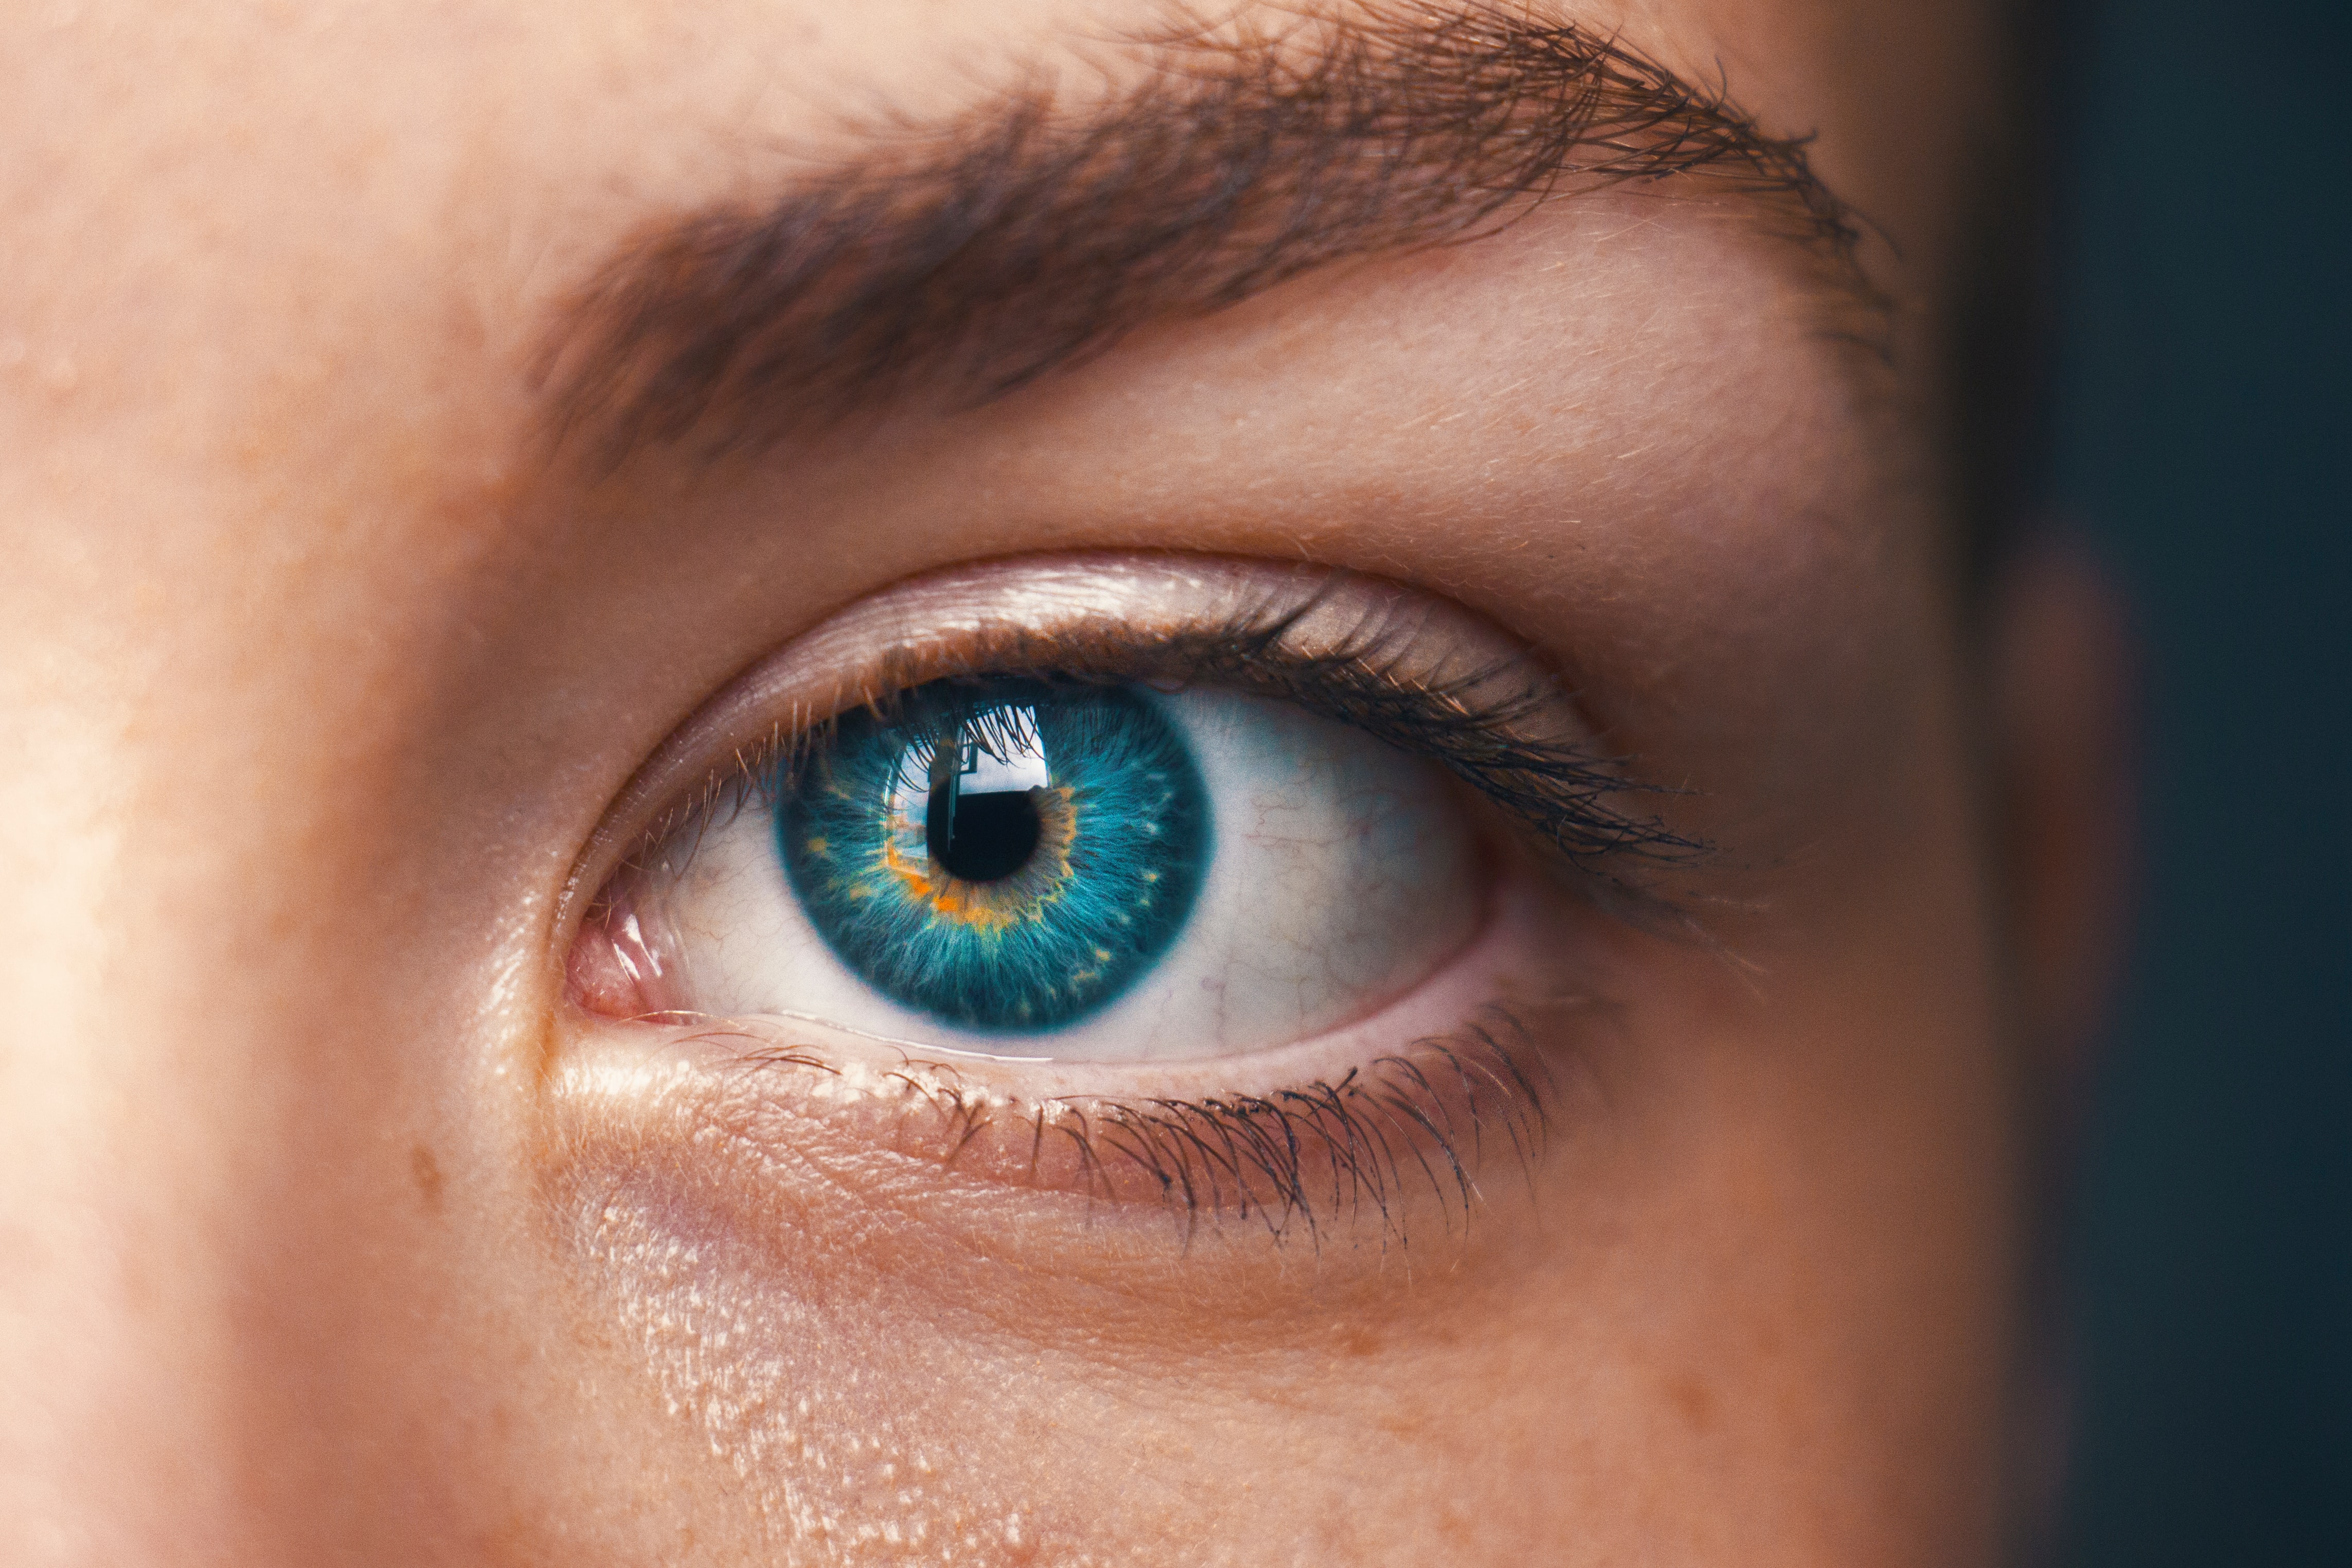
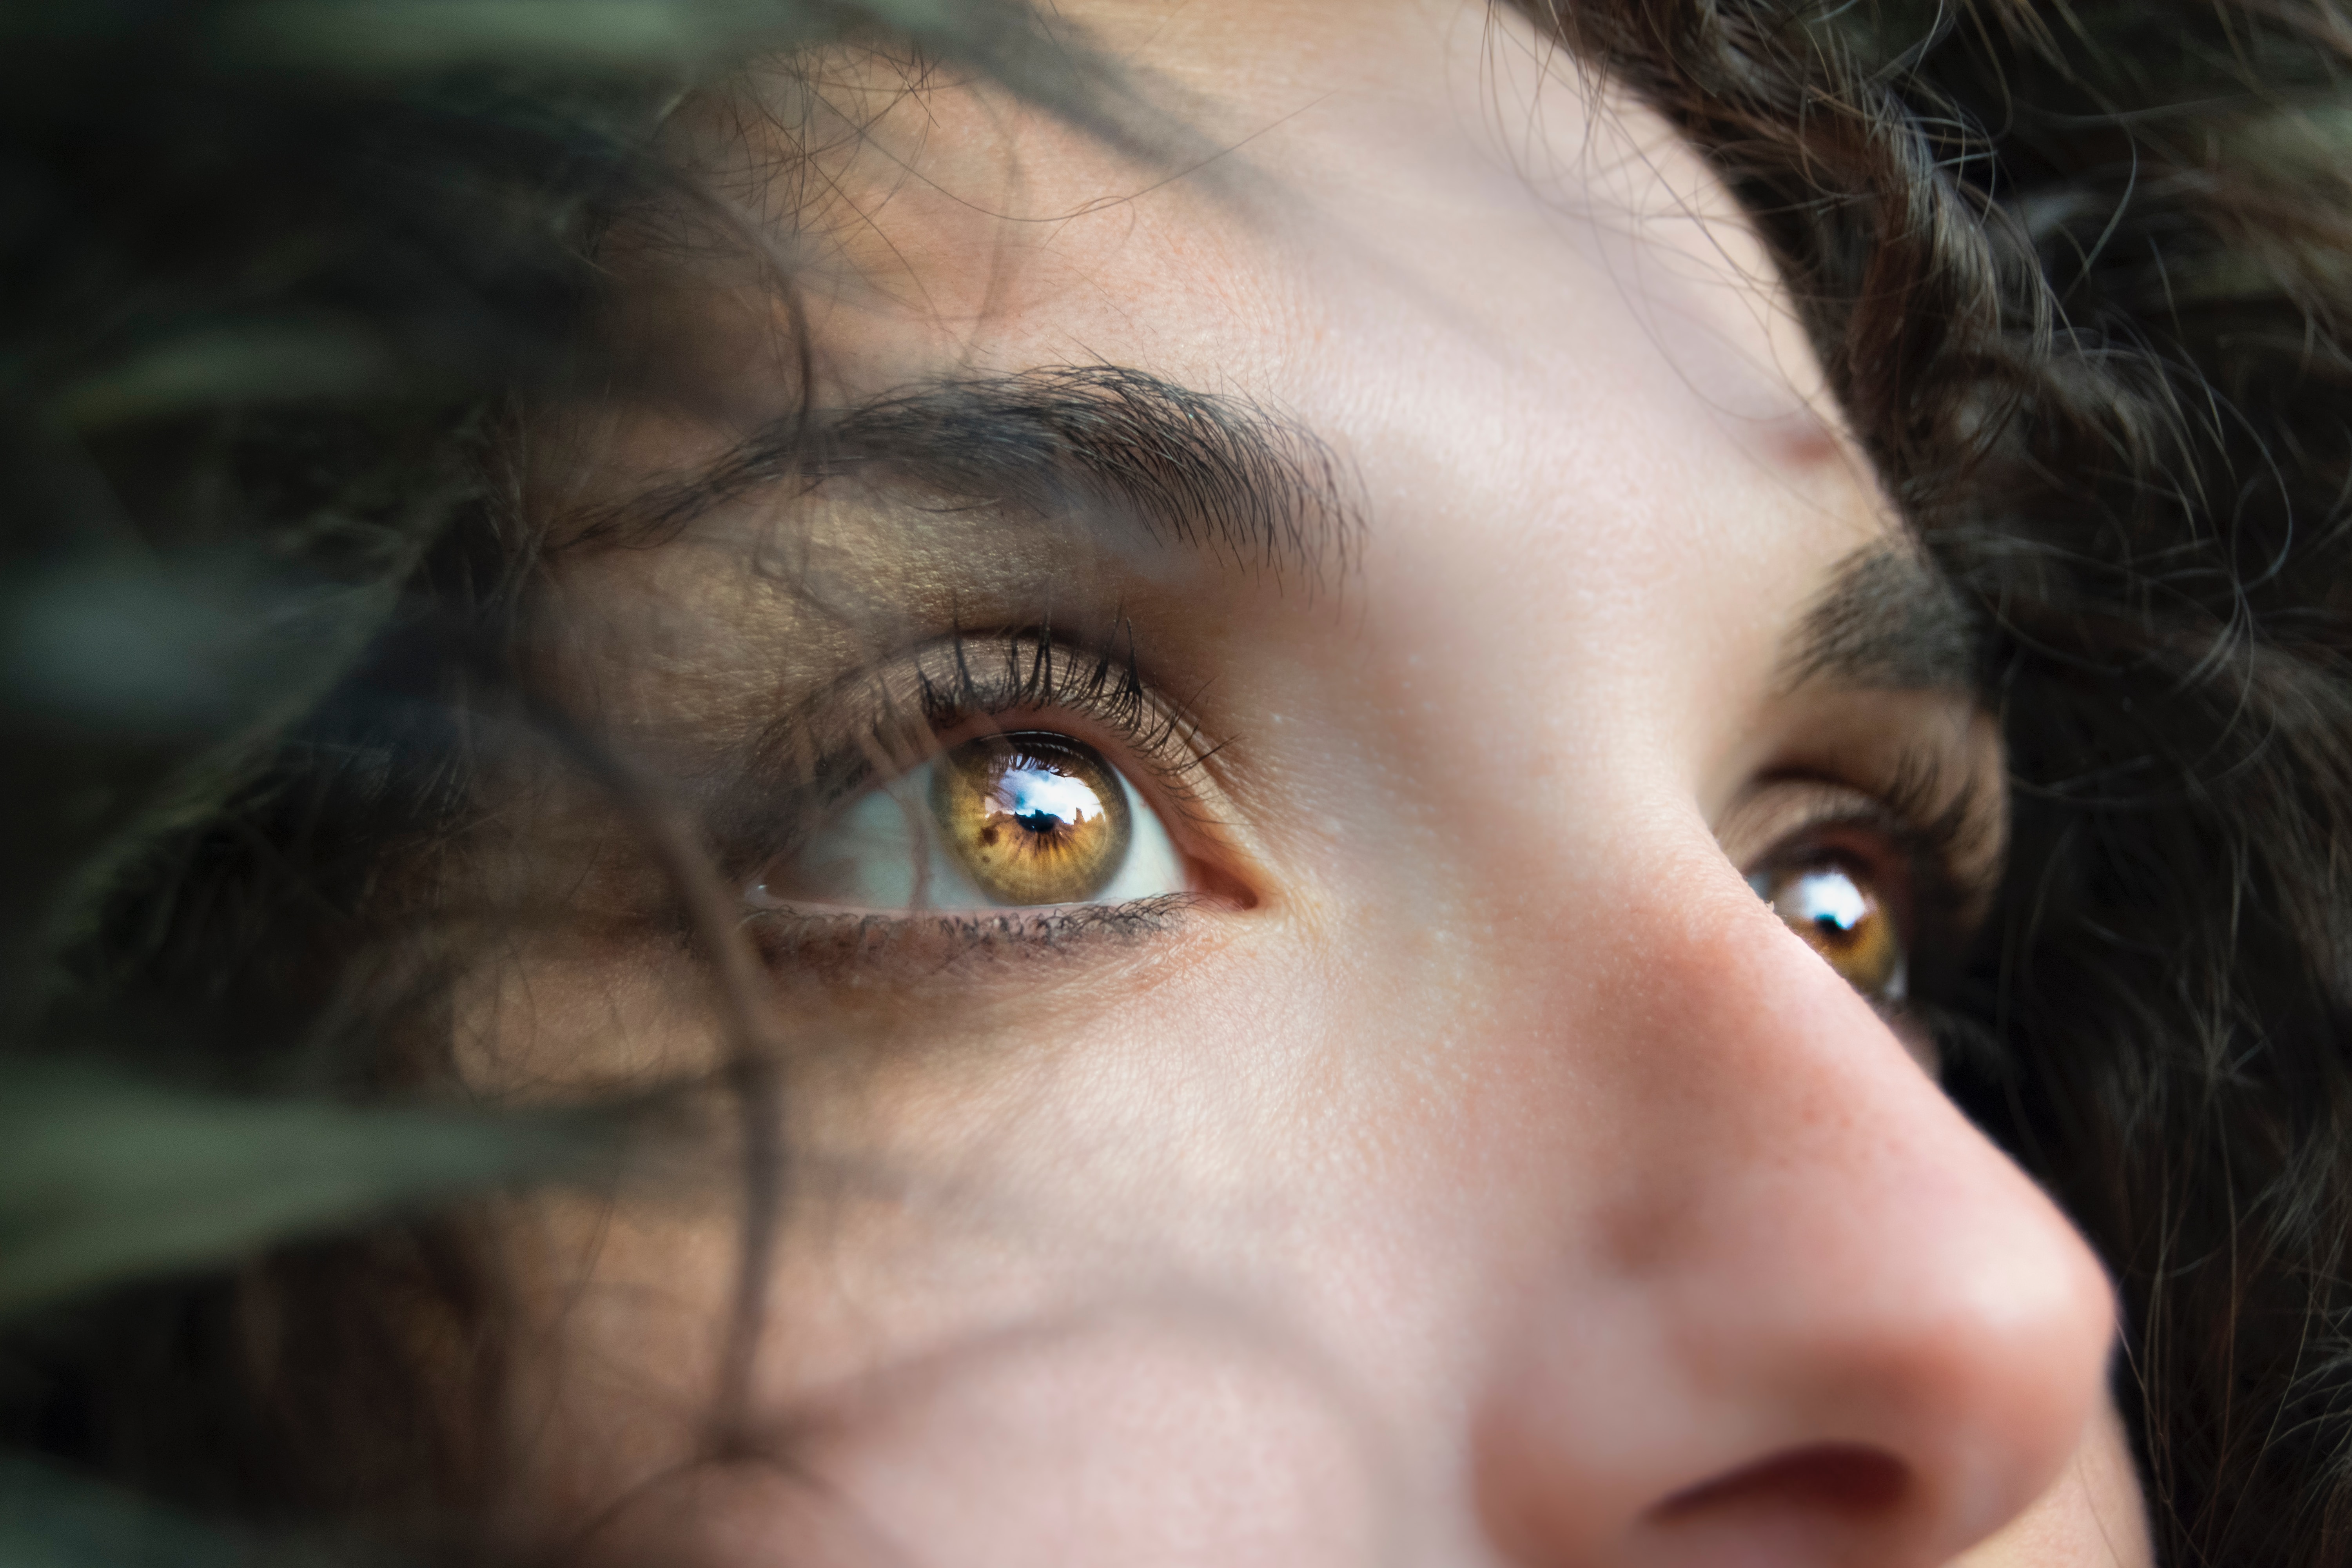
What exactly, is eye tracking? Do I have to put on a helmet or stick something unpleasant into my eye? No, nothing so invasive, and not the least bit uncomfortable. Eye tracking is the process by which eye movements are recorded for the purpose of tracking where a subject is looking, what he/she is looking at, and the duration of the subject’s gaze on a given area. Eye tracking differs from electrooculogram (EOG) in that it records where and at what the subject is actually looking, whereas EOG primarily records the movements of the eye muscles. Rather than merely recording eye movement and position, eye tracking forges an invisible yet accurate connection between the subject and the objects within the subject’s field of vision. These “visual connections” of where the subject was looking during the study are clearly visible in the resulting data, as dramatic as tire tracks on an impressionable surface.

So how does eye tracking work? Using invisible near-infrared light combined with high-definition cameras, the eye tracking system projects invisible light onto the eye and records the direction from which it is reflected off the cornea. Eye tracking software is used to calculate the exact position and focal point of the eye. The sophisticated combination of eye tracking hardware and software allows for extremely accurate measuring and analyzing of visual behavior and fine eye movements. This makes it possible to create a detailed map of a subject’s field of vision and the specific visual elements honed in on by the subject. Eye tracking data is commonly acquired in tandem with other body signals for the purpose of determining the effects of what we are looking at has on our physiology. Common signals acquired during eye tracking studies are:

  • EEG (cognitive processes)
  • EDA (alertness)
  • ECG (anxiety)
  • EMG (muscle activity, conditioning)
  • EGG (pulse, respiration, temperature)

What are researchers looking for when conducting eye tracking studies? Eye tracking data is useful in a variety of different research fields including interface usability, reading analysis, psychological and emotional response, marketing research, training, clinical vision diagnosis, and more.

Eye tracking hardware mainly comes in two flavors. Screen based eye tracking involves having a subject sit in front of a computer monitor while being presented with various types of visual stimuli. A “bar type” eye tracker records the subject’s responses and interfaces with eye tracking software to present the stimulus and store the resulting data for analysis. BIOPAC’s AcqKnowledge software version 5.0.6 and higher, along with the BIOPAC MP160, MP36R, or Wireless Smart Center system, supports fully-integrated eye tracking functionality*. Rather than having to learn a second software program, the familiar AcqKnowledge interface has been extended to incorporate the EYE-TRACK-BAR and EYE-TRACK-BAR-XL remote screen eye tracking systems.

Mobile or “wearable” eye tracking systems utilize a pair of glasses with two types of built-in cameras. One camera faces the subject and tracks eye movements, gaze path, and other parameters, and a second camera (called a scene camera) records what the subject is looking at during the study. Mobile eye tracking allows the subject to engage in independent activities outside the lab, such as driving an automobile. Additional sensors record and log data from other body signals in real time, which can be loaded into the software for subsequent analysis.

For more information about eye tracking, we invite you to sign up for our free “Eye Tracking Fundamentals” webinar to be broadcast live on November 21, 2019 at 8:00 AM PST. Did you miss it or can’t attend? No problem. Follow the same link to watch it on demand.

*Eye Tracking Integration License for AcqKnowledge required.

Please also visit the following links for information about BIOPAC Eye Tracking products.

Eye Tracking Systems

Eye Tracking License


BIOPAC offers a wide array of wired and wireless equipment that can be used in your research. To find more information on solutions for recording and analyzing signals such as ECG, heart rate, respiration and more using any platforms mentioned in this blog post, you can visit the individual application pages on the BIOPAC website.

Photo by Marina Vitale on Unsplash

T4 Conference Wrap-up

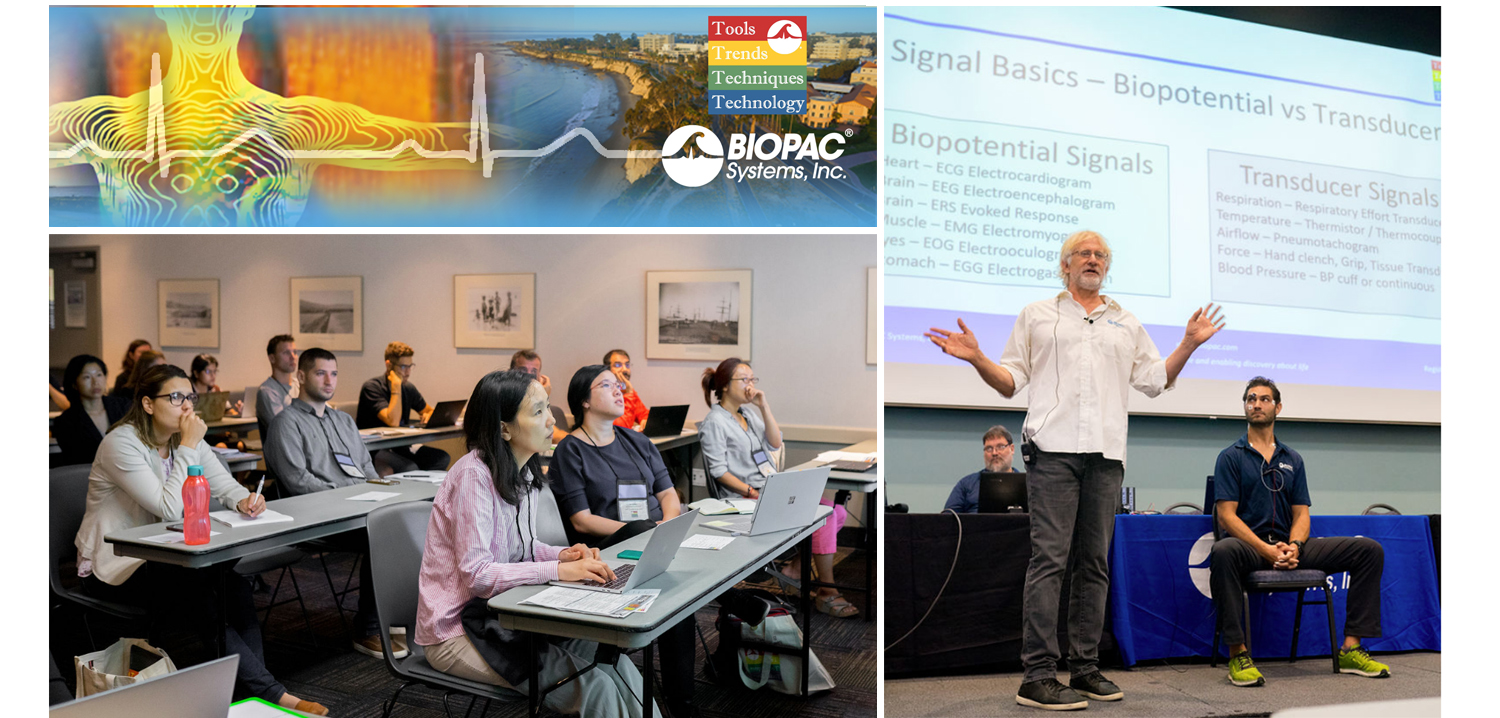
August is a month of barbecues, baseball, and last-minute vacations against the backdrop of a fading summer, and the eighth month of 2019 proved to be an equally exciting time at BIOPAC, with something of a pleasant vacation thrown in. On August 12-14, BIOPAC hosted its 2nd Biennial “Tools, Trends, Techniques, and Technology” Human Physiology Conference, known as “T4” to our friends and partners around the world. This three-day event, first held in 2017, featured lively, informative sessions hosted by BIOPAC staff, partners, noted academics, and industry experts, and covered a wide range of physiological techniques and disciplines. Over 150 attendees joined BIOPAC at the 2019 T4 Conference staged once again at the beautiful University of California at Santa Barbara campus. Participants and instructors winged in from China, Australia, Germany, Sweden, Italy, Spain, U.K., Ireland, and Egypt, as well as from wide regions of the U.S and Canada to soak up the idyllic surroundings of this ocean-side campus.

The focus of BIOPAC’s T4 Conference was to provide a fun, relaxed environment while hosting nearly 40 hands-on, human physiology training workshops chaired by over 20 distinguished instructors from around the globe. One of the many conference highlights was the “Mindfulness, Meditation, and Measurement: Mindfulness Exercises in Physiological Monitoring” session, hosted by Dr. Allan Weiss of the University of Southern California and  BIOPAC Co-founder and Director of R & D Alan Macy. These sessions, conducted in two parts over a two day period were booked beyond capacity, even though the early morning fog hadn’t yet lifted from the campus skyline.

The varied additional sessions covered a range from the basics, “Setting Up Your Lab, Getting Great Data and Troubleshooting,” (hosted by Dr. Terry Blumenthal of Wake Forest University, and BIOPAC’s Alan Macy and Tim Cook), and “Creating Your Own Lessons Using BSL PRO,” (hosted by Dr. Taffeta Elliot of the New Mexico Institute of Mining and Technology), to exciting new technologies such as “Integrating Screen-based Eye Trackers with AcqKnowledge,” with Keith Jackson of BIOPAC partner company EyeTech, BIOPAC CEO Frazer Findlay, and BIOPAC Engineering Manager Ed Peterlin. Additional wide-ranging physiological disciplines were also covered, including MRI techniques, stimulation, and exercise physiology. All sessions were conducted using BIOPAC hardware and software systems, as well as platforms provided by BIOPAC partners such as Cedrus, fNIR, WorldViz, Psychology Software Tools, and CNSystems. At the end of each day, it was time to relax and unwind with a beverage of choice, a a walk along the beach, and some good conversation. Each evening featured excellent meals and camaraderie in the relaxed yet elegant environment of some of Santa Barbara and Goleta’s most stunning surroundings. After three great days of immersive sessions, it came time for everyone to part ways, having forged new collaborative partnerships and an enhanced knowledge about the full potential of BIOPAC and BIOPAC partner products.

You don’t have to wait for T4 2021 to learn more about life science data—watch Fundamentals of Physiological Data Recording now!

For a closer look at T4, and a preview of what is sure to be an exciting 2021 event, we invite you to visit our T4 Human Physiology Conference page.

Looking for additional resources, tips, tricks, and expert advice on BIOPAC and BIOPAC Partner products? Please also visit our Webinars and Video Tutorial pages.


BIOPAC offers a wide array of wired and wireless equipment that can be used in your research. To find more information on solutions for recording and analyzing signals such as ECG, heart rate, respiration and more using any platforms mentioned in this blog post, you can visit the individual application pages on the BIOPAC website.

fNIRS Systems—a NIR miracle

At the dawn of the 19th century, pioneering astronomer Sir William Herschel discovered the existence of infrared radiation, which is electromagnetic radiation invisible to the human eye but identifiable via its ability to heat objects. Infrared radiation is commonly divided into three categories, near, mid, or far infrared waves. In ensuing years, infrared radiation was found to be useful for industrial, scientific, military, and law enforcement applications, such as heat signature tracking and night vision goggles. Over two decades ago, a new technology called near infrared spectroscopy (NIRS) was developed for non-invasively measuring specific aspects of human physiology using near infra-red waves. While far infrared waves lie closest to the microwave region, near infrared waves are closest in length to the visible light part of the electromagnetic spectrum, and are microscopic in size. Unlike far infrared waves, near infrared waves do not produce any heat. In fact, we can’t feel them at all. They are the small waves used by common devices such as a
remote control.

Today, near infrared waves are commonly used  for studying many application areas of human physiology, notably by the fNIRS Imaging Systems to gather precise, high-density brain function and muscle oxygenation data.

How does fNIRS work with regard to human physiology? It’s an optical technology which sends light into the tissue and records the light that scatters back via a photo-diode and sensor attached to the subject. The fNIRS continuous wave technology uses an optical window in the near infrared spectrum that enables light to pass through. For example, when you hold your hand in front of a strong white light, the tissue can appear red and almost translucent. fNIRS shines light into the skull or muscle tissue, and using special detectors, records the resulting light scatter that returns to the surface.  The light penetrates skin, bone, and alights on the brain before its return trip to the surface detectors, and accomplishes this painlessly without heat. In fact, the subject does not even feel the near infrared energy and the light is harmless. The result is startling images and functional data of the brain at work. The fNIRS Systems (ranging from Educational to High-Density versions) include fNIRsoft software for processing, analyzing and visualizing functional near infrared (fNIR) spectroscopy signals through a graphical user interface. Additionally, the fNIRS Systems work with the BIOPAC MP160 Research System and AcqKnowledge software in conjunction with other physiological signals such as ECG, respiration, cardiac output, blood pressure, electrodermal activity, and stimulus response markers. AcqKnowledge software also provides automated analysis tools for event related potentials and ensemble averaging.

fNIRS brain function application areas include workload assignment, VR,  stress, attention, geriatrics, economics, ergonomics, learning and performance, sports science, HCI, pain perception, and cognitive workload – low or high.

fNIRS Systems can also be used to measure muscle oxygenation data, including oxidative capacity, muscle load, lateral imbalances (left vs. right muscle group) oxygenated hemoglobin and de-oxygenated hemoglobin in muscle activity.

We invite you to enjoy a comprehensive free fNIRS webinar and to visit our fNIRS products page.

BIOPAC offers a wide array of wired and wireless equipment that can be used in your research. To find more information on solutions for recording and analyzing signals such as ECG, heart rate, respiration and more using any platforms mentioned in this blog post, you can visit the individual application pages on the BIOPAC website.

Synchronize Participant Video with Physiological Data

AcqKnowledge software includes a Media feature that allows you to record and link participant video with physiological data. A common issue that crops up when analyzing physiological data with linked participant video is a lack of synchronization between the resulting video playback and onscreen data. This most often occurs when a USB webcam-type video camera is used. These types of cameras typically support a 30 frame-per-second rate whereas AcqKnowledge and the MP System can sample at rates up to 200,000 Hz. These factors can introduce an unwanted delay or misalignment between the video playback and data in the resulting AcqKnowledge graph.

So how do we synchronize these disparate signals to dovetail perfectly before recording our data and video? Fortunately, AcqKnowledge provides adjustment tools for addressing this common issue. This simple procedure requires the use of the AcqKnowledge software’s powerful Stimulator feature and a BIOPAC OUT103 LED Video Sync Cable.

Here is the sync method in a nutshell: With the OUT103 LED connected to the Analog Output of the MP160 unit’s HLT100C module, the AcqKnowledge software’s Stimulator is used to output a 5-volt square wave pulse into an AcqKnowledge graph, Using this setup, the LED illuminates when the 5-volt pulse is applied. The trick now is to use the AcqKnowledge Media feature and webcam to record a short video of the LED illuminating while the 5-volt pulse is being applied.

In the resulting graph, it’s easy to see in the Media playback screen when the light comes on by slowly advancing the AcqKnowledge software’s I-beam cursor through the graph data. Does the LED in the recorded video illuminate before the cursor reaches the 5-volt pulse? After? Or at the same time? Chances are, the recorded light will pop on slightly before or after the cursor reaches the pulse.

To compensate for this, the AcqKnowledge Delta-T measurement is used to determine the time interval between the pulse and when the recorded LED illuminates. For example, if the recorded LED lights up an indicated 185 ms before the onset of the pulse, then this discrepancy can be removed by setting a delay of 185 ms in the Media setup tools. If the LED lights up after the pulse onset, a negative delay must be set (ex. -185 ms). Once the playback delay is eradicated, the experiment can continue with confidence that all video and physiological data will be properly aligned.

It’s features such as this that enhance the usability AcqKnowledge Media feature, making it a powerful tool for recording and synchronizing participant video and audio during experiments. After a bit of practice, dialing in the playback video for linked Media acquisitions becomes second nature.

To see AcqKnowledge Media Synchronization in action, we invite you to view a free on-demand webinar covering this procedure in detail.

BIOPAC offers a wide array of wired and wireless equipment that can be used in your research. To find more information on solutions for recording and analyzing signals such as ECG, heart rate, respiration and more using any platforms mentioned in this blog post, you can visit the individual application pages on the BIOPAC website.

error: Content is protected !!