Free Your EEG: Wireless and Wearable Systems for the Lab and Beyond

The evolution of wearable technology for recording physiological signals represents a transformative leap for research, particularly when it comes to electroencephalography (EEG). These advancements allow researchers to capture brain activity data in real-world settings, moving beyond the confines of laboratory-based experiments. Mobile and wearable EEG devices utilize wireless technology to transmit data, offering significant advantages over traditional methods.

Everyone aspires to more freedom—to speak, think, or move about as one pleases. Should researchers be any different? Why be shackled to the static wires and cables of the lab, when one can release study participants with the help of mobile and wearable technology?

The evolution of wearable technology for recording physiological signals represents a transformative leap for research, particularly when it comes to electroencephalography (EEG). These advancements allow researchers to capture brain activity data in real-world settings, moving beyond the confines of laboratory-based experiments. Mobile and wearable EEG devices utilize wireless technology to transmit data, offering significant advantages over traditional methods.

EEG is a cornerstone in the study of brain activity, providing insights into the electrical patterns generated by neuronal firing. EEG has traditionally been used in physiology and psychophysiology research to understand brain function, monitor cognitive states, and investigate neural responses to various stimuli. The conventional EEG setup typically involves a stationary system with numerous electrodes affixed to the scalp using a conductive gel, which can limit the subject’s movement and impact the naturalistic settings of studies.

One of the primary benefits of mobile and wearable EEG systems is their ability to record brain activity during dynamic, everyday activities. This capability provides a more comprehensive understanding of how the brain responds to real-world stimuli and stressors, as opposed to controlled, static environments. For instance, researchers can now study cognitive processes in natural settings like workplaces or homes, enhancing the ecological validity of their findings.

A study by the School of Architecture at the University of Liverpool provides an example in which researchers leveraged wearable EEG technology when comparing subjective and physiological responses to noise within wooden buildings. The research team conducted listening tests using EEG data recorded via the B-Alert X-24 wireless headset system, which allowed participants to “sit comfortably in a simulated living room” while listening to a variety of sounds that were both airborne and resonating through the floors. Participants rated their level of noise annoyance on an 11-point scale and results were compared to EEG data. In discussing the design of their study, the authors highlighted the importance of incorporating noninvasive, wearable technology, stating, “Among the several options available for measuring physiological reactions to auditory stimuli, contemporary technologies made possible the recording of EEG in a relatively easy way by means of portable devices. These offer the precious opportunity of acquiring data directly from the scalp, where brain activity is detectable almost instantaneously in synchrony with the stimulus presentation.”

Similarly, when studying occurrences of hyperventilation among a participant group with a range of anxiety-related disorders, researchers from Yale University turned to a BIOPAC BioNomadix wireless receiver to gather EEG signal data. By attaching individual electrodes to a third-party cap that connected wirelessly to a BIOPAC data acquisition and analysis system, they minimized the discomfort and restriction of movement that may have resulted from a wired solution, thereby influencing participants’ response to stimuli.

Researchers at the Transylvania University of Brașov in Romania faced similar demands that required a flexible noninvasive means to record surface EEG signals from participants as they responded to a variety of colors and patterns with the goal of better understanding the complexity of human color and texture perception. The research team compared participants’ subjective responses to EEG responses via Event-Related Potentials and computational measurements of color and texture.  EEG data was gathered with a cap-based BioNomadix wireless system and analyzed using AcqKnowledge software. The study’s authors explained their choice of wireless EEG recording devices as follows: “Since human users are the target, it is important to focus the technology development towards small-scale, wearable, wireless systems that provide flexibility, easy use and comfort to the user side, while at the same time maintaining high signal quality.”

APEX cycleAdditional wearable EEG options available through BIOPAC include the MedelOpt Mobility EEG system, combining wearable EEG and functional near-infrared spectroscopy (fNIRS) technology with advanced signal processing and robust data transmission capabilities. APEX wireless EEG systems further enhance the landscape with their ability to record high-quality EEG data with flexibility for a range of applications from cognitive neuroscience to mental workload studies. Learn more about recording EEG data by watching our webinar: A Beginner’s Guide to EEG.


Are you interested in unlocking the benefits of mobile and wireless EEG for your next research project? Let our staff of experts find the right tools for you.

Snooze Studies: Tools for Sleep Research

Comedic actress Mindy Kaling may have been speaking for everyone enamored with slumber when she wrote, “There is no sunrise so beautiful that it is worth waking me up to see it.”

Who hasn’t at one time preferred the restorative effects of a few extra hours of sleep to the harsh realities of the waking world? For both humans and other animals, sleep is indelibly linked to physical, mental, and emotional well-being.

In experimental biology, understanding sleep patterns and disruptions in both humans and animals provides essential insights into health, behavior, and neurological conditions. Techniques such as pulse oximetry, electroencephalography (EEG), and electromyography (EMG) provide critical data for unlocking the mysteries of sleep’s influence on human and animal biology.

Pulse oximetry is a noninvasive method that measures the oxygen saturation level of the blood, an indicator of respiratory efficiency during sleep. It is typically expressed as peripheral blood oxygen saturation or SpO2. This tool is especially useful in detecting sleep apnea and other breathing-related sleep disorders. EEG records electrical activity in the brain, offering a window into the different stages of sleep (from light sleep to deep sleep and rapid eye movement [REM] phases). It helps researchers understand how and why sleep patterns may be altered by various neurological diseases or conditions. EMG measures muscle activity and is crucial in examining the quality of sleep, particularly by identifying periods of muscle atonia during REM sleep, which can be disrupted in disorders like REM sleep behavior disorder.

BIOPAC and partner company Kissei offer SleepSign™ software, which provides essential tools and technologies that enhance the effectiveness of sleep studies. BIOPAC’s advanced multimodal setups can integrate data from EEG, EMG, pulse oximetry, and other sources for human participants and animals into a single coherent analysis platform. This integration allows for simultaneous recording and analysis of physiological and neurological signals during sleep.

boyA study published in the Sleep Research Society’s journal, Sleep, evaluated the effect of sleep on upper airway dynamics in obese children with obstructive sleep apnea syndrome (OSAS). Researchers used data gathered via a BIOPAC differential pressure transducer and flow transducer and fed into a data acquisition and analysis system to measure SpO2 and nasal-oral mask airflow of participants during MRI scans. The study results provided “further insight into the biomechanical basis of OSAS and assist in more effective management.”

SleepSign™ software plays a crucial role in automating the analysis of sleep data. It processes large volumes of EEG and EMG data, providing researchers with user-friendly interfaces and detailed reports that highlight anomalies and patterns in sleep stages. A study published in the 2023 issue of Neurobiology of Sleep and Circadian Rhythms investigated the long-lasting effects of sleep disruption on young prairie voles using a combination of BIOPAC’s AcqKnowledge software and SleepSign™ to acquire and analyze EEG and EMG data. The study concluded that early-life sleep disruption in postnatal voles has significant impacts on REM sleep patterns later in life.

These are just some of the technologies allowing researchers to dissect the nuances of sleep in both human health and animal models while also paving the way for novel therapeutic strategies to address sleep-related disorders. For additional information check our webinars on wireless animal EEG recordings and wireless logging.


Are you planning to explore the realm of sleep with your next study? Reach out to our experts for assistance selecting the best tools for gathering and analyzing sleep data.

Mind and Machine: Exploring Brain-Computer Interfaces

In neuroscience, the frontier of brain-computer interfaces (BCI) holds the promise of bridging the gap between the human brain and external devices, offering revolutionary applications in fields ranging from robotics and prosthetics to communication and beyond. In the lab, scientists studying and developing new BCI technology leverage the human brain’s electrical and physiological signals.

Electroencephalography (EEG), functional near-infrared spectroscopy (fNIRS), and steady-state visually evoked potentials (SSVEP) are among the primary physiological and psychophysiological signals utilized in these investigations. Multimodal integration of two or more signal types allows researchers and engineers to take advantage of multiple data streams in their applications and studies.

EEG, which can measure electrical activity in the brain, is a cornerstone of BCI research. Researchers can decode various mental states and intentions by analyzing EEG patterns, enabling users to control external devices through mere thought. fNIRS complements EEG by measuring changes in blood oxygenation levels, offering insights into brain function with superior spatial resolution. SSVEP, on the other hand, capitalizes on the brain’s response to visual stimuli, providing a means for precise control in BCI applications.

The practical implications of BCI research extend far beyond the laboratory setting. In robotics, BCIs facilitate direct brain-to-machine communication, empowering users to manipulate robotic arms or navigate autonomous vehicles with their thoughts alone. A study published in the Journal of Information Science Engineering explored ways that an SSVEP-based BCI could be used to control assembly line robots via a headset measuring the operator’s EEG signals. The signals would communicate instructions to robots while operators identified defective parts, which the robots would pick out. During the experiment, EEG signals were obtained using a B-Alert X24 headset. The EEG-based BCI produced a 93.33% success rate in correctly identifying and removing defective parts from the assembly line process, allowing the operator to effectively “collaborate with the robot and communicate defective parts without manually operating the robot.”

Prosthetics benefit immensely from BCI advancements, enabling seamless integration with the user’s neural signals for intuitive control and enhanced functionality. A 2023 study by a team of researchers from the University of California Irvine explored the viability of creating low-cost cortical stimulators for bi-directional BCI (BD-BCI) research. BD-BCI takes brain-computer-interfaces to the next level with the brain not only providing motor commands to an artificial limb but also allowing it to receive sensory input from such a device. A BIOPAC data acquisition and analysis system was used to validate the charge balancing of subcortical electrocorticographic (ECoG) implants used in a stimulator. The charge balancing test was performed on phantom tissue designed to simulate real brain tissue. The resulting study successfully demonstrated “clinical validation of a fully-programmable electrical stimulator, integrated into an embedded BCI system.”

As researchers continue to refine BCI technologies, the possibilities for real-world applications are boundless. BIOPAC is among the companies on the cutting edge of BCI research, partnering with other innovators to provide the latest in multimodal BCI technologies such as Axon-R. For additional information on Axon-R, check out our recent webinar on the device.


Are you planning to explore the frontiers of BCI in the lab? Our regional customer reps have all the knowledge you need to integrate BIOPAC products into your BCI study.

ENS: Signals for Studying the Body’s “Second Brain”

We have all heard the saying “thinking with one’s stomach,” a cliché that suggests basing one’s critical thought processes on the whims of their digestive system. However, there may be more than a little truth to this saying. Often referred to as the body’s “second brain,” the enteric nervous system (ENS) comprises a complex network of neurons and ganglia embedded within the walls of the gastrointestinal tract. In recent years, researchers have increasingly recognized the significance of the ENS and its application in physiological research.

The ENS is a division of the autonomic nervous system (ANS) responsible for regulating the digestive process. It consists of millions of neurons spread throughout the esophagus, stomach, small intestine, and large intestine. These neurons form an intricate network that can function independently of the central nervous system (CNS) but also communicates with it. The ENS controls essential gastrointestinal functions, such as peristalsis, secretion of digestive enzymes, and blood flow regulation within the gut.

Several effective techniques are available to researchers to evaluate and measure ENS activity for their studies. Electrogastrography (EGG) provides a noninvasive approach to measuring the electrical activity of the stomach muscles. EEG can help researchers understand the rhythm and coordination of stomach contractions, aiding in the diagnosis of motility disorders.

In addition to EGG, a range of other physiological signals may be applied to ENS research. A recent study published in the June 2023 edition of Nature Communication investigated the gut-brain relationship by measuring physiological response to stimulation of the digestive system via different noninvasive techniques: EGG, electroencephalogram (EEG), skin conductance response (SCR), heart rate (HR), and heart rate variability (HRV). Research participants ingested a small vibrating probe that provided varying levels of stimulation as it passed through the lower digestive tract. EGG, EEG, and SCR signals were recorded along with hemodynamic signals via a BIOPAC data acquisition and analysis system. Researchers concluded that these techniques provided a viable alternative to more invasive approaches to measuring the body’s response to sensory stimulation of the digestive tract with, according to the published report, “implications for understanding gut feelings and gut-brain interactions in healthy and clinical populations.”

ENS ResearchMore invasive techniques for studying the ENS can still provide researchers with valuable data. A 2023 study by a team of South Korean researchers investigated how radial stretching affects intestinal contractions. The study also examined how drugs targeting the ENS affect such contractions to develop treatments for gastrointestinal disorders. Samples of intestinal tissue were taken from participants undergoing aggressive treatment for colorectal cancer. Samples were preserved in a tissue chamber and connected to a BIOPAC isometric force transducer to measure contractions, with data recorded and analyzed with a BIOPAC MP160 system running AcqKnowledge software. The study was able to detect regional differences in the stretch reflex of colon tissue via electrophysiological recordings of intestinal smooth muscles.

These are some of the ways in which researchers are currently using BIOPAC technologies to better understand the relationship between the ENS and other neurophysiological processes. For additional information on this topic, see our page on AcqKnowledge’s Gastric Myoelectric Activity feature and our EGG citations.


If you would like to know more about how BIOPAC can help you plan and equip your ENS study, reach out to your regional sales representative today.

Evoked Potentials: Low-amplitude Signals for High-value Data

Researchers studying the nervous system have a host of physiological signals at their disposal to provide critical data on neurological function. Various signals present advantages and disadvantages, depending on the demands of the research being conducted. Evoked potentials offer a particularly effective means of measuring the nervous system’s response to certain stimuli, notably visual and auditory cues.

Evoked potentials are employed in both research and clinical settings to measure electrical activity in the central nervous system. Stimulation of specific sensory neural pathways produces this electrical activity, allowing researchers to see the speed and thoroughness with which these signals reach the brain. Evoked potentials provide researchers with heightened precision when isolating and localizing a participant’s response to stimuli.

Because evoked potential amplitudes tend to be low, from less than one to just a few microvolts, these signals can be difficult to differentiate from other higher amplitude signals and background noise. This is resolved by using signal averaging to separate the low-amplitude signals from the noise. Multiple readings are taken with evoked potential signals time-locked to the stimulus. Averaging these measurements allows the evoked potential to be filtered from the random signal noise.

Along with providing useful data for research, evoked potential tests are commonly used in clinical settings to diagnose and explore treatments for a range of disorders such as multiple sclerosis (MS), epilepsy, glaucoma, neuropathies, Alzheimer’s, and others. In both research and clinical applications, evoked potential tests provide several advantages over using other approaches since they are noninvasive, painless, and provide results more quickly than other neurological scans, such as MRI. Types of evoked potentials can be categorized by the stimuli with which they are associated. Visual evoked potentials (VEP) are triggered by visual stimuli such as light flashes or by participants viewing certain patterns. Auditory evoked potentials (AEP) measure responses to sound stimuli such as clicks. Somatosensory evoked potentials (SEP) are triggered by electrical stimulation of peripheral nerves.

A 2022 study by researchers at the Autonomous University of Aguascalientes in Mexico evaluated the effectiveness of using VEP waveforms embedded in electroencephalographic (EEG) signals to determine the health of the optic nerve. The team employed an MP36 data acquisition system connected to an SS2LB lead set to record EEG signals from study participants. eyeThe signal data were used to create a database of VEPs that could be processed with analysis software for the early detection of glaucoma and other optic nerve-related illnesses.

A similar study combined the use of EEG signals with VEP to examine how participants recognize emotion in others. Researchers from two universities in China relied on a variation of VEP known as steady-state visual evoked potential (SSVEP), which exhibits distinctive frequency and phase properties. EEG signals were recorded via a BIOPAC data acquisition unit while participants were shown flickering images representing three emotional states—delight, sadness, and anger. The study found a positive correlation between SSVEP amplitude, alpha-frequency entrainment, and accurate identification of emotion.

These are just a few examples of how evoked potentials provide researchers with valuable insight into the central nervous system’s response to stimuli and its relationship to a wide range of physiological states. For additional information on how to use BIOPAC hardware and AcqKnowledge to stimulate a range of senses using electrical, auditory, visual, haptic, scent, and thermal stimuli and record evoked potentials, check out our webinar on Exogenous and Stimulus-related Evoked Potentials.


To learn more about how your study can benefit from using BIOPAC hardware and software to record and analyze evoked potential data, contact your local sales representative.

EEG on the Go

Not to spike our own signal about it, but we really love recording EEG. In fact, over 6,500 research & scientific citations have been published recording EEG with BIOPAC equipment. So, let’s think about EEG. Why do we love this signal and when should you be recording it? One strong reason: EEG is perfect for on the go research such as in the field studies or wireless recording of mobile subjects. Let’s dive into advanced applications of electroencephalography that researchers are using right now.

EEG is a powerful tool in the medical and research communities for measuring brain function and regional brain activity. The correlation of specific brain waves with sleep phases, emotional states, psychological profiles, and types of mental activities is the subject of thousands of scientific articles and citations. Several scientific journals are dedicated expressly to the study of EEG-related research, and what secrets this physiological signal holds. Since the discovery of EEG as a physiological signal in the 1920s, the scalp has been the traditional recording place of this signal. Flash forward several decades, and noninvasive surface EEG recording can be performed wirelessly on human participants, increasing subject mobility and freedom of motion.

Cognitive State Analysis

Multi-rhythm analysis is a very popular means to monitor subject fatigue, stress, confusion, engagement, and workload. These measurements are often taken as background cognitive state monitoring during experiments testing subject actions or responses.

Stimulus Presentation

Introducing an outside stimulus to measure deviance from baseline can produce significant findings when recording EEG, making stimulus delivery events a popular application for EEG recording.

Spectral Analysis

The power spectrum of the EEG indicates the power of each frequency component present in the source time domain waveform. For individual time epochs derived from EEG Signals, BIOPAC’s AcqKnowledge software estimates the power spectrum of that epoch to extract mean power, median frequency, spectral edge, and peak frequency.

ERP Analysis

Event-Related Potential Analysis consists of a workflow to present visual and auditory stimuli through one computer, while your data collection software records stimuli event markers (EEG) and psychological responses on another. This workflow is popular in EEG research as it aids in identifying similarities in different stimuli responses.

Evoked Responses

Evoked Responses include haptic, auditory, visual, and somatosensory evoked responses. Evoked Response studies typically measure response to stimuli and test multiple physiological responses, including but typically not limited to an EEG-based response.

EEG Filtering

EEG Filtering allows recording of single- or multi-channel montages with on-line calculation channels for Delta, Theta, Alpha, and Beta wave activity. Users can employ various transformations to filter the data off-line for further analysis.

The best way to run these specific advanced EEG analyses is with AcqKnowledge software, which can fully automate several of these functions. For more information on BIOPAC’s wide range of tools for recording, displaying, and analyzing EEG signals from human and animal subjects, including automated EEG analysis, seizure detection, evoked responses and many others, visit BIOPAC’s EEG Analysis page or view BIOPAC’s full line of electrodes, amplifiers, and wearable, wireless transmitters and loggers.

BIOPAC Systems, Inc. provides life science researchers and educators with data acquisition and analysis systems that inspire people and enable greater discovery about life. Visit us at www.biopac.com.


T4 Conference Wrap-up

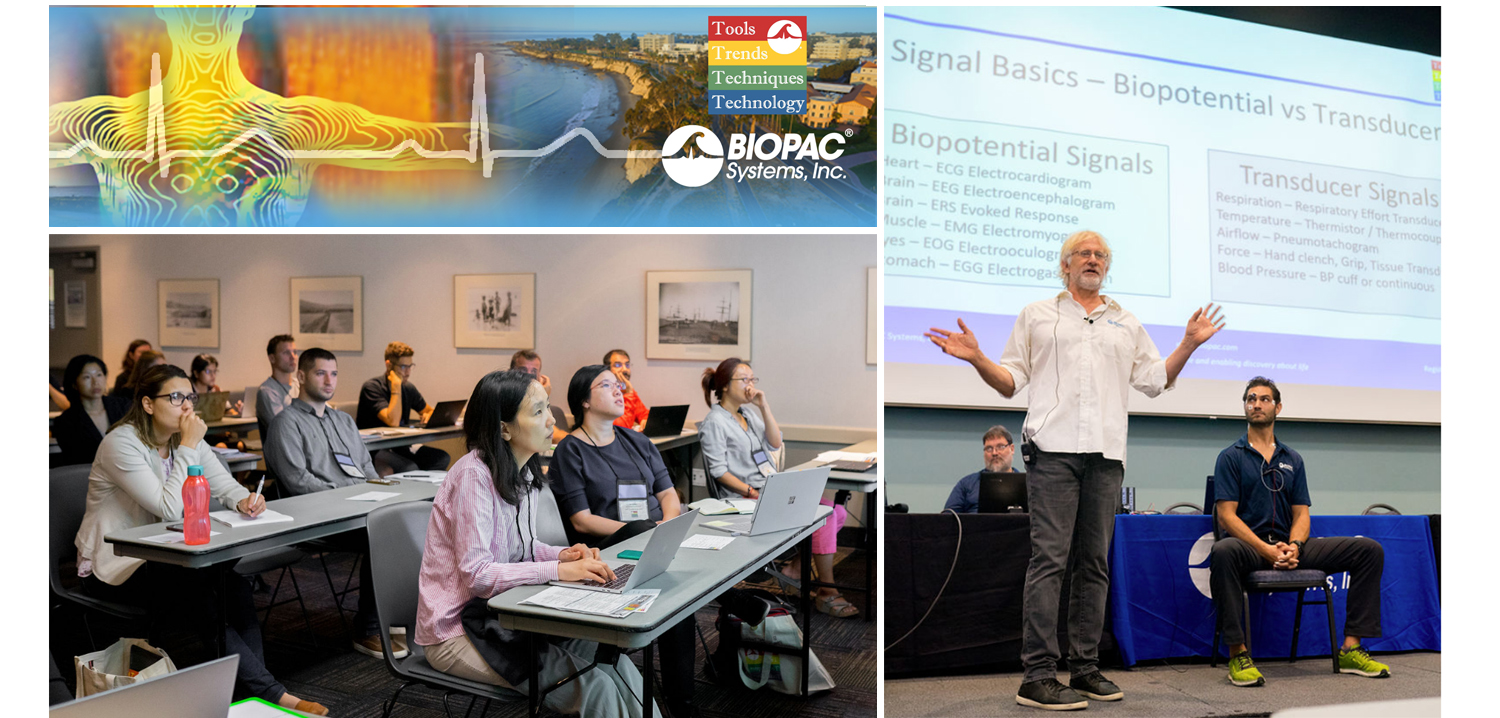
August is a month of barbecues, baseball, and last-minute vacations against the backdrop of a fading summer, and the eighth month of 2019 proved to be an equally exciting time at BIOPAC, with something of a pleasant vacation thrown in. On August 12-14, BIOPAC hosted its 2nd Biennial “Tools, Trends, Techniques, and Technology” Human Physiology Conference, known as “T4” to our friends and partners around the world. This three-day event, first held in 2017, featured lively, informative sessions hosted by BIOPAC staff, partners, noted academics, and industry experts, and covered a wide range of physiological techniques and disciplines. Over 150 attendees joined BIOPAC at the 2019 T4 Conference staged once again at the beautiful University of California at Santa Barbara campus. Participants and instructors winged in from China, Australia, Germany, Sweden, Italy, Spain, U.K., Ireland, and Egypt, as well as from wide regions of the U.S and Canada to soak up the idyllic surroundings of this ocean-side campus.

The focus of BIOPAC’s T4 Conference was to provide a fun, relaxed environment while hosting nearly 40 hands-on, human physiology training workshops chaired by over 20 distinguished instructors from around the globe. One of the many conference highlights was the “Mindfulness, Meditation, and Measurement: Mindfulness Exercises in Physiological Monitoring” session, hosted by Dr. Allan Weiss of the University of Southern California and  BIOPAC Co-founder and Director of R & D Alan Macy. These sessions, conducted in two parts over a two day period were booked beyond capacity, even though the early morning fog hadn’t yet lifted from the campus skyline.

The varied additional sessions covered a range from the basics, “Setting Up Your Lab, Getting Great Data and Troubleshooting,” (hosted by Dr. Terry Blumenthal of Wake Forest University, and BIOPAC’s Alan Macy and Tim Cook), and “Creating Your Own Lessons Using BSL PRO,” (hosted by Dr. Taffeta Elliot of the New Mexico Institute of Mining and Technology), to exciting new technologies such as “Integrating Screen-based Eye Trackers with AcqKnowledge,” with Keith Jackson of BIOPAC partner company EyeTech, BIOPAC CEO Frazer Findlay, and BIOPAC Engineering Manager Ed Peterlin. Additional wide-ranging physiological disciplines were also covered, including MRI techniques, stimulation, and exercise physiology. All sessions were conducted using BIOPAC hardware and software systems, as well as platforms provided by BIOPAC partners such as Cedrus, fNIR, WorldViz, Psychology Software Tools, and CNSystems. At the end of each day, it was time to relax and unwind with a beverage of choice, a a walk along the beach, and some good conversation. Each evening featured excellent meals and camaraderie in the relaxed yet elegant environment of some of Santa Barbara and Goleta’s most stunning surroundings. After three great days of immersive sessions, it came time for everyone to part ways, having forged new collaborative partnerships and an enhanced knowledge about the full potential of BIOPAC and BIOPAC partner products.

You don’t have to wait for T4 2021 to learn more about life science data—watch Fundamentals of Physiological Data Recording now!

For a closer look at T4, and a preview of what is sure to be an exciting 2021 event, we invite you to visit our T4 Human Physiology Conference page.

Looking for additional resources, tips, tricks, and expert advice on BIOPAC and BIOPAC Partner products? Please also visit our Webinars and Video Tutorial pages.


BIOPAC offers a wide array of wired and wireless equipment that can be used in your research. To find more information on solutions for recording and analyzing signals such as ECG, heart rate, respiration and more using any platforms mentioned in this blog post, you can visit the individual application pages on the BIOPAC website.

Getting the Bands Back Together – Components of the EEG Signal

Many notable events occurred in 1929, not all of them good. The St. Valentine’s Day massacre. The stock market crash that triggered a worldwide economic crisis. The chain saw was invented. Not much good was happening in Germany either. Rampant inflation, the decline of the Weimar Republic, and the implacable rise of Nazism. But 1929 was also the year that German physician Hans Berger made an important scientific discovery that continues to influence how we study the human brain today. Dr. Berger discovered that electrodes placed on the human scalp could detect various patterns of electrical activity. After further study confirmed that these patterns were indeed related to brain activity and not mere scalp muscle artifact, scientists began to delve into the constructs of these “brain waves.” Today, electroencephalography (EEG) is still the primary method employed for recording brain function. In medical and basic research, correlation of particular brain waves reveals valuable information about sleep phases, emotional states, psychological profiles, and other mental activities. Much of this information is derived from five simple periodic rhythms, or frequencies, recorded in the EEG signal—alpha, beta, delta, theta, and gamma waves. These frequencies are known to be associated with specific degrees of alertness, affect, emotional states, and sleep. What do these frequency bands tell us about what is going on behind the gray matter? Allow us to introduce the band members.

Alpha (8-13 Hz) – Mellow Band Member

Alpha waves are associated with relaxation and calm. In general, the alpha rhythm is the prominent EEG wave pattern of adult subjects who are awake, but relaxed with eyes closed. Each region of the brain has a characteristic alpha rhythm but alpha waves of the greatest amplitude are recorded from the occipital and parietal regions of the cerebral cortex. In general, alpha wave amplitudes diminish when subjects open their eyes and are attentive to external stimuli, although some subjects trained in relaxation techniques can maintain high alpha amplitudes even with eyes open.

Beta (13-30 Hz) – Band Manager

Beta waves are related to memory, focus, and problem-solving. beta rhythms occur in alert individuals who are attentive to external stimuli, or exerting specific mental effort. Paradoxically, beta rhythms also occur during deep REM sleep. Beta waves may also be associated with “remembering” or retrieving memories.

Delta (1-5 Hz) – Supportive Band Member and Theta Rhythm (4-8 Hz) – Creative Band Member

Delta and theta rhythms are low-frequency EEG patterns that increase during sleep in the normal adult. Delta waves are associated with rejuvenation of the body through restorative deep sleep. Theta waves are more aligned with creativity and emotional connection. As people move from lighter to deeper stages of sleep (prior to REM sleep,) the occurrence of alpha waves diminishes and is gradually replaced by the lower frequency theta and then delta rhythms.

Although theta and delta rhythms are generally most prominent during sleep, there are cases when delta and theta rhythms are recorded from individuals who are awake. For example, theta waves will occur for brief intervals during emotional responses to frustrating events or situations. Delta waves may increase during difficult mental activities requiring concentration. In general, the occurrence and amplitudes of delta and theta rhythms are highly variable within and between individuals.

Gamma (> 32 Hz) – Perceptive Band Member

Gamma waves bring to the party cognition, information processing, learning, memory, and perception. Gamma waves were largely overlooked before the development of digital electroencephalography, as analog electroencephalography is restricted to recording and measuring rhythms that are usually less than 25 Hz.

A gamma wave is considered to be the “fastest” brain activity. The prominence of this wave leads to anxiety, high arousal, and stress. In optimal conditions gamma waves help with attention, focus, binding of senses (smell, sight, and hearing), consciousness, mental processing, and perception.

Research studies reported that gamma activity is involved in attention, working memory, and long-term memory processes, although excessive Gamma activity is also involved in psychiatric disorders such as schizophrenia, hallucination, Alzheimer’s disease, and epilepsy.

So in a sense, the periodic rhythms alpha, beta, delta, theta, and gamma, like the members of a tight musical ensemble, have distinct but overlapping roles for enabling the human brain to achieve wondrous things great and small that are often taken for granted.

BIOPAC Systems, Inc offers the following solutions for recording and analyzing EEG signals for research and education applications.

MP160 System with AcqKnowledge Software
EEG100D Smart Amplifier
EEG100C Amplifier Module
EEG100C-MRI Amplifier Module
BioNomadix Wireless EEG
BioNomadix Smart Center
Mobita 32-Channel Wireless EEG System
B-Alert Wireless EEG with Cognitive States Software
EPOCH Wireless In Vivo Neural Recording Systems—longterm EEG for rats, mice, or pups
Biopac Student Lab Systems—with EEG I, EEG II, and Hemispheric EEG lessons

We also invite you to enjoy our library of free EEG webinars on our Webinars page.

Fundamentals of EEG Recording

In 1929, a German physician named Hans Berger discovered that electrodes placed on the scalp could detect various patterns of electrical activity. After verifying that the recordings were indeed recording from the brain, and were not artifacts of muscle or scalp, scientists began to study these “brain waves.” Today, EEG is still a medically useful recording for brain function. In medical and basic research, the correlation of particular brain waves with sleep phases, emotional states, psychological profiles, and types of mental activities is ongoing.

EEG records the electrical activity of the brain. Surface EEG electrodes provide a noninvasive way to measure brain function and regional brain activity. The EEG signal is made up of different frequency components and the amplitude of the signal varies in the different frequency bands: alpha, beta, delta, theta, gamma.

Rhythm Typical Frequencies (Hz)
alpha
beta
delta
theta
gamma
8-13
13-30
1-5
4-8
>32

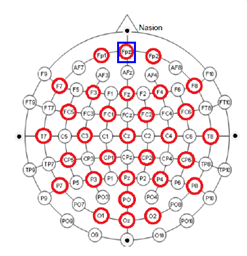
EEG can be recorded by placing electrodes on the scalp of the subject. The placement of the electrodes is important to ensure that you are recording data from the correct location when comparing and reporting results.The electrodes are placed on specific locations on the head. Each electrode location is given an alphanumeric name. Alpha is related to actual zone for electrode placement: F-Frontal, C-Central, T-Temporal, P-Parietal, O-Occipital zones. Numeric is based on the two hemispheres, odd numbers representing left side and even numbers representing right side.

EEG Electrode PlacementThese locations are over certain areas of the brain that allow us to identify different types of activity:

  • F7 near centers for rational activities
  • Fz near intentional and motivational centers
  • F8 close to sources of emotional impulses
  • C3,C4,Cz deal with sensory and motor functions
  • T3 and T4 emotional process
  • T5 and T6 certain memory functions
  • O1 and O2 for primary visual areas

An EEG cap can also be used to ensure proper electrode placement. The size of the EEG cap is critical in EEG recording. Having the correct cap size means that you can ensure that you are recording the correct brain location, otherwise you may think you’re recording F5 when you’re really recording F9.

Recording EEG is a bipolar recording (looking at difference between two electrodes). Electrodes are typically referenced to a physical electrode or site –

  • vertex (Cz)
  • linked-ears
  • linked-mastoids
  • ipsilateral-ear
  • contralateral-ear
  • C7 reference
  • bipolar references

Recording can also be done using reference-free techniques when using 20 or more channels. The system will usually automatically take an average of all the electrodes rather than a physical location. The different averages include:

  • Weighted average reference
  • Common average reference

Once you have your EEG data, utilize AcqKnowledge software to run a number of fully automated EEG analysis functions. A range of fully automated routines provide quick, easy and reproducible results and include approximate entropy, delta power analysis, derive alpha RMS, derive EEG frequency bands, and EEG frequency analysis. The EEG frequency analysis provides a fully automated, epoch driven, analysis of the EEG signal. The system uses power spectral density to report Mean Power, Median Frequency, Mean Frequency, Spectral Edge, Peak Frequency values for each epoch.

For more information on BIOPAC’s wide range of tools for recording, displaying, and analyzing EEG measurements from human and animal subjects, visit BIOPAC’s electroencephalography pages and view BIOPAC’s full line of electrodes, amplifiers, and wearable, wireless transmitters and loggers.

BIOPAC Systems, Inc. provides life science researchers and educators with data acquisition and analysis systems that inspire people and enable greater discovery about life. Visit us at www.biopac.com.

Tips for implanting rodent pups with the Epoch wireless recording system

Implanting pups can be tricky, yet their value as neonatal models of human disease is key.

Tips for implanting rodent pups with the Epoch wireless recording system

The Epoch system enables recording 2 or 4 channels of EEG from neonatal rodents as young as postnatal day 10 (P10) in mice and P6 in rats using the 2-week transmitter. Implanting pups can be tricky—their skulls are very thin and the small size of the animals is difficult to work with. Yet, their value as neonatal models of human disease is key to developing new therapies or understanding neural dysfunction at such an early age.

Our experience has led to the following tips for maximizing the success of implanted pups:

  1. Allow pups time to recover. Although recordings can commence immediately, we recommend waiting 24 hours before commencing recordings to allow a fuller recovery.
  1. Limit recording time. Recording from rodent pups should be limited to about 2 h at a time, preferably in a temperature- and humidity-controlled incubator.
  1. Keep pre-weened pups in their dam’s presence as often as possible. Pups rely on the dam for complete care.
  1. Cull the litter to 4-6 pups. The dam may have issues with pups that are overly cold, not feeding often enough, or simply due to the presence of the transmitter.
  1. Implant all pups. It may be helpful to implant all pups in a litter either with Epoch transmitters or sham transmitters (sham transmitters are available, contact us).
  1. Use chew toys to prevent damage from the dam. Chew toys, such as nylabones, may help prevent the dam from chewing on the transmitters.
  1. Mind the state of the dam. Ultimately, the health and disposition of the dam may affect how she tolerates pups implanted with the Epoch transmitters.

Epoch, the smallest wireless EEG transmitter system available, is provided by BIOPAC to make quality EEG recordings from an early age possible. The Epoch transmitter is simply implanted to the skull of the animal with medical cyanoacrylate, requiring no bone screws. Surgery is quick and simple, requiring a small incision on the scalp, removal of the periosteum with 1% hydrogen peroxide, drilling small holes for the electrodes using a burr-type drill, implanting the transmitter, and re-absorbable sutures.

For more information on BIOPAC’s wide range of tools for recording, displaying, and analyzing EEG signals from human and animal subjects, including automated EEG analysis, seizure detection, evoked responses and many others, visit BIOPAC’s EEG Analysis page or view BIOPAC’s full line of electrodes, amplifiers, and wearable, wireless transmitters and loggers.

BIOPAC Systems, Inc. provides life science researchers and educators with data acquisition and analysis systems that inspire people and enable greater discovery about life. Visit us at www.biopac.com.

error: Content is protected !!