The Physiology of Consumer Buying Habits

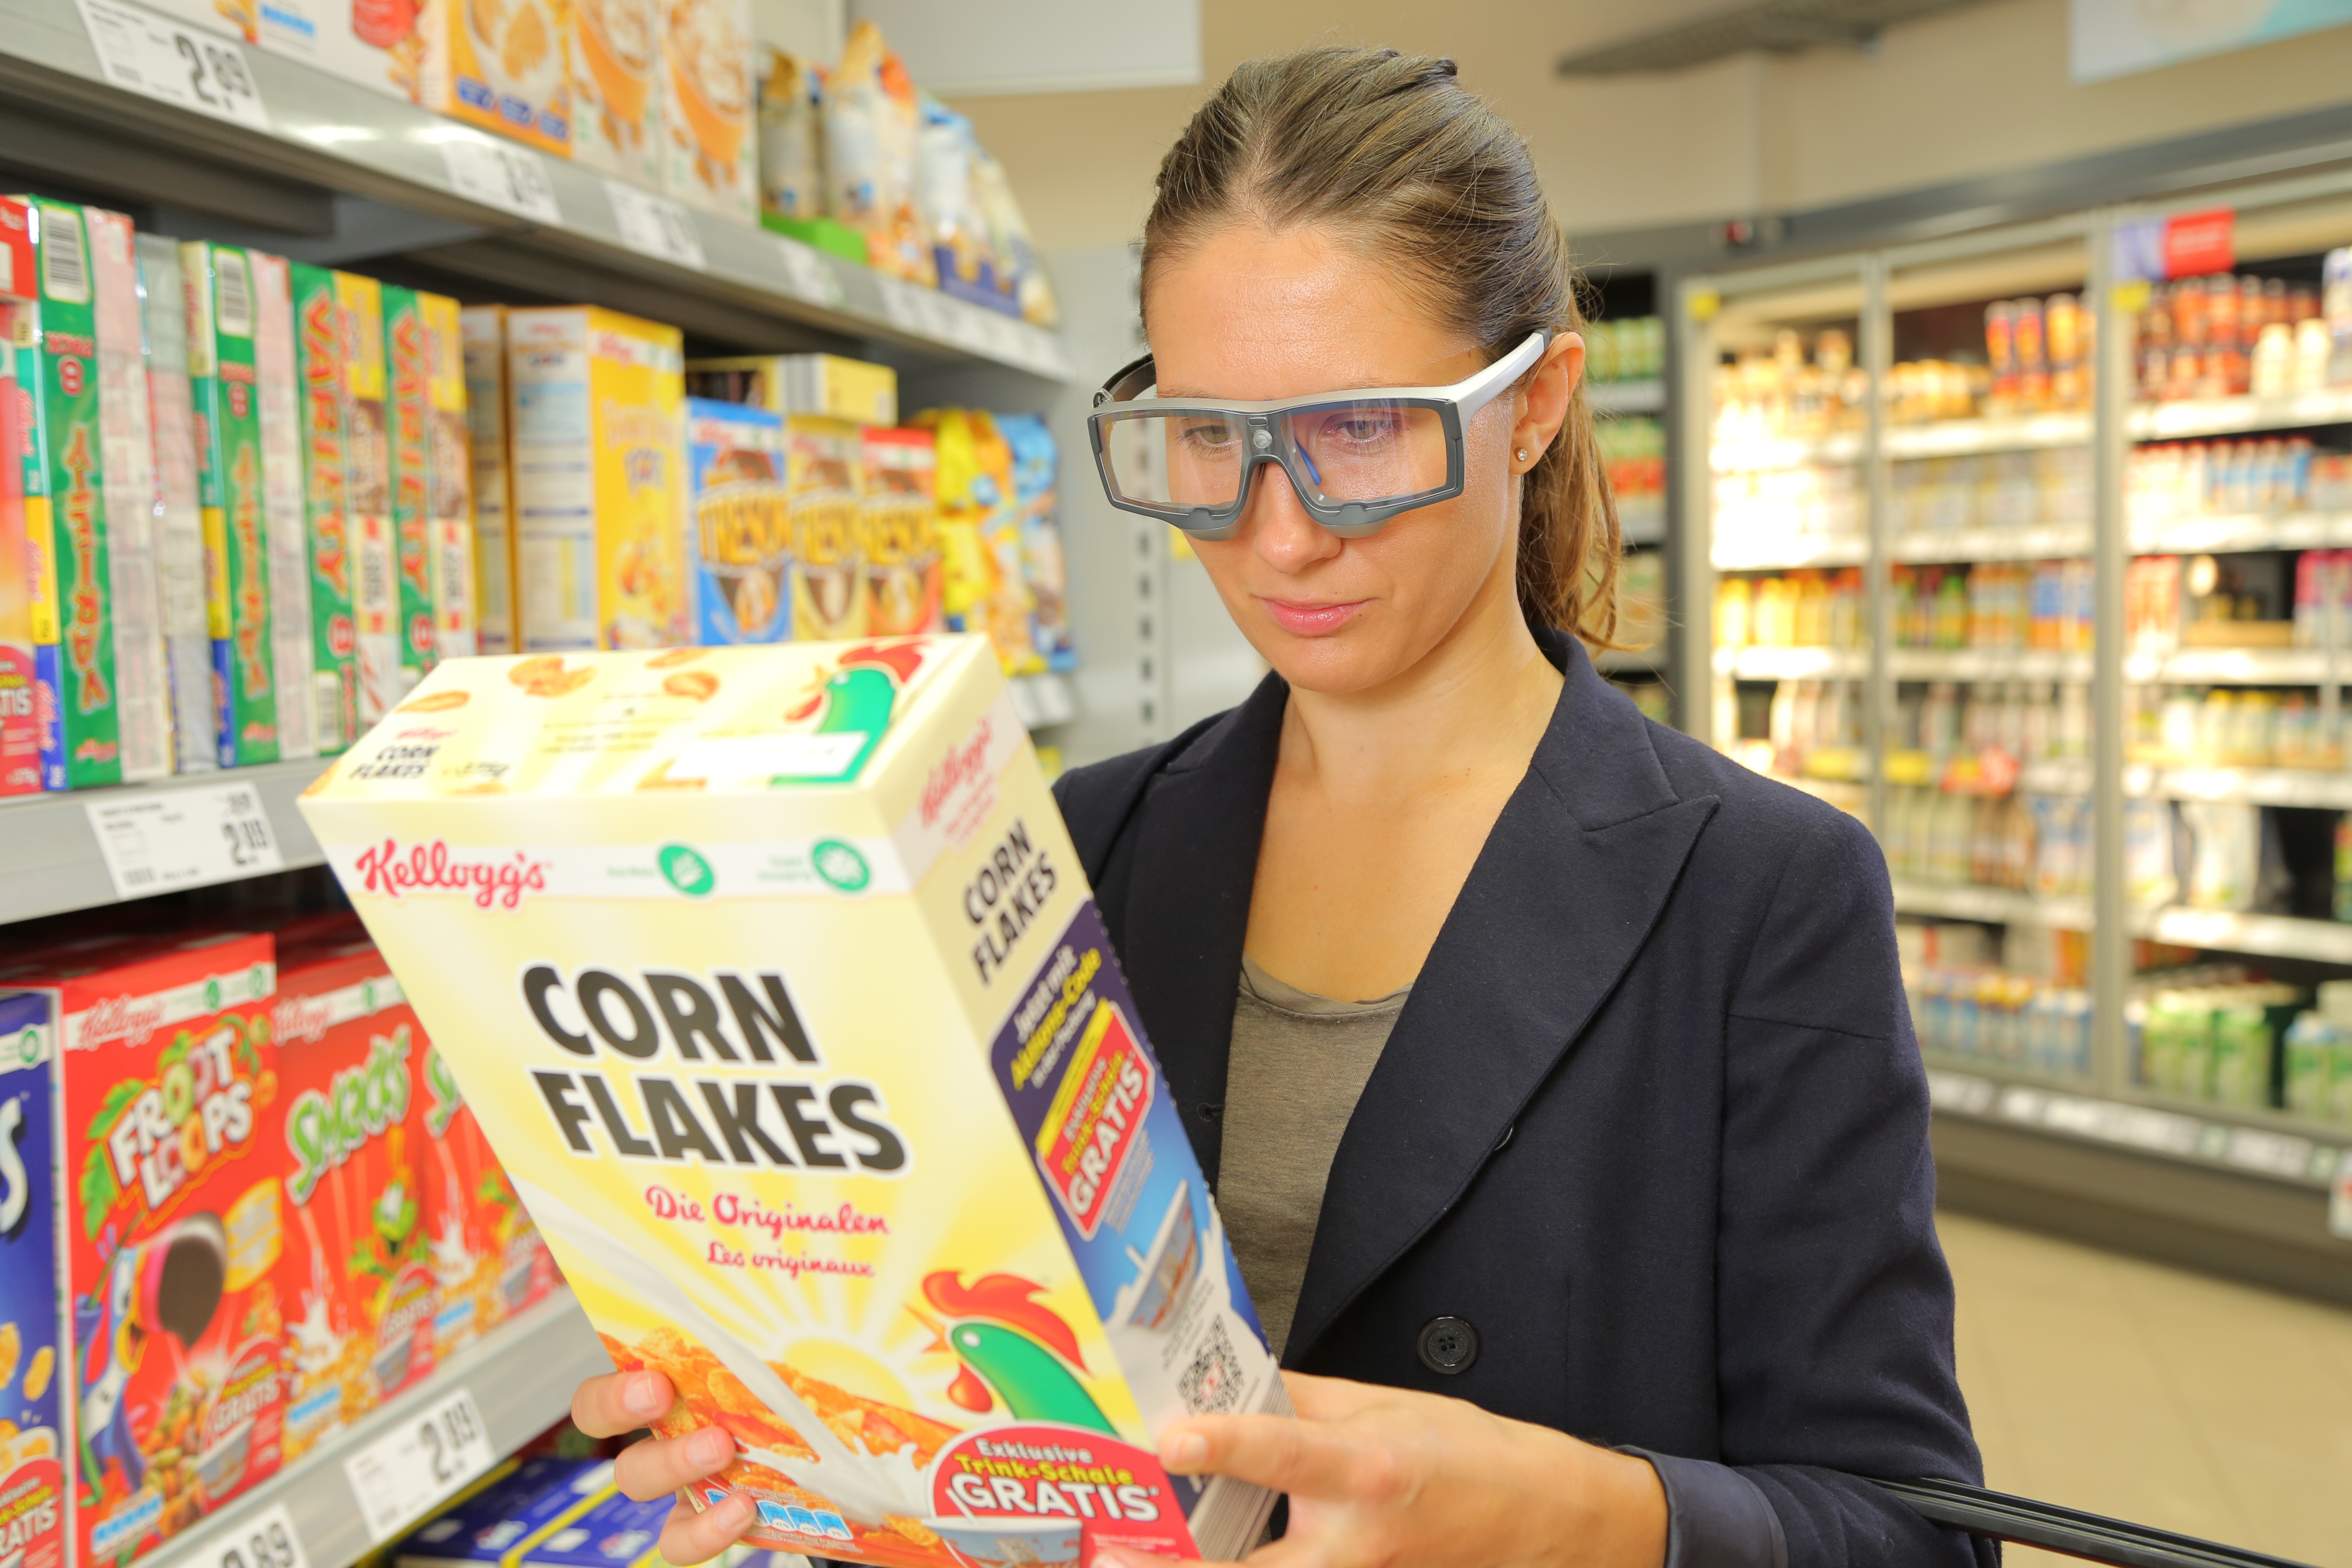
On “Black Friday” in the US, shoppers will come out in search of great deals, and researchers can measure the many physiological factors that motivate shoppers other than deals and price cuts.

Black Friday is one of the most exciting days for consumers in the United States. With the holidays right around the corner, significant deals and price cuts incentivize people to do bulk gift shopping. But is price the only factor influencing shoppers to dedicate hours waiting in line for a product?

In a neurophysiology study by Alexander et al., researchers found that participants who received a coupon while shopping online had a significant increase in oxytocin and a decrease in cortisol. A BIOPAC research system was used to gather ECG, respiration, and skin conductance data while the participants browsed a commerce website.

Another article by Ha-Brookshire and Bhaduri measured ECG response to stimuli that tested consumers’ perceived trust of businesses. The BIOPAC MP36R was used to record participants’ heart rates while they read negative reviews of an apparel business. The results found lower heart rate and less trust were correlated with the less favorable comments.

Conversely, a consumer research study by Langner et al. found that consumers’ love of brands is similar to their love of friends. Signals measured included EDA, EMG, ECG, and BPV, and were recorded by BIOPAC MP160/MP150 hardware to measure arousal levels while participants viewed different brand and interpersonal stimuli.

BIOPAC offers a variety of equipment that can be used in studies similar to the ones presented. To find more information on solutions for recording and analyzing signals such as EEG, EMG, respiration, skin conductance using the MP160/MP150, MP36, and other platforms, you can visit the individual application pages on the BIOPAC website. If you are interested in reading other related studies, visit the publications page on the BIOPAC website.

BIOPAC Systems, Inc. provides life science researchers and educators with data acquisition and analysis systems that inspire people and enable greater discovery about life. Visit us at www.biopac.com.
Circumplex Model of Affect and Motivational State

By Alan Macy, BIOPAC Systems, Inc.

The Circumplex Model of Affect was first described in 1980 by James Russell. Affective states arise from the behavior of two independent neurophysiological systems, the arousal and valence systems. Affective states are a function of these two systems. The circumplex model is two-dimensional, with arousal and valence defined as orthogonal (perpendicular) axes. The arousal axis, plotted vertically, ranges from zero arousal to high arousal.The valence axis, plotted horizontally, ranges from negative to positive. Objective physiological indexes of affect or emotion are available. As valence examples, positive affect is indicated by increasing zygomaticus activity and negative affect is indicated by increasing corrugator activity. Physiological example indices for arousal include heart rate and electrodermal activity.

Perhaps even more fundamental to emotional state is the concept of motivational state. Motivational state is indexed by specific, bodily expressed, physiological states that can easily be measured. Motivational state is based on the concept of core relational themes, called “challenge” and “threat”.  During the course of living, humans relate to difficult environmental circumstances as a combination of challenge and threat. A challenge response is similar to the aerobic physiological response and involves increased stroke volume and cardiac output, unchanged or increased heart rate, decreased vascular resistance and relatively unchanged blood pressure. This response is indicative of efficient mobilization of available energy for coping with circumstances. A threat response is characterized by increased heart rate and blood pressure, increased or little changed vascular resistance, decreased or unchanged stroke volume and relatively unchanged cardiac output. A challenge response occurs when the subject experiences sufficient resources to meet circumstantial demands in a performance situation where goals are important. A threat response occurs when the subject experiences insufficient resources to meet those same circumstantial demands. If a circumstance is determined to be challenging, then subject performance is usually adequate. If a circumstance is determined to be threatening, then subject performance tends to worsen. Motivational state information can be used to better reflect objective differences between similar circumplex model defined emotions, such as anger and fear.

Electrodermal activity (EDA) is a physiological signal that indicates increased SNS activity. EDA is representative of changes in the electrical conductance of the skin due to eccrine (sweat) gland activity. SNS activity increases sweat gland secretions. Eccrine glands only receive activation signals from the SNS, so increased EDA is an indicator of increased arousal.

Skin temperature (SKT) changes are primarily driven by variations in blood flow. These local variations are mainly caused by changes in vascular resistance or arterial blood pressure. Local vascular resistance is modulated by smooth muscle activity, which is mediated by the SNS. SKT variation reflects SNS activity, and is an indicator of emotional state.  In particular, fingertip temperature is a marker for sympathetic induced changes in microcirculation.

Blood Volume Pulse (BVP), also referred to as the Pulse Plethysmogram (PPG), is reflective of variations in microcirculation. As vasculature resistance to flow increases, subject to increased SNS, microcirculation decreases. Accordingly a reduction in PPG (BVP) amplitude reflects increased SNS activity.

The heart and brain are connected bidirectionally via the vagus nerve. Vagal PsNS stimulation, from the brain, influences the heart via the sino-atrial (SA) node. Baroreceptor signals, from the heart, travel back along the vagus nerve to affect the brain. The SA node is the pacemaker of the heart. The SA node receives inputs from both the SNS and PsNS. The SA node can be considered to be a spike-train generator whose inter-spike (firing) interval is modulated by both SNS and PsNS activity levels. Because both SNS and PsNS activity influence SA node spike firing, heart rate behavior can be considered to be dependent on a range of emotional states. SNS activity increases heart rate and PsNS activity decreases heart rate.

Heart rate variability (HRV) is a measure of heart rate changes over time. HRV has a frequency range of 0.003 to 0.4 Hz and is considered to have four sub-bands:  HF, LF, VLF and ULF. High frequency HRV (HF-HRV) band power is in the range of 0.18 to 0.4 Hz and reflects primarily PsNS influences. HF-HRV band power reflects modulation of vagus nerve activity, as driven by respiration. This modulation is called respiratory sinus arrhythmia (RSA). Low frequency HRV (LF-HRV) band power is in the range of 0.05-0.15 Hz and appears to reflect both SNS and PsNS influences. Very low frequency HRV (VLF-HRV) band power is in the range of 0.003-0.05 Hz and may reflect cardiovascular disease, thermo-regulatory cycles and blood plasma renin activity. Ultra low frequency HRV (ULF-HRV) band power is in the range of DC-0.003 Hz and may reflect circadian rhythm activity.

PsNS influences occur over the LF and HF frequency ranges of HRV. SNS influences drop off at about 0.15 Hz and higher. PsNS influences can affect heart rate in a fraction of a second, but SNS influences can only affect the heart rate after a few seconds. Accordingly, PsNS influences are uniquely capable of producing high speed changes in the heart rate. PsNS innervation of the heart is controlled by the right vagus nerve via the SA node. PsNS induced changes in heart rate are associated with vagal nerve activity that is modulated by respiration. Expiration causes an increase in vagal nerve activity, so heart rate decreases. Inspiration causes suppression of vagal nerve activity, so heart rate climbs back up. This combined action is known as respiratory sinus arrhythmia (RSA). RSA is considered, in part, to be a marker for vagal control of heart rate and also for emotional regulation. Total HRV appears to be positively correlated with valence.

When attention increases, there is a short term deceleration of heart rate. Arousal is also correlated to a long term acceleration in heart rate. Heart rate also provides an indication of valence. Compared to neutral stimuli, both positive and negative stimuli first exhibit a short term decrease in heart rate. Over the long term, positive stimuli are correlated with an increase in heart rate while negative stimuli usually are correlated to a decrease in heart rate.

Respiratory activity occurs via periodic contraction and relaxation of respiratory muscles, including the diaphragm, intercostal and abdominal muscles. The motor outputs for controlling respiration are generated by efferent neurons in the spinal cord.  There are autonomic and voluntary breathing pathways to these respiratory-related efferent neurons. A variety of afferent (sensory) inputs influence respiratory rate and tidal volume in support of the body’s metabolic demands. SNS activity increases respiratory rate and PsNS activity reduces respiratory rate.

Several EEG studies suggest that emotional valence is linked to frontal lobe activation, typically indexed by alpha power. Positive valence is correlated to increased activation of  the left frontal lobe and negative valence is correlated to increased activation of the right frontal lobe.  Other studies have suggested that frontal lobe EEG activation asymmetry reflects the relative balance of motivational state, more so than emotional valence.  In this work, enhanced left frontal lobe activation predicted dispositional states towards challenge and enhanced right frontal lobe activation predicted dispositional states towards threat.

Artwork adapted from from Russell, J. A. (1980). A circumplex model of affect.Journal of Personality and Social Psychology, 39, 1161–1178.

For more information on BIOPAC’s wide range of tools for recording, displaying, classifying, and analyzing psychophysiological measurements—including EEG, ECG, EDA, PPG, and emotional states—visit BIOPAC’s applications pages and view BIOPAC’s full line of physiology data acquisition and analysis systems, electrodes, amplifiers, and wearable, wireless transmitters and loggers.

BIOPAC Systems, Inc. provides life science researchers and educators with data acquisition and analysis systems that inspire people and enable greater discovery about life. Visit us at www.biopac.com.

 

Filtering

There are a few basic filter types and many methods available to implement those types. Commonly used filters are: Lowpass, Highpass and Bandpass.

By Alan Macy, BIOPAC Systems, Inc.

Filtering is a core signal processing function. Filtering is the act of discrimination between one type of data and another. In the case of physiological signal processing, filters are employed to attenuate undesired signal frequencies and emphasize others. There are a few basic filter types and many methods available to implement those types. Commonly used filters are: Lowpass, Highpass and Bandpass. In the case of a Lowpass filter (LPF), signal frequencies lower than the filter cutoff frequency are emphasized versus those higher than the cutoff frequency. For a Highpass filter (HPF), the signal frequencies higher than the filter cutoff frequency are emphasized versus those lower than the cutoff frequency. A Bandpass filter (BPF) has two cutoff frequencies, a low and high cutoff. In this case, signal frequencies between the filter cutoff frequencies are emphasized versus those lower then the low cutoff frequency and higher than the high cutoff frequency. All types of filters can be crafted as a combination of Lowpass, Highpass and Bandpass filters. For example, a comb filter can be constructed from a cascaded series of Bandpass filters.

Filters can be implemented as analog or digital. Analog filters are physically realized using electrical components, such as resistors, capacitors, inductors, delay lines and operational amplifiers. Digital filters are implemented as an algorithm, which may reside in a computer, embedded microprocessor or digital signal processor. Digital filters require the signal data to be digitized, prior to processing. An analog to digital converter is used to convert time-varying signal data into a sequential string of proportional numbers. Digital filters process this input string of numbers to generate an output string of numbers. This output string of numbers can then be converted back into a time-varying signal through the use of a digital to analog converter.

Analog filters can be reasonably well-emulated by the combination A/D converter > Digital Filter > D/A converter. In the case of physiological measurements, it’s most common to employ analog to digital converters to direct the signal data straight to the computer. Once in computer memory, digital filters can be applied to the data to extract the signals of interest.

There are two popular algorithms used to implement digital filters, Finite Impulse Response (FIR) and Infinite Impulse Response (IIR). Both FIR and IIR filters incorporate delay elements, multipliers and a summing junction, however FIR filters don’t use feedback and IIR filters do use feedback. Feedback in an IIR filter means that some portion of the filter’s output is introduced back to the filter’s input. Assuming a perfect IIR filter, the recursive process implies that any input signal to the filter will have a residual influence on the output of the filter for an arbitrary period of time. This is why feedback or recursive filters are called infinite impulse response filters. An impulse applied to an IIR filter will produce a response that lasts for eternity. In practice, however, the impulse response of IIR filters will ultimately drop to a value range which can no longer be properly characterized by the significant digits employed during processing. Accordingly, the effective impulse response of IIR filters remains finite.

An FIR filter does not incorporate feedback or recursion into its design. This type of filter pushes the signal data through the filter in just one direction. In order to make an effective FIR filter, typically many internal filter stages are needed. A FIR filter stage consists of a delay element combined with a multiplier element. A 101 stage FIR filter will have 101 sequential delay stages and 101 multiplier stages. The multiplier stages sample the data present after each delay stage and multiplies the sensed value by some predefined constant, called a coefficient. The multiplier stage outputs are all summed together to create the FIR filter output.

Because IIR filters are recursive and FIR filters are non-recursive, they differ in important ways. If not properly designed, IIR filters can be unstable. Instead, no matter how an FIR filter is designed, it’s inherently stable. IIR filters do not have perfectly linear phase, even if they can be designed to have reasonably linear phase in regions of interest. FIR filters can have perfectly linear phase. Linear phase means that the filter will delay all frequencies by the same time period. This time delay is known as group delay. Linear phase filters can faithfully mimic the essential shape of complex input waveforms, whereas non-linear phase filters may introduce certain distortions to the shape of an input waveform. Because of similarities in topology, certain types of IIR filters are well-suited to emulate certain analog filters. Because analog filter design methods are very advanced and well-documented, this topological similarity allows analog design methods to be transposed to the digital domain. For example, common analog or digital IIR filter can both implement a transfer function defined by a ratio of biquadric functions. These filters are known as biquads or second order filters. When designing a biquad IIR filter, the biquad analog transfer function is converted to digital form via a substitution process called the bilinear transformation.

For more information on BIOPAC’s wide range of tools for recording, displaying, and analyzing EEG measurements and filtering data from human and animal subjects, visit BIOPAC’s filtering or electroencephalography pages, and view BIOPAC’s full line of electrodes, amplifiers, and wearable, wireless transmitters and loggers.

BIOPAC Systems, Inc. provides life science researchers and educators with data acquisition and analysis systems that inspire people and enable greater discovery about life. Visit us at www.biopac.com.
Electroencephalography (EEG) Pt. 1

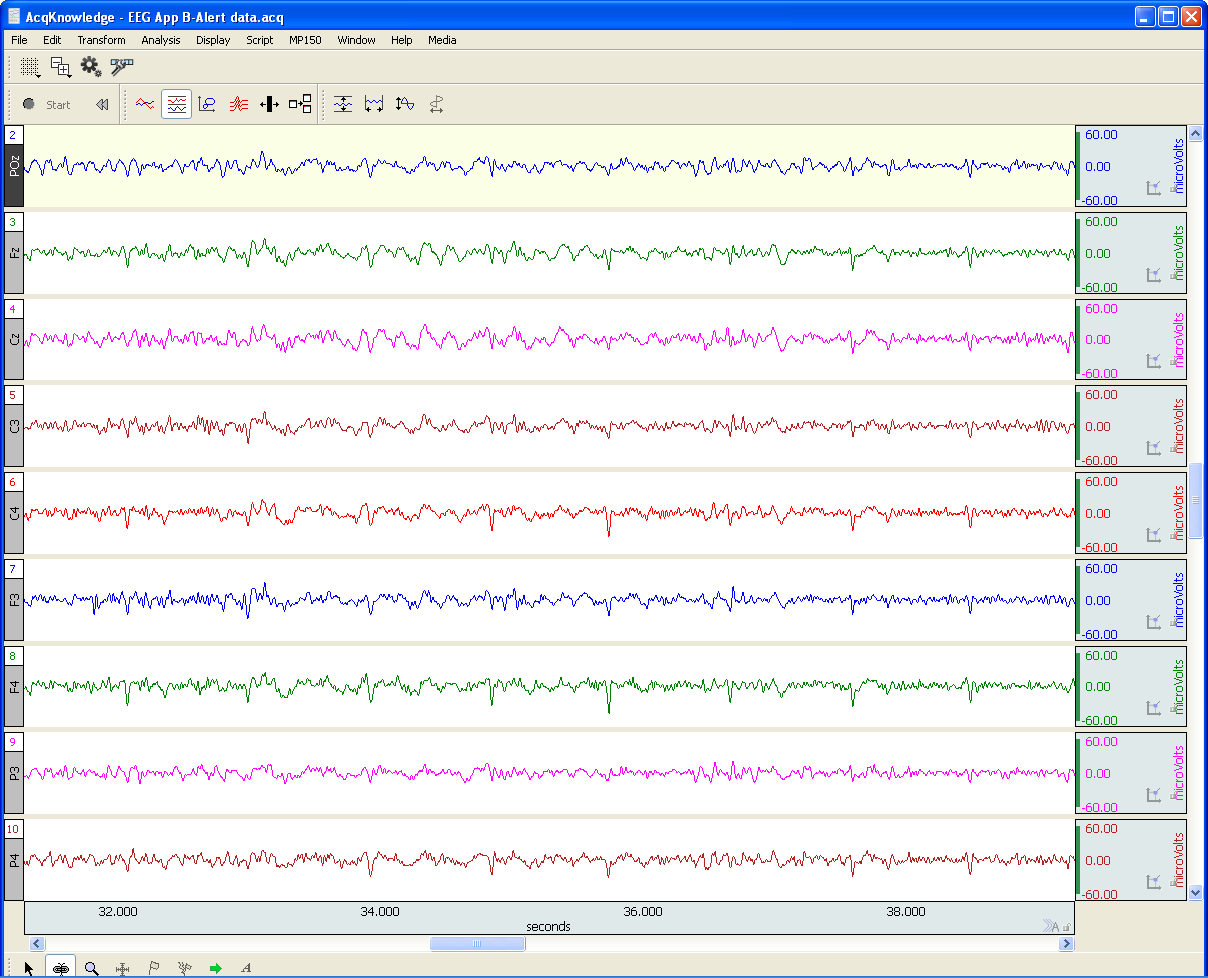
An EEG recording can be short or long-term. Shorter-term, signal-averaged, EEG measurements are typically used to evaluate precognitive and cognitive processes with respect to specific stimuli.

by Alan Macy, BIOPAC Systems, Inc.

EEG or Electroencephalography is the measurement of differences in electrical potential (voltage) between points on the scalp. These voltages differences are the result of ionic current flow within neurons, and glial cells, in the brain. The measured scalp voltages are primarily in the 200 nV-200 uV amplitude range, 0.01 Hz – 100 Hz frequency range, and are typically simultaneously recorded at multiple sites on the scalp. The EEG is usually collected using the 10-20 electrode montage. This arrangement of electrodes typically references left or right hemisphere electrodes to the left or right earlobe (or mastoid), respectively. However, a wide range of signal referencing methods are used depending on the situational requirements.

An EEG recording (knows as an electroencephalogram) can be short or long-term. Shorter-term, signal-averaged, EEG measurements are typically used to evaluate precognitive and cognitive processes with respect to specific stimuli. These EEG signals have relatively low amplitude levels, typically 200 nV – 2 uV, so signal averaging methods are required to discern these signals from background concurrent EEG sources. Longer-term, non-signal-averaged, EEG measurements are used to discern the subject’s, real-time, conscious state. Different and observable wave rhythms are evident during such recordings. Commonly observed rhythms include: Delta, Theta, Alpha, Beta and Gamma waves. These waves can be continuously recorded and are in the range of 2 uV – 200 uV.

Delta waves (0.5-4 Hz) are considered slow rhythms and tend to be the highest in amplitude. Delta waves are normally the dominant rhythm in infants. Delta waves are found in sleeping adults and consistent Delta is considered abnormal in conscious adults.  Delta waves are low-frequency EEG patterns that increase during sleep in the normal adult.  Although Delta waves are generally prominent during sleep, there are cases when Delta rhythms are recorded from awake individuals. Delta waves may increase during difficult mental activities requiring concentration and other continuous-attention tasks. Delta rhythms depend on activity of motivational systems, in the brain, and participate in the identification of prominent phenomena.  The presence and amplitude of Delta rhythms are highly variable within and between individuals.

Theta waves (4-8 Hz) are considered slow rhythms. Theta waves are normal in children up to 13 years old.  Theta waves are found in sleeping adults and consistent Theta is considered abnormal in conscious adults. Theta rhythms are low-frequency EEG patterns that increase during sleep in the normal adult. Although Theta rhythms are generally prominent during sleep, there are cases when theta rhythms are recorded from awake individuals.  Theta rhythms are involved in memory and emotional regulation. Theta waves will spike during emotional responses to frustrating events or situations.  Theta waves are associated with the inhibition of elicited responses, in that Theta activity has been found to temporarily increase when a person is actively trying to repress a behavioral response. The presence and amplitude of theta rhythms are highly variable within and between individuals.

Alpha waves (8-13 Hz) are considered moderate rhythms and usually seen in the occipital regions of the head and are higher in amplitude on the dominant side. Alpha waves appear when relaxing and closing the eyes. Alpha waves are suppressed when opening the eyes or coming to an alert state. Alpha waves are the primary rhythm observed in relaxed adults and are present during most of life after 13 years old. Each region of the brain has a characteristic Alpha rhythm amplitude and the largest Alpha waves are from the occipital and parietal regions of the cerebral cortex. Alpha rhythms correlate with inhibitory processes in the brain. Reduced Alpha wave occurrence and amplitude, in relation to Delta-Theta activity, is associated with reduced inhibitory control over behavior.

Beta waves (13-30 Hz) are considered fast rhythms. Beta waves are typically observed on both sides of the head and are most evident frontally (executive function). Beta waves may be substantially reduced in areas of cortical damage.  Beta waves are considered normal and are the dominant rhythm in subjects whose eyes are open or are otherwise attentive to external stimuli or exerting specific mental effort. Beta rhythms also occur during rapid eye movement (REM) sleep. In this situation, the typical Alpha rhythm is suppressed and supplanted by Beta waves. This replacement of Alpha rhythm is called desynchronization, or “Alpha block”, because it represents a change in the synchronized activity of neural systems in the brain. It is thought that Beta waves represents arousal of the cortex to a higher state of alertness and may also be associated with memory retrieval.

Gamma waves (30-100 Hz) are considered fast rhythms. Gamma waves are present during mixed sensory processing, such as perceptual tasks that combine hearing and seeing. Gamma waves are also evident during short-term memory matching of recognized sights, sounds or sensations. A reduction in Gamma wave activity might be associated with cognitive decline, especially when compared to Theta wave activity levels.

Long-term EEG signal characteristics are related to consciousness. As conscious activity increases, the dominant EEG rhythms shift to higher frequencies. When asleep, with the exception of REM, the dominant EEG rhythms move to lower frequencies.  In deep sleep, the EEG is characterized by low frequency Delta waves.

This blog is continued in Part 2.

For more information on BIOPAC’s wide range of tools for recording, displaying, and analyzing EEG signals from human and animal subjects, including automated EEG analysis, seizure detection, evoked responses and many others, visit BIOPAC’s EEG Analysis or view BIOPAC’s full line of electrodes, amplifiers, and wearable, wireless transmitters and loggers.

BIOPAC Systems, Inc. provides life science researchers and educators with data acquisition and analysis systems that inspire people and enable greater discovery about life.  Visit us at www.biopac.com.
Practical Tips for Recording Physiological Data in MRI

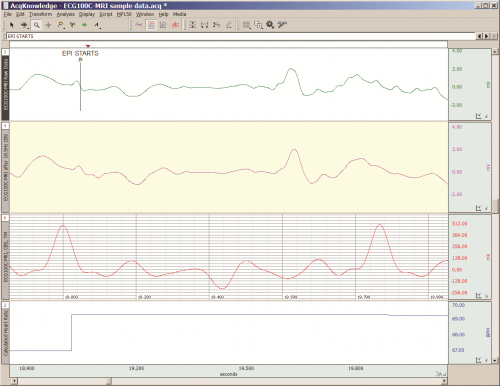
The MRI system incorporates a VERY strong magnetic field and both emits and records radio frequency (RF) energy. This has impacts on subject and experimenter safety and on data accuracy.

By Alan Macy, BIOPAC Systems, Inc.

When recording physiological signals from subjects in MRI systems, two issues are very important:

  1. The MRI system incorporates a VERY strong magnetic field. It is extremely important that no significant magnetically susceptible objects are taken into the room that houses the MRI System.  All materials have some degree of magnetic susceptibility. However, materials with mass magnetic susceptibility values, similar to or have magnitude less than that of water (-0.91E-8 m^3/kg), are typically permitted to be used in the vicinity of MRI Systems. No electrodes, electrode leads, transducers or cabling, that contain significant magnetically susceptible components, should be used when recording data from a subject in the MRI.
  2. The MRI System both emits and records radio frequency (RF) energy. This energy is typically in the range of 5 to 500 MHz. For a 3T MRI, the characteristic proton precession frequency will be 3T * 42.7 MHz or 128.1 MHz.  MRI generated RF energy will, at least, partially reflect from encountered conductors and induce current flow in those conductors. Signal reflections and induced currents can disrupt sensitive imaging operations by creating signal artifacts. Also, RF induced currents, if not properly controlled, can cause local heating.

Care must be taken to limit the flow of RF energy both in and out of the room that houses the MRI. RF energy from the MRI superimposes with the very small biopotentials and transducer signals in the vicinity of the subject. Alternatively, RF energy from recording or other equipment in the MRI Control Room (e.g. digital clocks and power supply switching noise) can leak into the MRI chamber, via subject cabling, and cause degradation of the image created by the MRI. It can be complicated to record biopotentials, from a subject’s body, during an MRI scan. These signals are very tiny and the RF energy, and associated magnetic field shifting, generated by the MRI corrupts the recording. Accordingly, successful biopotential recording in the MRI involves the use of specialized amplifiers, optimized cabling, patch-panel filtering, advanced signal processing and/or synchronization with MRI scanning processes to perform clean measurements.

When RF energy is pulsed into the subject, this energy spreads throughout the subject because the subject is a volume conductor. As the MRI magnetic gradient shifts in synchrony with RF energy pulsing, the gradient shift induces a current flow in conductors that intersect with the field. From a practical standpoint, RF energy pulsing and gradient-induced current flows often manifest themselves as repetitive artifact signals directly in the band of the physiological generated biopotentials. This is because RF energy pulsing and magnetic field gradient switching are performed synchronously for imaging and the repetition rates for image slice generation usually fall within the range of 1-100 Hz. Depending upon the biopotential frequency range (from lowest to highest: EGG, EOG, ECG, EEG and EMG), different amplification and signal processing techniques can be used to isolate the signal of interest. Furthermore, it’s often helpful to control imaging processes so that the MRI artifact signal spectrum does not unduly impact the measured physiological signal spectrum.

For more information on BIOPAC’s MR Safe and MR Conditional solutions, visit BIOPAC’s MRI page or view BIOPAC’s full line of electrodes, amplifiers, and wearable, wireless transmitters and loggers.

Download a related and important application note that describes the relationship between MRI imaging sequences and associated physiological measurements, when subjects are monitored in the MRI. In particular, this note addresses newfound insights on the impact that imaging sequence types have upon simultaneously recorded electrocardiography (ECG) and impedance cardiography (ICG) subject measurements.

BIOPAC Systems, Inc. provides life science researchers and educators with data acquisition and analysis systems that inspire people and enable greater discovery about life.  Visit us at www.biopac.com.

Five Steps to a Better Physiology Lab – Preparation

Integrating new hardware and software into the Physiology lab curriculum…key points from instructors who have created successful labs that will greatly increase the chances of a rewarding lab experience for both students and instructor.

by William McMullen, BIOPAC Systems, Inc.

Integrating new hardware and software into the Physiology lab curriculum can be intimidating. Despite the best of early-summer intentions, in fall Instructors often find themselves apprehensively staring at a box full of unfamiliar equipment a few short days before the first lab. Luckily, the Biopac Student Lab excels in this situation, as it is easy to use and includes all materials necessary for students to prepare, record and analyze their data. This means that, in a crunch, if all one did was install the software and verify the hardware connections, most students should obtain meaningful data. Beyond the default setup, there are multiple customization options as described in the user support documentation. There are, however, some key points we have learned from instructors who have created successful labs that will greatly increase the chances of a rewarding lab experience for both students and instructor.

1. Organize the lab such that each student participates equally and each obtains recorded data from their bodies.
Students are more motivated when working with their own data. The Biopac Student Lab requires a minimum of three students for most lessons; a Recorder, a Director and a Subject. At the end of each lesson recordings, the students should rotate through these rolls and rerun the lesson until each student has recorded their own data. In order to provide enough recording time in a standard 2 hour lab period, the number of students per lab station should be four to five.

2. Setup basic Lesson Preferences before the first lab to minimize confusion.
Run each lesson* that will be used and setup the following:

  • If using lessons L02, L07-L09 or L12-L17, different models of transducers may be used. Check that the image and transducer descriptions in the lesson guide match the hardware used. If changes are needed, choose File > Lesson Preferences and select the desired transducer.
  • Disable undesired recording tasks by choosing File > Lesson Preferences > Lessons Recordings. If none of the recording tasks are desired (if using a custom procedure), disable all and only generic information will be displayed in the lesson guide.

*Note: If using the optional Curriculum Management System (available in BSL 4.1), only changes to the Host computer are required and all other computer/lab stations will be automatically updated. If not using this option, the changes must be made to each computer.

3. For Lessons L12 and L13 (Pulmonary Function), greatly reduce calibration time by matching the hardware with the software.
Label the lab station computer, the MP device and the Airflow Transducer (SS11LA/L) and make sure they are always matched. Run lesson 12 and check File > Preferences > Calibration Syringe Size to make sure it matches the syringe that will be used. Choose File > Preferences > Calibration Syringe Values and then select “Set once and use stored values”. Carefully run through the calibration using the syringe. From then on, when the students run the lesson, they will only need to calibrate for zero baseline (no syringe) which is easy and only takes a few seconds.

4. Students should have a basic understanding of the software before the first lab.
All Biopac Student Lab lessons use the same basic software tools and if students have a basic understanding of these tools in advance, they will experience greater success obtaining good data and having a positive lab experience. Students should be instructed to download the free Biopac Analysis software onto their personal computers.

This software not only provides the ability to analyze the data recorded in the lab but also allows students to prepare for a lab by studying the included tutorial videos and sample data. Some instructors give a test prior to the first lab to make sure students reviewed the BSL Tutorial Video.

5. Demonstrate proper electrode preparation and explain ways to minimize motion artifact. 
For lessons that use electrodes, good electrode contact and minimal EMG/motion artifact are keys to obtaining good data. Although this is explained in the procedures, it cannot be emphasized enough. Demonstrate the cleaning of the skin (with soap or alcohol) to remove dirt and oil and the abrading around the electrode site to remove the dead epidermal layers that impede electrical flow. Always place a drop of electrode gel on the electrode and wait at least 5 minutes after electrode placement before beginning a recording. To minimize EMG artifact, the student should be as relaxed and motionless as possible (unless procedure calls for movement). Talking, blinking (during EEG or EOG recording), laughing or deep breathing will add unwanted EMG artifact to the data.

These easily implemented steps will greatly assist students in obtaining good data from the very first lesson, leading to a positive lab experience and ultimately gaining a better understanding of Physiology.


BIOPAC Systems, Inc. provides life science researchers and educators with data acquisition and analysis systems that inspire people and enable greater discovery about life. BIOPAC lets you measure physiology anywhere, with innovative, compatible wireless, wearable solutions that can be used by anyone for meaningful discovery. We make high-quality scientific tools for physiology measurement and interpretation with superior compatibility and world-class customer service and support. Visit us at www.biopac.com.

error: Content is protected !!