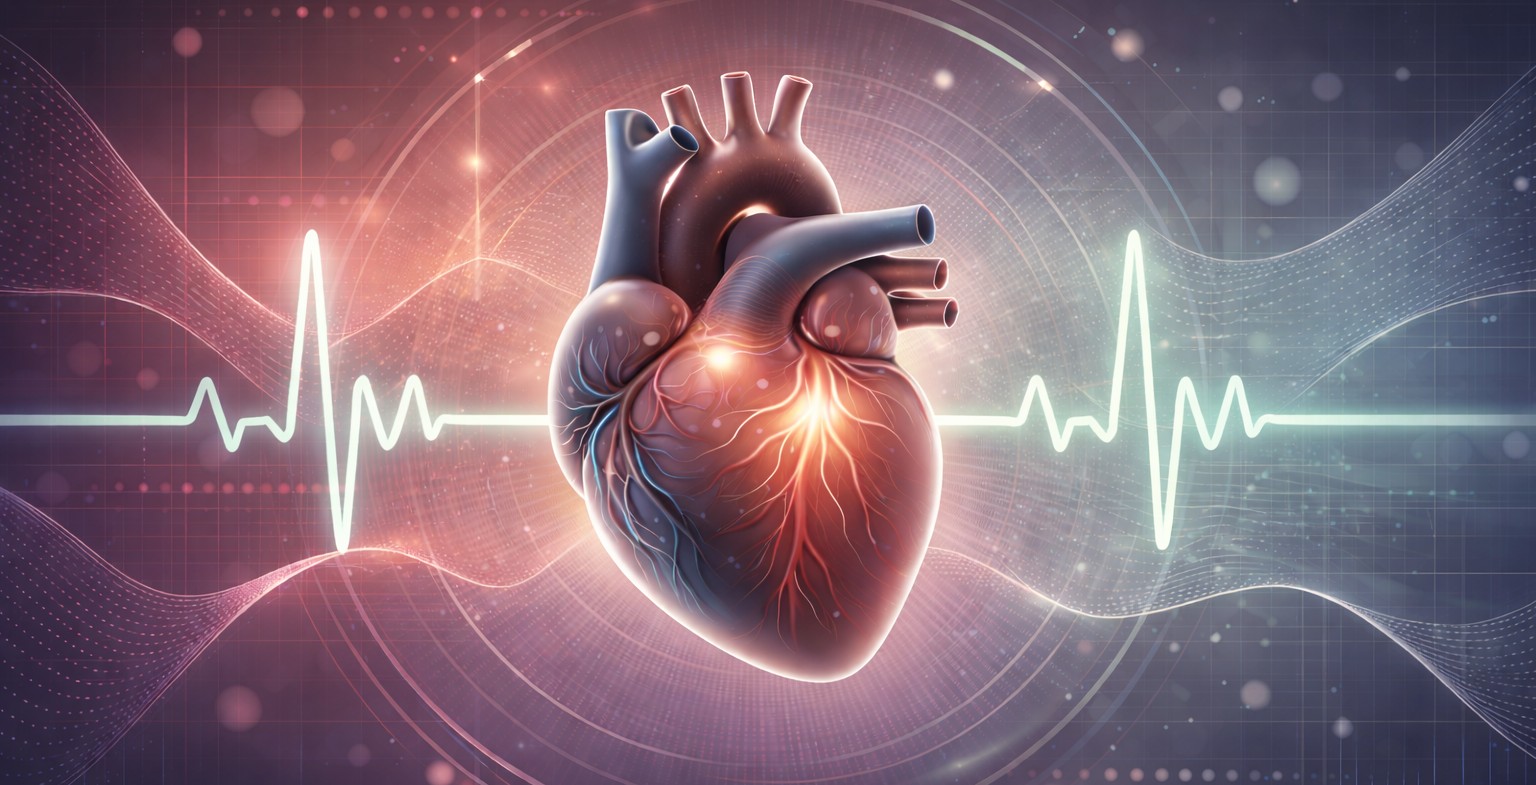
As researchers look for cleaner, more direct ways to capture sympathetic nervous system (SNS) activity, Trans-radial Electrical Bioimpedance Velocimetry (TREV) has emerged as a powerful new approach for measuring beat-by-beat changes in cardiac contractility to index sympathetic drive. To explain how the technique works and where it fits alongside more established measures, we sat down with Viktoriya Babenko, PhD, BIOPAC’s in-house TREV expert and research specialist. Babenko helps researchers implement advanced cardiovascular and autonomic measurements, combining her extensive hands-on experience with bioimpedance technologies and a strong grounding in the interpretation of physiological signals. In the Q&A below, she describes the physiological principles behind TREV, how it differs from traditional electrodermal activity (EDA), electrocardiogram (ECG), and impedance cardiography (ICG) approaches, and why it offers a uniquely direct and practical window into sympathetic drive for both laboratory and neuroimaging research.
At a high level, what is Trans-radial Electrical Bioimpedance Velocimetry (TREV), and what does it measure?
TREV is a noninvasive method for estimating cardiac contractility as a continuous, beat-by-beat index of SNS activity. Rather than measuring bioimpedance across the chest like traditional ICG, TREV measures impedance changes across the radial and ulnar arteries of the forearm.
As the heart contracts, it generates a pressure wave that travels through the arterial system and causes red blood cells to momentarily align. This alignment reduces electrical resistance in the blood, which TREV continuously tracks. The impedance signal measured by TREV provides velocity, acceleration, and ultimately a contractility index, where stronger contractions reflect greater sympathetic drive.
Why is cardiac contractility such a useful index of SNS activity?
Cardiac contractility reflects the vigor with which the heart contracts during each heartbeat and is strongly modulated by sympathetic tone, either through direct neural innervation or circulating catecholamines like epinephrine. Increased sympathetic activation leads to stronger, faster contractions, while reduced sympathetic drive results in weaker contractile force.
Because of this close physiological relationship, contractility is considered one of the most direct and objective noninvasive measures of SNS activity. Unlike heart rate alone, which reflects both sympathetic and parasympathetic influences, contractility provides a more targeted window into sympathetic drive specifically.
How does TREV differ from traditional ICG- or ECG-based approaches?
Traditional approaches for indexing sympathetic drive, such as combining ECG and thoracic ICG to extract the pre-ejection period (PEP), are powerful but complex. They typically require 10 electrodes placed across the neck, chest, and torso, along with careful preprocessing and time-based feature extraction between both ICG and ECG to get PEP.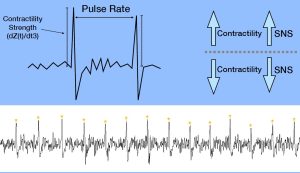
TREV dramatically simplifies this process by using just four strip electrodes placed on the forearm. The resulting contractility waveform produces a single sharp peak per heartbeat, where the amplitude directly reflects contractile strength. Analysis is as simple as extracting peak amplitudes, rather than identifying precise timing relationships across ECG and ICG signals, making TREV faster to set up and easier to analyze.
What is the physiological rationale for using the forearm and radial and ulnar arteries as the measurement site?
The radial and ulnar arteries provide a relatively simple and accessible vascular model that is well-suited for bioimpedance measurements. When the heart contracts, a pressure wave propagates rapidly through the arterial tree and reaches the forearm, aligning red blood cells even before bulk blood flow arrives.
This pressure-wave-driven alignment is sufficient to cause measurable drops in impedance, allowing TREV to estimate cardiovascular dynamics without the anatomical and physiological complexity of the thorax. Measuring at the forearm also reduces sensitivity to respiratory and pulmonary effects that complicate thoracic impedance measurements.
What cardiovascular or hemodynamic parameters can be derived from TREV?
TREV provides estimates of blood velocity, acceleration, and the integral of velocity (blood position) derived from the impedance waveform. Most importantly, the second derivative of the impedance signal yields a contractility index (blood flow “jerk”) that reflects sympathetic modulation of the heart on a beat-by-beat basis.
While multiple parameters are available, BIOPAC primarily recommends TREV as a tool for tracking cardiac contractility over time, particularly in studies interested in stress, arousal, motivation, and cognitive or emotional processes linked to sympathetic activation.
What does a typical TREV measurement session look like, from setup to data output?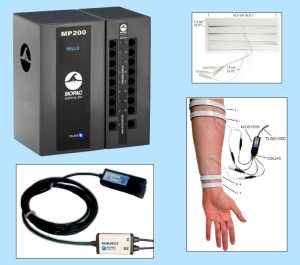
Once the arm is clean and dry, four hydrogel strip electrodes (EL526) are placed on the forearm and connected via the CBL246 adapter to the NICO100D system. I recommend watching the TREV Webinar titled “A Simple Next-Gen Method for Stress Research: TREV” for step-by-step guidance on electrode placement.
During data collection, the participant’s arm must remain fully supported and relaxed, ideally with the elbow and forearm stabilized through the wrist to minimize muscle activity. When collected under proper conditions, TREV produces a clean, continuous contractility waveform with one peak per heartbeat, allowing for straightforward beat-by-beat analysis of sympathetic drive.
What advantages does TREV offer compared to ECG, EDA, or other stress-related measures?
Many commonly used physiological signals, such as heart rate, blood pressure, or heart rate variability, are influenced by multiple factors, including hydration, temperature, respiration, and both branches of the autonomic nervous system (parasympathetic and sympathetic nervous systems). EDA provides a sympathetic index, but it is relatively slow, delayed, and indirect, reflecting eccrine sweat gland activity modulated by the SNS rather than cardiovascular dynamics.
TREV fills an important gap by offering a fast, dynamic, and more direct measure of sympathetic drive through cardiac contractility. It combines the physiological specificity of ICG-derived measures with a much simpler setup and analysis pipeline, making it especially attractive for experimental and applied research settings
What are the main challenges in acquiring clean, interpretable TREV data?
The primary challenge with TREV is its sensitivity to motion artifact. Muscle activity in the forearm generates electromyography (EMG) signals that are much larger than the impedance changes of interest and can easily overwhelm the TREV signal.
For this reason, careful experimental control is essential. The participant’s arm should be fully supported, relaxed, and free from movement or strain, while other body movements are generally permissible. When these conditions are met, TREV data quality is excellent, but the method does demand attention to posture and comfort.
In what research or applied settings is TREV showing the most promise?
TREV is particularly well-suited for research at the intersection of stress, cognition, emotion, and autonomic physiology. It has been successfully used in laboratory studies examining sympathetic responses to cognitive and emotional stressors, as well as in MRI environments to enable the simultaneous study of neural activity and SNS dynamics.
Across both standard laboratory settings and neuroimaging environments, TREV provides a continuous, beat-by-beat index of sympathetic activity, making it especially valuable for event-related experimental designs where precise timing and dynamic changes in autonomic responses are of interest. In the MRI specifically, this temporal resolution allows researchers to directly link moment-to-moment fluctuations in sympathetic drive with neural processes measured using functional MRI (fMRI), offering a powerful framework for studying how brain activity and cardiovascular sympathetic responses interact during task performance, affective processing, or stress-related appraisals. As with most MRI-based physiological measurements, specific hardware configurations and safety considerations apply, and researchers should contact the BIOPAC support team before data collection to ensure proper setup and compliance.
How does TREV perform in dynamic or real-world conditions, such as movement or exercise?
At present, TREV performs best in controlled conditions where the forearm can remain fully supported and at rest. Simple movements while seated may be permissible, provided that the arm containing the TREV electrodes remains immobile and relaxed. Due to its sensitivity to motion, TREV is not currently recommended for continuous data collection during active movement or exercise.
That said, TREV can still be extremely valuable in movement- or exercise-related research by comparing pre- and post-task states. This approach allows researchers to quantify sympathetic changes associated with physical or psychological challenges without collecting data during movement itself.
Looking ahead, how do you see the TREV method evolving over the next five to ten years?
As validation studies continue and more researchers adopt the method, TREV is likely to become a standard tool for indexing sympathetic drive in both basic and applied research. Ongoing work, including peer-reviewed publications, will further refine interpretation, best practices, and experimental design considerations.
In the longer term, improvements in signal processing, hardware integration, and multimodal data collection may expand TREV’s use into more naturalistic settings, helping bridge the gap between controlled laboratory studies and real-world physiological monitoring.
If you are planning a study and would like to learn more about integrating TREV, our team of experts can help guide you to the right equipment and strategies.
Related posts: Body Electrictric: Bioimpedance in Physiology Research and ‘Tis the Season for Stress: Research Tools for Anxious Times
