
Tick, Tock: Pulse Transit Time Offers Noninvasive Physiological Insights

A split second can reveal much about the cardiovascular system and the other physiological systems it influences. Pulse Transit Time (PTT) captures one of those critical moments, the brief interval it takes for the pressure wave generated by contraction of the left ventricle to travel from the heart to a peripheral site in the body. That tiny stretch of time tells us something important about the arteries—namely, how stiff or flexible they are in that moment. When blood pressure rises and the vessel walls tighten, the pulse wave travels more quickly, so PTT gets shorter. When the vessels are relaxed and more elastic, the wave slows down, and PTT becomes longer. Because of this back-and-forth relationship, PTT gives researchers a simple, noninvasive way to track changes in vascular tone, blood flow dynamics, and autonomic nervous system activity.

PTT is determined by measuring the volume or pressure pulse at a proximal artery (such as the carotid or brachial) and at a distal artery (such as the finger or toe). To prevent confusion in PTT nomenclature across different methods, some researchers use labels formed from the first one or two letters of the starting and arrival signals. PTT-PP refers to PTT recorded using PPG between a proximal and a distal artery, PTT-EP refers to PTT measured between electrocardiogram (ECG) proximally and photoplethysmogram (PPG) distally and PTT-IP refers to PTT recorded between Impedance Cardiogram proximally and PPG distally.

PTT-EP is recorded by simultaneously recording ECG and PPG. PPG is usually recorded at the finger using a small infrared light to detect changes in blood flow with each heartbeat. As blood pulses into the area, the amount of light absorbed changes, creating a waveform with a clear rise and peak. To calculate PTT-EP, researchers measure the time between the ECG spike and a specific point on the PPG wave, typically the point at which the wave first rises or reaches its peak. Strictly speaking PTT-EP is not a true PTT as it includes pre-ejection period, a short delay between electrical activation of the ventricles and actual ejection of blood. For that reason, it is sometimes referred to as Pulse Arrival Time (PAT). Even so, the ECG-to-PPG approach remains widely used because it is noninvasive, reliable, relatively inexpensive, and straightforward to implement across a range of study designs.

Typical lab configurations focus on integrated, multimodal data acquisition systems that allow researchers to record ECG and PPG signals simultaneously using dedicated amplifier modules, with analysis performed via software. These systems enable precise channel synchronization, automated waveform feature detection, beat-by-beat PTT computation, and data export for statistical analysis. In some studies, researchers also integrate noninvasive blood pressure (NIBP) modules to directly examine the relationship between PTT and systolic or mean arterial pressure, strengthening the interpretation of vascular changes.

Obtaining high-quality PTT data requires attention to detail and careful planning. Participants should rest in a quiet, temperature-controlled room, since vascular tone can be affected by stress, ambient temperature, and sympathetic activation. Avoid testing immediately after meals or the consumption of caffeine or nicotine, which can alter cardiovascular dynamics. Proper sensor placement and stable contact pressure are critical for minimizing motion artifacts and waveform distortion. Consistent measurement timing, accounting for diurnal variation, helps ensure consistent data quality across sessions. Signal processing choices also matter. Careful filtering (see example study below), accurate event marking, and careful peak or foot detection are essential to ensure that the measured interval truly reflects physiological timing rather than processing artifacts.

When these best practices are followed, PTT becomes a versatile research tool. It has been used to study stress reactivity, autonomic regulation, arterial stiffness, posture-related hemodynamics, exercise physiology, sleep physiology, and the development of cuffless blood pressure estimation technologies. Recent studies illustrate both the promise and the practical considerations of PTT measurement.PTT Diagram
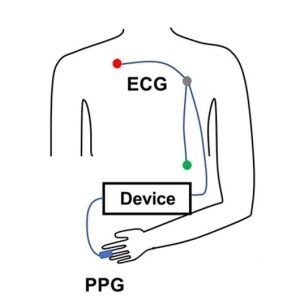
At the Georgia Institute of Technology, researchers explored whether noninvasive nerve stimulation applied at the ear, neck, or wrist could reduce acute stress responses in healthy young adults. During laboratory sessions that included mental arithmetic and cold exposure tasks, cardiovascular signals were recorded using a BIOPAC MP data acquisition unit and a PPG100C to capture ECG and fingertip PPG. PTT served as a key marker of sympathetic (“fight-or-flight”) activation. The research team found that stimulation at the ear and wrist significantly reduced stress-related cardiovascular changes compared to a sham condition, supporting the potential for wearable systems that integrate neuromodulation and real-time cardiovascular monitoring.

In another study published in Nature, researchers at Columbia University tackled a common problem in cuffless blood pressure monitoring: when wearable sensors sit above or below heart level, changes in arm position create hydrostatic pressure errors that skew estimates based on PTT. Cuffless systems frequently use PTT to estimate blood pressure, but arm movements can distort that timing and reduce accuracy. To investigate this, the team collected synchronized physiological data using a BIOPAC data acquisition system to record high-resolution ECG signals via a BIOPAC ECG amplifier and fingertip PPG signals via BIOPAC PPG100C, while a BIOPAC NIBP module measured reference blood pressure using upper-arm and finger cuffs. Participants also wore wrist and upper-arm inertial sensors (IMUs) to track how the arm was positioned relative to the heart. The research team then developed a method called IMU-Track, which uses motion data and deep learning to correct PTT for arm height effects, improving the accuracy of blood pressure predictions across different postures. Their findings showed that accounting for sensor position dramatically reduced errors in cuffless blood pressure estimation, suggesting that combining motion tracking with PTT measurements could make wearable BP monitoring more reliable in everyday use.

When applied correctly, PTT provides a potent, noninvasive tool for assessing cardiovascular function—one measured in milliseconds but capable of revealing meaningful physiological change. For more information on integrating PTT into research, see our PTT webinar.


If you are planning to use PTT in your next study, don’t hesitate to reach out for our highly capable team of experts for assistance in identifying the equipment and procedures to ensure your success.

Circumplex Model of Affect and Motivational State

By Alan Macy, BIOPAC Systems, Inc.

The Circumplex Model of Affect was first described in 1980 by James Russell. Affective states arise from the behavior of two independent neurophysiological systems, the arousal and valence systems. Affective states are a function of these two systems. The circumplex model is two-dimensional, with arousal and valence defined as orthogonal (perpendicular) axes. The arousal axis, plotted vertically, ranges from zero arousal to high arousal.The valence axis, plotted horizontally, ranges from negative to positive. Objective physiological indexes of affect or emotion are available. As valence examples, positive affect is indicated by increasing zygomaticus activity and negative affect is indicated by increasing corrugator activity. Physiological example indices for arousal include heart rate and electrodermal activity.

Perhaps even more fundamental to emotional state is the concept of motivational state. Motivational state is indexed by specific, bodily expressed, physiological states that can easily be measured. Motivational state is based on the concept of core relational themes, called “challenge” and “threat”.  During the course of living, humans relate to difficult environmental circumstances as a combination of challenge and threat. A challenge response is similar to the aerobic physiological response and involves increased stroke volume and cardiac output, unchanged or increased heart rate, decreased vascular resistance and relatively unchanged blood pressure. This response is indicative of efficient mobilization of available energy for coping with circumstances. A threat response is characterized by increased heart rate and blood pressure, increased or little changed vascular resistance, decreased or unchanged stroke volume and relatively unchanged cardiac output. A challenge response occurs when the subject experiences sufficient resources to meet circumstantial demands in a performance situation where goals are important. A threat response occurs when the subject experiences insufficient resources to meet those same circumstantial demands. If a circumstance is determined to be challenging, then subject performance is usually adequate. If a circumstance is determined to be threatening, then subject performance tends to worsen. Motivational state information can be used to better reflect objective differences between similar circumplex model defined emotions, such as anger and fear.

Electrodermal activity (EDA) is a physiological signal that indicates increased SNS activity. EDA is representative of changes in the electrical conductance of the skin due to eccrine (sweat) gland activity. SNS activity increases sweat gland secretions. Eccrine glands only receive activation signals from the SNS, so increased EDA is an indicator of increased arousal.

Skin temperature (SKT) changes are primarily driven by variations in blood flow. These local variations are mainly caused by changes in vascular resistance or arterial blood pressure. Local vascular resistance is modulated by smooth muscle activity, which is mediated by the SNS. SKT variation reflects SNS activity, and is an indicator of emotional state.  In particular, fingertip temperature is a marker for sympathetic induced changes in microcirculation.

Blood Volume Pulse (BVP), also referred to as the Pulse Plethysmogram (PPG), is reflective of variations in microcirculation. As vasculature resistance to flow increases, subject to increased SNS, microcirculation decreases. Accordingly a reduction in PPG (BVP) amplitude reflects increased SNS activity.

The heart and brain are connected bidirectionally via the vagus nerve. Vagal PsNS stimulation, from the brain, influences the heart via the sino-atrial (SA) node. Baroreceptor signals, from the heart, travel back along the vagus nerve to affect the brain. The SA node is the pacemaker of the heart. The SA node receives inputs from both the SNS and PsNS. The SA node can be considered to be a spike-train generator whose inter-spike (firing) interval is modulated by both SNS and PsNS activity levels. Because both SNS and PsNS activity influence SA node spike firing, heart rate behavior can be considered to be dependent on a range of emotional states. SNS activity increases heart rate and PsNS activity decreases heart rate.

Heart rate variability (HRV) is a measure of heart rate changes over time. HRV has a frequency range of 0.003 to 0.4 Hz and is considered to have four sub-bands:  HF, LF, VLF and ULF. High frequency HRV (HF-HRV) band power is in the range of 0.18 to 0.4 Hz and reflects primarily PsNS influences. HF-HRV band power reflects modulation of vagus nerve activity, as driven by respiration. This modulation is called respiratory sinus arrhythmia (RSA). Low frequency HRV (LF-HRV) band power is in the range of 0.05-0.15 Hz and appears to reflect both SNS and PsNS influences. Very low frequency HRV (VLF-HRV) band power is in the range of 0.003-0.05 Hz and may reflect cardiovascular disease, thermo-regulatory cycles and blood plasma renin activity. Ultra low frequency HRV (ULF-HRV) band power is in the range of DC-0.003 Hz and may reflect circadian rhythm activity.

PsNS influences occur over the LF and HF frequency ranges of HRV. SNS influences drop off at about 0.15 Hz and higher. PsNS influences can affect heart rate in a fraction of a second, but SNS influences can only affect the heart rate after a few seconds. Accordingly, PsNS influences are uniquely capable of producing high speed changes in the heart rate. PsNS innervation of the heart is controlled by the right vagus nerve via the SA node. PsNS induced changes in heart rate are associated with vagal nerve activity that is modulated by respiration. Expiration causes an increase in vagal nerve activity, so heart rate decreases. Inspiration causes suppression of vagal nerve activity, so heart rate climbs back up. This combined action is known as respiratory sinus arrhythmia (RSA). RSA is considered, in part, to be a marker for vagal control of heart rate and also for emotional regulation. Total HRV appears to be positively correlated with valence.

When attention increases, there is a short term deceleration of heart rate. Arousal is also correlated to a long term acceleration in heart rate. Heart rate also provides an indication of valence. Compared to neutral stimuli, both positive and negative stimuli first exhibit a short term decrease in heart rate. Over the long term, positive stimuli are correlated with an increase in heart rate while negative stimuli usually are correlated to a decrease in heart rate.

Respiratory activity occurs via periodic contraction and relaxation of respiratory muscles, including the diaphragm, intercostal and abdominal muscles. The motor outputs for controlling respiration are generated by efferent neurons in the spinal cord.  There are autonomic and voluntary breathing pathways to these respiratory-related efferent neurons. A variety of afferent (sensory) inputs influence respiratory rate and tidal volume in support of the body’s metabolic demands. SNS activity increases respiratory rate and PsNS activity reduces respiratory rate.

Several EEG studies suggest that emotional valence is linked to frontal lobe activation, typically indexed by alpha power. Positive valence is correlated to increased activation of  the left frontal lobe and negative valence is correlated to increased activation of the right frontal lobe.  Other studies have suggested that frontal lobe EEG activation asymmetry reflects the relative balance of motivational state, more so than emotional valence.  In this work, enhanced left frontal lobe activation predicted dispositional states towards challenge and enhanced right frontal lobe activation predicted dispositional states towards threat.

Artwork adapted from from Russell, J. A. (1980). A circumplex model of affect.Journal of Personality and Social Psychology, 39, 1161–1178.

For more information on BIOPAC’s wide range of tools for recording, displaying, classifying, and analyzing psychophysiological measurements—including EEG, ECG, EDA, PPG, and emotional states—visit BIOPAC’s applications pages and view BIOPAC’s full line of physiology data acquisition and analysis systems, electrodes, amplifiers, and wearable, wireless transmitters and loggers.

BIOPAC Systems, Inc. provides life science researchers and educators with data acquisition and analysis systems that inspire people and enable greater discovery about life. Visit us at www.biopac.com.


error: Content is protected !!