Dark Current Measurement as a Noise Management Tool

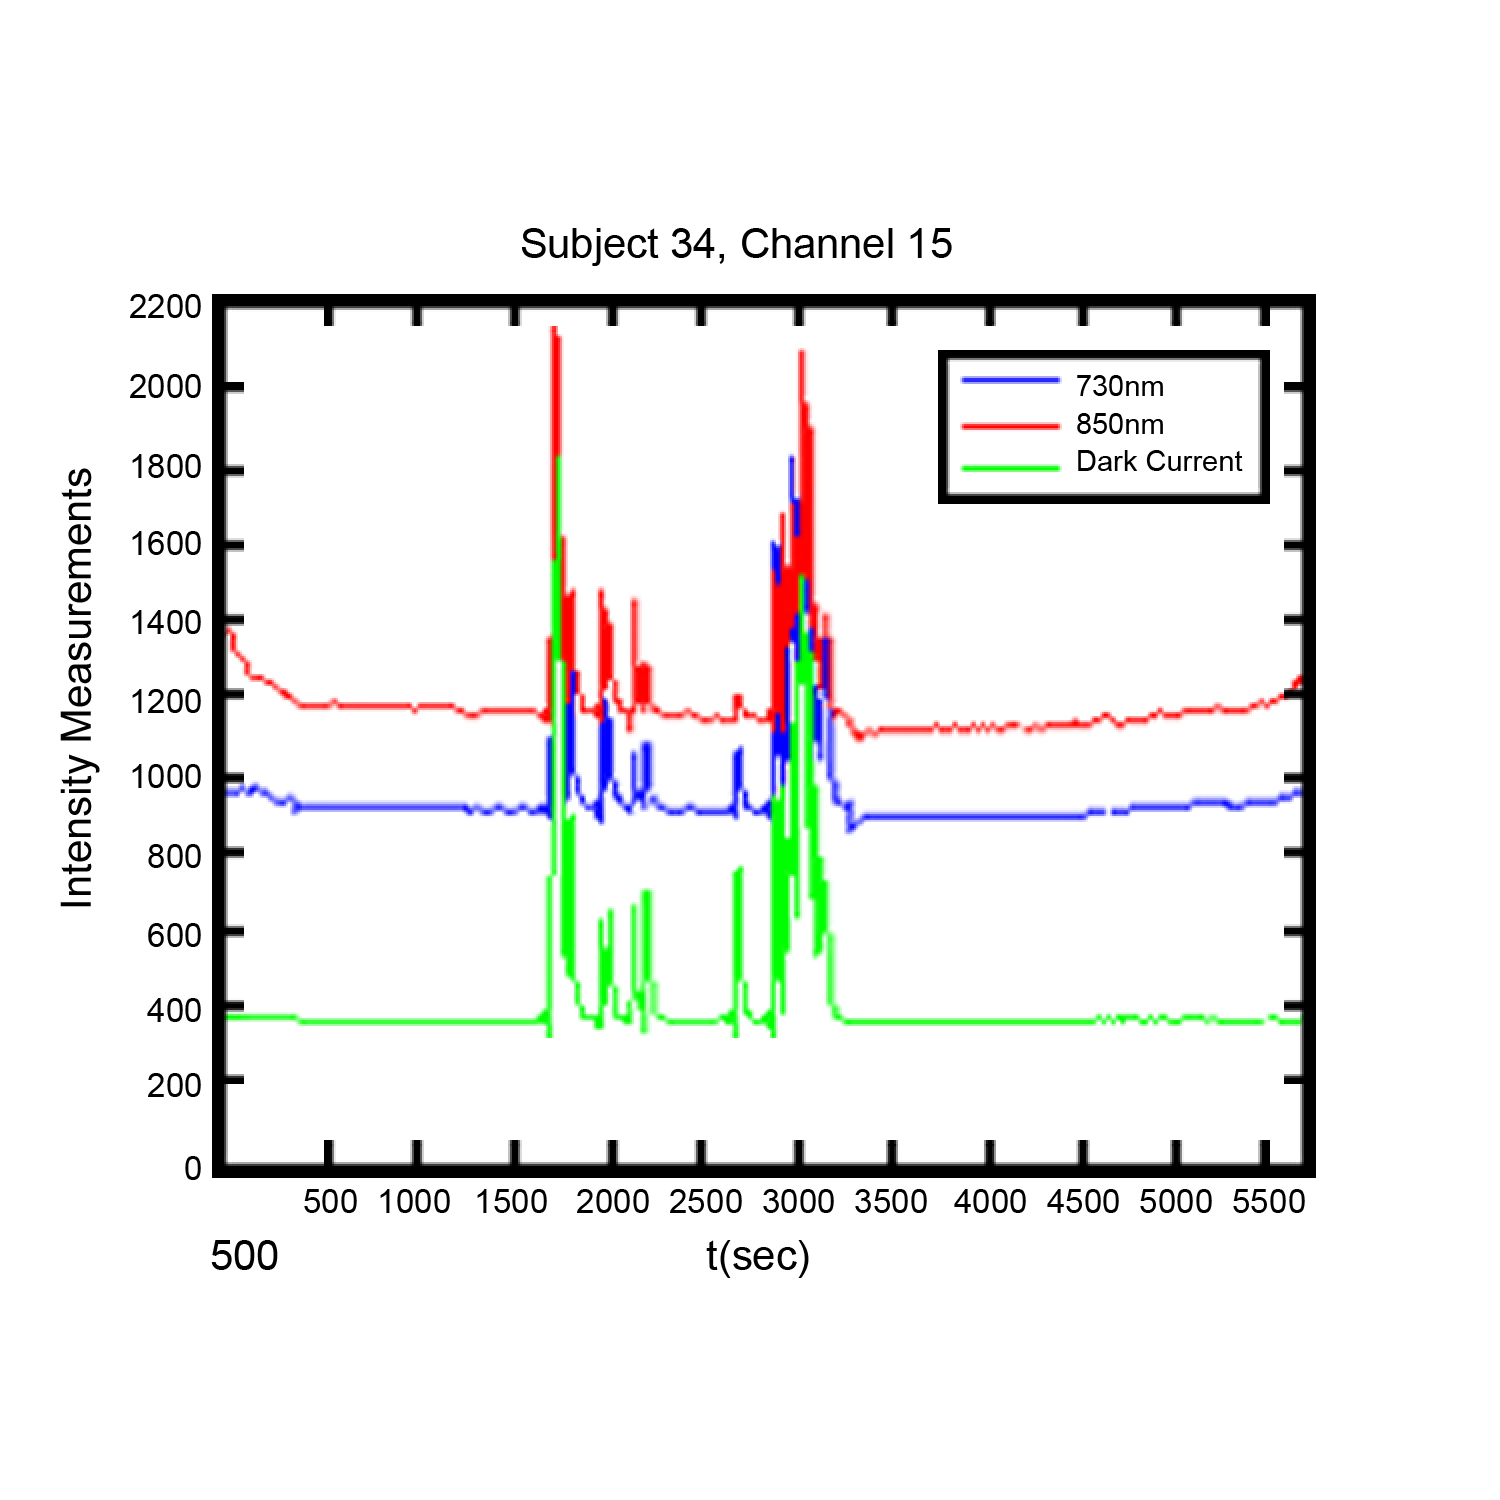
Noise in functional near infrared (FNIR) imaging data utilized for neurophysiological brain functioning research is a challenge to researchers, The use of dark current measurement in functional near infrared (fNIR) brain imaging can provide a valuable tool in identifying and managing certain type of noise in recordings.

By Davood Tashayyod, FNIR Devices

The use of dark current measurement in functional near infrared (fNIR) brain imaging (measurements taken not only when LED type light sources shine light at wavelengths 730 and 850 nm but also when they do not shine light (dark current condition)) can provide a valuable tool in identifying and managing certain types of noise in recordings.

Noise in functional near infrared (fNIR) imaging data utilized for neurophysiological brain functioning research is a challenge to researchers, in that excessive or unmanaged noise may pose a risk to the quality of gathered data and hence in the interpretation of the results. This noise arises from two general categories of sources, biological sources and non-biological sources. It should be noted that sources of noise are routinely present, so that noise cannot be eliminated but rather must be managed. Biological sources of noise include the respiratory and cardiac cycles and slow vasomotor oscillations. Non-biological sources of noise may include contamination from other external devices and noise induced by improper sensor application (light leakage, in the case of fNIR sensors), cable movements, or instruments or equipment used in the course of the experiment. These sources, independently or in combination, can mask the signals of interest.

Close attention to good laboratory practices, to include proper sensor placement, trial runs to establish baselines, and other techniques can help to reduce noise. Close attention to experiment protocols during the experiment can also be of assistance. However, it is in post-experiment data processing and analysis phases that the researcher has the greatest number of tools to manage noise. These tools include intuitive or visual analysis, filtering, and specialized analysis. Each method has strengths and weaknesses, but used in combination they offer a reliable method of managing noise and improving data quality.

Visual or intuitive analysis depends upon researcher experience and qualification, and some artifacts may be too small to be readily apparent. Filtering is useful, but in some range of measurements noisy data segments may be so great or may not contain any signal originated from the brain such as in the case when the sensor loses contact with the skin and captures data only from the ambient that it may not make sense to remove noise, rather such data segments should be identified and discarded.

Specialized analysis, such as dark current measurement, provide a very useful method for both identifying the noise not readily apparent to the naked eye and identifying data segments where filtering is likely to not be useful. A discussion of the use of dark current measurement can be found here.

For more information on optical braining imaging systems, visit BIOPAC’s fNIR page. BIOPAC also provides a wide range of tools for recording, displaying, classifying, and analyzing psychophysiological measurements—including EEG, ECG, EDA, PPG, and emotional states—visit BIOPAC’sapplications pages and view BIOPAC’s full line of physiology data acquisition and analysis systems, electrodes,amplifiers, and wearable, wireless transmitters and loggers.

BIOPAC Systems, Inc. provides life science researchers and educators with data acquisition and analysis systems that inspire people and enable greater discovery about life. Visit us at www.biopac.com.

Circumplex Model of Affect and Motivational State

By Alan Macy, BIOPAC Systems, Inc.

The Circumplex Model of Affect was first described in 1980 by James Russell. Affective states arise from the behavior of two independent neurophysiological systems, the arousal and valence systems. Affective states are a function of these two systems. The circumplex model is two-dimensional, with arousal and valence defined as orthogonal (perpendicular) axes. The arousal axis, plotted vertically, ranges from zero arousal to high arousal.The valence axis, plotted horizontally, ranges from negative to positive. Objective physiological indexes of affect or emotion are available. As valence examples, positive affect is indicated by increasing zygomaticus activity and negative affect is indicated by increasing corrugator activity. Physiological example indices for arousal include heart rate and electrodermal activity.

Perhaps even more fundamental to emotional state is the concept of motivational state. Motivational state is indexed by specific, bodily expressed, physiological states that can easily be measured. Motivational state is based on the concept of core relational themes, called “challenge” and “threat”.  During the course of living, humans relate to difficult environmental circumstances as a combination of challenge and threat. A challenge response is similar to the aerobic physiological response and involves increased stroke volume and cardiac output, unchanged or increased heart rate, decreased vascular resistance and relatively unchanged blood pressure. This response is indicative of efficient mobilization of available energy for coping with circumstances. A threat response is characterized by increased heart rate and blood pressure, increased or little changed vascular resistance, decreased or unchanged stroke volume and relatively unchanged cardiac output. A challenge response occurs when the subject experiences sufficient resources to meet circumstantial demands in a performance situation where goals are important. A threat response occurs when the subject experiences insufficient resources to meet those same circumstantial demands. If a circumstance is determined to be challenging, then subject performance is usually adequate. If a circumstance is determined to be threatening, then subject performance tends to worsen. Motivational state information can be used to better reflect objective differences between similar circumplex model defined emotions, such as anger and fear.

Electrodermal activity (EDA) is a physiological signal that indicates increased SNS activity. EDA is representative of changes in the electrical conductance of the skin due to eccrine (sweat) gland activity. SNS activity increases sweat gland secretions. Eccrine glands only receive activation signals from the SNS, so increased EDA is an indicator of increased arousal.

Skin temperature (SKT) changes are primarily driven by variations in blood flow. These local variations are mainly caused by changes in vascular resistance or arterial blood pressure. Local vascular resistance is modulated by smooth muscle activity, which is mediated by the SNS. SKT variation reflects SNS activity, and is an indicator of emotional state.  In particular, fingertip temperature is a marker for sympathetic induced changes in microcirculation.

Blood Volume Pulse (BVP), also referred to as the Pulse Plethysmogram (PPG), is reflective of variations in microcirculation. As vasculature resistance to flow increases, subject to increased SNS, microcirculation decreases. Accordingly a reduction in PPG (BVP) amplitude reflects increased SNS activity.

The heart and brain are connected bidirectionally via the vagus nerve. Vagal PsNS stimulation, from the brain, influences the heart via the sino-atrial (SA) node. Baroreceptor signals, from the heart, travel back along the vagus nerve to affect the brain. The SA node is the pacemaker of the heart. The SA node receives inputs from both the SNS and PsNS. The SA node can be considered to be a spike-train generator whose inter-spike (firing) interval is modulated by both SNS and PsNS activity levels. Because both SNS and PsNS activity influence SA node spike firing, heart rate behavior can be considered to be dependent on a range of emotional states. SNS activity increases heart rate and PsNS activity decreases heart rate.

Heart rate variability (HRV) is a measure of heart rate changes over time. HRV has a frequency range of 0.003 to 0.4 Hz and is considered to have four sub-bands:  HF, LF, VLF and ULF. High frequency HRV (HF-HRV) band power is in the range of 0.18 to 0.4 Hz and reflects primarily PsNS influences. HF-HRV band power reflects modulation of vagus nerve activity, as driven by respiration. This modulation is called respiratory sinus arrhythmia (RSA). Low frequency HRV (LF-HRV) band power is in the range of 0.05-0.15 Hz and appears to reflect both SNS and PsNS influences. Very low frequency HRV (VLF-HRV) band power is in the range of 0.003-0.05 Hz and may reflect cardiovascular disease, thermo-regulatory cycles and blood plasma renin activity. Ultra low frequency HRV (ULF-HRV) band power is in the range of DC-0.003 Hz and may reflect circadian rhythm activity.

PsNS influences occur over the LF and HF frequency ranges of HRV. SNS influences drop off at about 0.15 Hz and higher. PsNS influences can affect heart rate in a fraction of a second, but SNS influences can only affect the heart rate after a few seconds. Accordingly, PsNS influences are uniquely capable of producing high speed changes in the heart rate. PsNS innervation of the heart is controlled by the right vagus nerve via the SA node. PsNS induced changes in heart rate are associated with vagal nerve activity that is modulated by respiration. Expiration causes an increase in vagal nerve activity, so heart rate decreases. Inspiration causes suppression of vagal nerve activity, so heart rate climbs back up. This combined action is known as respiratory sinus arrhythmia (RSA). RSA is considered, in part, to be a marker for vagal control of heart rate and also for emotional regulation. Total HRV appears to be positively correlated with valence.

When attention increases, there is a short term deceleration of heart rate. Arousal is also correlated to a long term acceleration in heart rate. Heart rate also provides an indication of valence. Compared to neutral stimuli, both positive and negative stimuli first exhibit a short term decrease in heart rate. Over the long term, positive stimuli are correlated with an increase in heart rate while negative stimuli usually are correlated to a decrease in heart rate.

Respiratory activity occurs via periodic contraction and relaxation of respiratory muscles, including the diaphragm, intercostal and abdominal muscles. The motor outputs for controlling respiration are generated by efferent neurons in the spinal cord.  There are autonomic and voluntary breathing pathways to these respiratory-related efferent neurons. A variety of afferent (sensory) inputs influence respiratory rate and tidal volume in support of the body’s metabolic demands. SNS activity increases respiratory rate and PsNS activity reduces respiratory rate.

Several EEG studies suggest that emotional valence is linked to frontal lobe activation, typically indexed by alpha power. Positive valence is correlated to increased activation of  the left frontal lobe and negative valence is correlated to increased activation of the right frontal lobe.  Other studies have suggested that frontal lobe EEG activation asymmetry reflects the relative balance of motivational state, more so than emotional valence.  In this work, enhanced left frontal lobe activation predicted dispositional states towards challenge and enhanced right frontal lobe activation predicted dispositional states towards threat.

Artwork adapted from from Russell, J. A. (1980). A circumplex model of affect.Journal of Personality and Social Psychology, 39, 1161–1178.

For more information on BIOPAC’s wide range of tools for recording, displaying, classifying, and analyzing psychophysiological measurements—including EEG, ECG, EDA, PPG, and emotional states—visit BIOPAC’s applications pages and view BIOPAC’s full line of physiology data acquisition and analysis systems, electrodes, amplifiers, and wearable, wireless transmitters and loggers.

BIOPAC Systems, Inc. provides life science researchers and educators with data acquisition and analysis systems that inspire people and enable greater discovery about life. Visit us at www.biopac.com.
 

Filtering

There are a few basic filter types and many methods available to implement those types. Commonly used filters are: Lowpass, Highpass and Bandpass.

By Alan Macy, BIOPAC Systems, Inc.

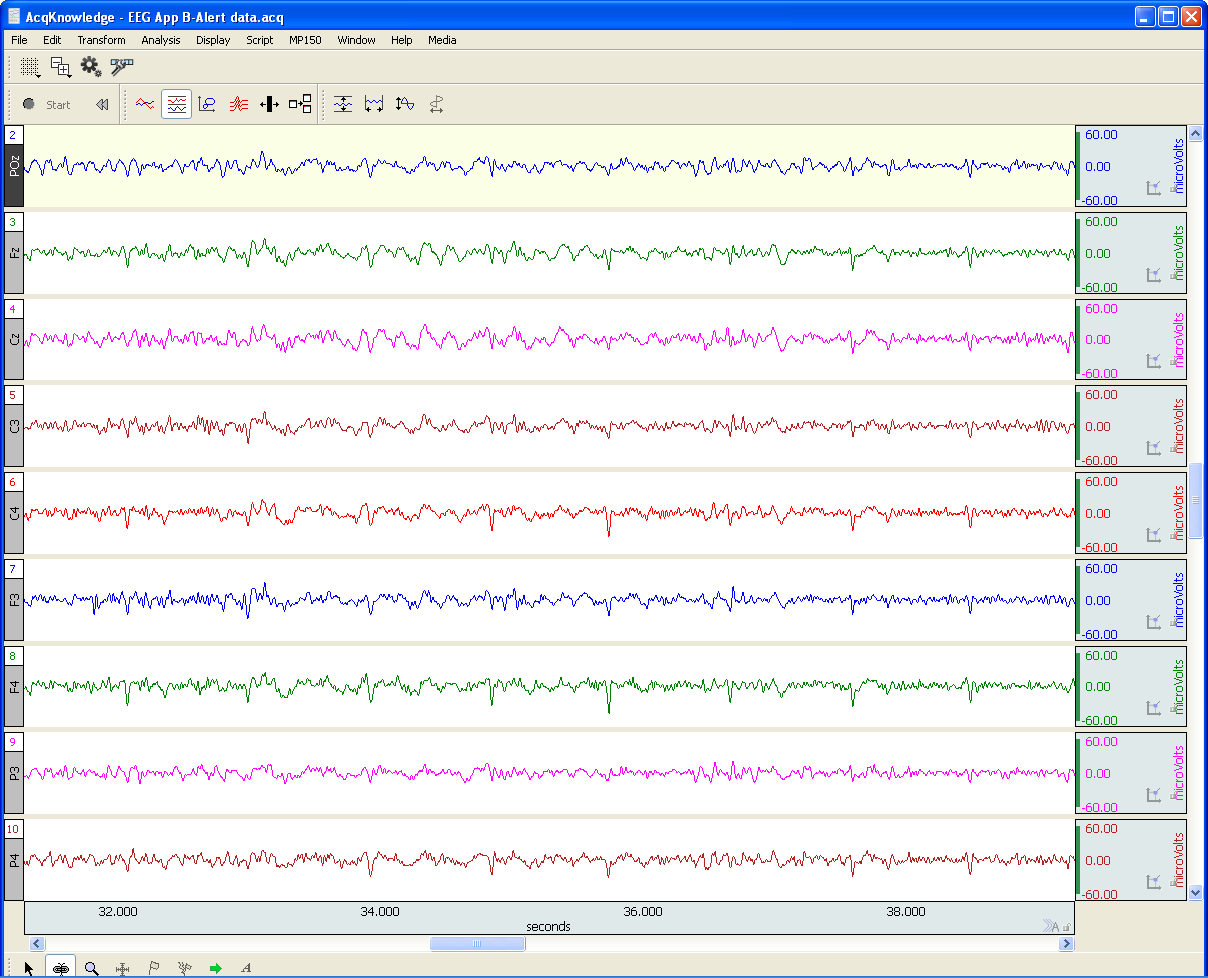
Filtering is a core signal processing function. Filtering is the act of discrimination between one type of data and another. In the case of physiological signal processing, filters are employed to attenuate undesired signal frequencies and emphasize others. There are a few basic filter types and many methods available to implement those types. Commonly used filters are: Lowpass, Highpass and Bandpass. In the case of a Lowpass filter (LPF), signal frequencies lower than the filter cutoff frequency are emphasized versus those higher than the cutoff frequency. For a Highpass filter (HPF), the signal frequencies higher than the filter cutoff frequency are emphasized versus those lower than the cutoff frequency. A Bandpass filter (BPF) has two cutoff frequencies, a low and high cutoff. In this case, signal frequencies between the filter cutoff frequencies are emphasized versus those lower then the low cutoff frequency and higher than the high cutoff frequency. All types of filters can be crafted as a combination of Lowpass, Highpass and Bandpass filters. For example, a comb filter can be constructed from a cascaded series of Bandpass filters.

Filters can be implemented as analog or digital. Analog filters are physically realized using electrical components, such as resistors, capacitors, inductors, delay lines and operational amplifiers. Digital filters are implemented as an algorithm, which may reside in a computer, embedded microprocessor or digital signal processor. Digital filters require the signal data to be digitized, prior to processing. An analog to digital converter is used to convert time-varying signal data into a sequential string of proportional numbers. Digital filters process this input string of numbers to generate an output string of numbers. This output string of numbers can then be converted back into a time-varying signal through the use of a digital to analog converter.

Analog filters can be reasonably well-emulated by the combination A/D converter > Digital Filter > D/A converter. In the case of physiological measurements, it’s most common to employ analog to digital converters to direct the signal data straight to the computer. Once in computer memory, digital filters can be applied to the data to extract the signals of interest.

There are two popular algorithms used to implement digital filters, Finite Impulse Response (FIR) and Infinite Impulse Response (IIR). Both FIR and IIR filters incorporate delay elements, multipliers and a summing junction, however FIR filters don’t use feedback and IIR filters do use feedback. Feedback in an IIR filter means that some portion of the filter’s output is introduced back to the filter’s input. Assuming a perfect IIR filter, the recursive process implies that any input signal to the filter will have a residual influence on the output of the filter for an arbitrary period of time. This is why feedback or recursive filters are called infinite impulse response filters. An impulse applied to an IIR filter will produce a response that lasts for eternity. In practice, however, the impulse response of IIR filters will ultimately drop to a value range which can no longer be properly characterized by the significant digits employed during processing. Accordingly, the effective impulse response of IIR filters remains finite.

An FIR filter does not incorporate feedback or recursion into its design. This type of filter pushes the signal data through the filter in just one direction. In order to make an effective FIR filter, typically many internal filter stages are needed. A FIR filter stage consists of a delay element combined with a multiplier element. A 101 stage FIR filter will have 101 sequential delay stages and 101 multiplier stages. The multiplier stages sample the data present after each delay stage and multiplies the sensed value by some predefined constant, called a coefficient. The multiplier stage outputs are all summed together to create the FIR filter output.

Because IIR filters are recursive and FIR filters are non-recursive, they differ in important ways. If not properly designed, IIR filters can be unstable. Instead, no matter how an FIR filter is designed, it’s inherently stable. IIR filters do not have perfectly linear phase, even if they can be designed to have reasonably linear phase in regions of interest. FIR filters can have perfectly linear phase. Linear phase means that the filter will delay all frequencies by the same time period. This time delay is known as group delay. Linear phase filters can faithfully mimic the essential shape of complex input waveforms, whereas non-linear phase filters may introduce certain distortions to the shape of an input waveform. Because of similarities in topology, certain types of IIR filters are well-suited to emulate certain analog filters. Because analog filter design methods are very advanced and well-documented, this topological similarity allows analog design methods to be transposed to the digital domain. For example, common analog or digital IIR filter can both implement a transfer function defined by a ratio of biquadric functions. These filters are known as biquads or second order filters. When designing a biquad IIR filter, the biquad analog transfer function is converted to digital form via a substitution process called the bilinear transformation.

For more information on BIOPAC’s wide range of tools for recording, displaying, and analyzing EEG measurements and filtering data from human and animal subjects, visit BIOPAC’s filtering or electroencephalography pages, and view BIOPAC’s full line of electrodes, amplifiers, and wearable, wireless transmitters and loggers.

BIOPAC Systems, Inc. provides life science researchers and educators with data acquisition and analysis systems that inspire people and enable greater discovery about life. Visit us at www.biopac.com.

Electrocardiography (ECG)

Electrocardiography (ECG) is a graph of electrical activity of the heart (cardiac) muscle as it changes over time. The basic principle of the ECG is that periodic waves of propagated electrical stimulation cause cardiac muscle to alternately contract and relax.

By Alan Macy, BIOPAC Systems, Inc

Electrocardiography (ECG) results in a graph of electrical activity of the heart (cardiac) muscle as it changes over time. Cardiac muscle contracts in response to electrical depolarization of the heart muscle cells. The ECG is the measured sum, over time, of this electrical activity as it is recorded from electrode connections.

Willem Einthoven’s contribution to ECG recording technology was the development of the string galvanometer that had improved sensitivity over the capillary electrometer. In 1908, Willem Einthoven published a description of a medically useful ECG recording system. This ECG system employed a specific lead connection method presently known as the Einthoven lead system. The Einthoven lead vectors are based on the assumption that the heart is located in a conductive volume. The Einthoven lead vectors are defined as:

Lead I: LA – RA

Lead II: LL – RA

Lead III: LL – LA

Where:

LA is Left Arm

LL is Left Leg

RA is Right Arm

The basic principle of the ECG is that periodic waves of propagated electrical stimulation cause cardiac muscle to alternately contract and relax. These electrical stimulation waves are transmitted from cardiac muscle cell to cell via gap junctions that connect between the cells. The electrical waves spread through the cardiac muscle cells because of cascaded changes in ions between intracellular and extracellular fluid. When the cardiac muscle cells are in a resting (polarized) state, the insides are negatively charged compared to the outsides. Cell membrane pumps maintain this electrically polarized state. Contraction of cardiac muscle is triggered by depolarization. Following depolarization, the cardiac muscle cells return to their resting charge. This process is called repolarization. These waves of depolarization and repolarization result in a changing electrical potential and can be detected by placing electrodes on the surface of the body.

The normal cardiac cycle begins with spontaneous depolarization of the sinoatrial (SA) node, a small volume of specialized tissue located in the right atrium. The SA node sets the rate of the heartbeat. The SA generated wave of electrical depolarization then spreads through the right atrium and across the inter-atrial septum into the left atrium causing the atria to contract. This contraction pushes blood into the ventricles. The atria are separated from the ventricles by a ring of non-conductive tissue. Accordingly, the only conductive path of electrical depolarization, from atria to ventricles, is through the atrioventricular (AV) node. The AV node is a cluster of cells in the center of the heart between the atria and ventricles. The AV node is a pathway that slows the electrical depolarization wave before it enters the ventricles. The wave of depolarization travels down the interventricular septum, through the His-Purkinje fiber network, to the left and right ventricles. The AV node delay gives the atria time to contract, before the ventricles do, to establish robust pumping action. In addition, with normal conduction, the two ventricles contract simultaneously to further maximize cardiac performance. After a volume of cardiac muscle cells depolarizes, the cells repolarize for the next cardiac cycle.

The net (average) path of electrical depolarization, through the heart, is known as the electrical axis. A fundamental ECG measurement principle is that when the wave of electrical depolarization travels toward a recording lead, this results in a positive voltage on that lead. When the wave travels away from a recording lead this results in a negative voltage on that lead. During repolarization, net wave activity towards or from a recording lead results in the opposite polarity as compared to depolarization.

The nature of the repolarization wave is different, from that of the depolarization wave, in that repolarization is not a propagating phenomenon. Cardiac muscle cell repolarization only occurs after the depolarization action potential duration, so cell repolarization does not depend on the repolarization of an adjoining cell. Assuming the action potential of all cells have equal duration, the repolarization wave would follow the same sequence as depolarization wave. However, in considering the entire extent of cardiac muscle, action potential duration is not identical between cells.

Meaning of ECG waves –

P wave: Depolarization of the right and left atria

QRS complex: Depolarization of the ventricles

T wave: Repolarization of ventricles

Meaning of ECG intervals –

PQ interval: Time period between start of atrial depolarization to start of ventricular depolarization

QRS duration: Time period of ventricular depolarization

QT interval: Time period between start of ventricular depolarization and end of ventricular repolarization

RR interval: Time period of complete cardiac cycle (inverse of heart rate).


For more information on BIOPAC’s wide range of tools for recording, displaying, and analyzing ECG measurements from human and animal subjects, visit BIOPAC’s electrocardiograpy, epages and view BIOPAC’s full line of electrodes, amplifiers, and wearable, wireless transmitters and loggers.

BIOPAC Systems, Inc. provides life science researchers and educators with data acquisition and analysis systems that inspire people and enable greater discovery about life. Visit us at www.biopac.com.
Ensuring Error-free NIBP Measurements & Accurate Data

Correct subject set-up of upper arm cuff, CNAP® NIBP finger sensor and CNAP® controller is essential to ensure accurate data reading and collection of continuous blood pressure and hemodynamics with the NiBP 100D throughout the measurement.

By Dr. Jürgen Fortin, CEO, CNSystems

The NIBP100D provides proven accuracy for blood pressure and, using the  NIBP100-HD, full hemodynamics with validation in a number of settings and against research and clinical gold standards. Subject setup with the NIBP100D upper arm cuff and reusable finger sensor is extremely easy, however, please keep the following practical tips in mind to ensure accurate data collection:

1. Upper arm Cuff: Sizing and placement

Over the years, upper arm cuffs have become a standard measurement in basic research setup providing brachial pressure intermittently (timed intervals) rather than continuously (for every heart beat).

The NIBP100D has an upper arm cuff (Suntech Medical) integrated to provide calibration for the continuous finger sensor. For accurate calibration please mind the following steps:

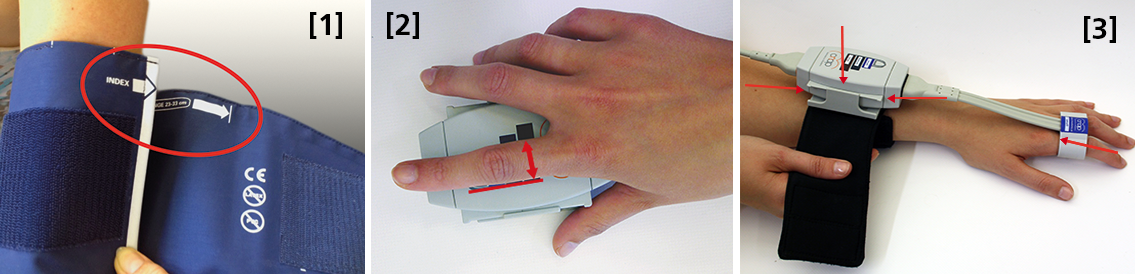
 Size: using a too small or too big upper arm cuff can lead to significant over- /or under- reading of blood pressure. Always ensure you choose the right size ( four sizes are provided with the NIBP100D) by using the range marker on the inside of the cuff–see image #3 in the photo above or review setup procedures here:

  • When wrapping the cuff around the upper arm before fixing the Velcro, ensure the white “index” arrow points into the indicated range area. If it does not, use the bigger or the smaller cuff! 
  • Placement: always align the artery marker (white arrow) on the cuff with the brachial artery (in the crook of the arm). The cuff can be placed ipsilaterally or contralaterally to the arm with the CNAP finger sensor on.
  • Wrapping: pull the upper arm cuff so tight that you could still get about 2 fingers under the wrapped cuff (air volume).

SunTech has developed a short video on the basics of measuring blood pressure. Although designed for a clinical audience, the video provides good information for researchers. Watch the SunTech NBP training video here.

2. CNAP finger sensor: Sizing and placement

Using a too small or too big finger sensor cuff can distort the continuous blood pressure readings. Avoid placing the sensor on finger joints, which may lead to a poor or even no signal. 

Size: Choose the right size from three different sizes by using the size indicator on the top of the CNAP Controller:

  • Put the proximal phalanx of the index finger on the indicator align with the grey line on the left. Choose the sensor size indicated on the shortest bar which is still visible.
  • Always use the larger sensor if you are in doubt about the size.
  • In some subjects it may be difficult to place the finger sensors on the proximal limb (i.e. finger-arthrosis, too short finger joints). In these cases, try placing the finger sensors on the middle limbs. However, make sure that the sensors are not placed over the finger joints. Hold the sensor in place or use medical tape until the sensor is inflated (start of measurement).

With the CNAP Software V5.2, sensor sizing becomes even easier—the size of the finger sensor is checked automatically upon start and the software gives notice if it does not fit. 

  • Placement: The finger sensor is placed on two neighboring fingers and slid back fully to the proximal limb!
  • Make sure not to place them on the finger joints!

3. CNAP Controller:  correct placement

The slide for the CNAP Controller allows for slight hand movement without dislocating the CNAP finger sensor. It is very important that the CNAP Controller is correctly placed:

  • Placement: Make sure that the CNAP Controller is placed in central position of the slide.
  • If the CNAP Controller is not placed correctly, the CNAP finger sensor might be pushed forward on the finger joints. 
  • View detailed pictures of CNAP Monitor Set Up Overview here.

4. Further recommendations

4.1. Start of measurement

  • Make sure that the subject keeps still and does not move his/her hand.
  • Do not change body posture during until a continuous signal is displayed!

4.2. Improving signal quality if signal is poor

  • Warm up fingers to improve blood flow (cover hand, hold hand in warm water prior to measurement, use disposable exam glove)
  • Check position of CNAP finger sensor: the sensor must not be placed on the finger joints.
  • Check if CNAP finger sensor size is correct.
  • Try to measure on the other hand.

4.3 Manual calibration with NBP

  • Trigger a manual NBP after moving or repositioning the subject/the subject’s hand or whenever hydrostatic change/offset happens.
  • Trigger a manual NBP whenever you feel that an update to the NBP reading may be beneficial
  • Triggering a manual NBP is possible at any time and in any mode. 
  • Additional information—view the CNAP NIBP100D operator’s manual here.

4.4 Removal of CNAP finger sensor

  • Do not remove the CNAP finger sensor when a measurement is still in progress. Stop measurement first, then remove the sensor!

 4.5. Battery

  • Never completely discharge the battery.
  • Immediately connect to power supply if battery charge status is below 25%.

To read a recent study which evaluated the agreement of the continuous noninvasive cardiac output measurements by CNAP in comparison with cardiac output measurements obtained invasively using transpulmonary thermodilution (TDCO), go here.

The NIBP100D provides validated, proven accuracy for blood pressure and, with the NIBP100-HD model, full hemodynamics. To ensure the acquisition of good data and accurate readings, researchers should follow the setup procedures outlined above.
For more information on BIOPAC’s Noninvasive Blood Pressure monitoring and measurement systems and advanced functionality in the area of cardiovascular hemodynamics, to include CNAP noninvasive blood pressure systems, visit BIOPAC’s NIBP page or view BIOPAC’s NIBP amplifiers (small animal applications are also supported) and related equipment for a wide variety of research applications.

BIOPAC Systems, Inc. provides life science researchers and educators with data acquisition and analysis systems that inspire people and enable greater discovery about life. Visit us at www.biopac.com.

Electrodes for Physiological Recording

By Alan Macy, BIOPAC Systems, Inc.

In the context of human physiological recording, an electrode is a conductive probe which is used to sense the presence of biopotentials arising at points in the body. When biopotentials are generated in the body, they can be sensed using a differential voltage amplifier. When a biopotential source activates, electrons are moved within the volume of the source thus creating a voltage potential difference (positive to negative) across the volume of the source. Biopotential sources are continually changing in the body, so the associated differential voltage potentials change too.

Electrodes establish an equipotential area when attached to a location on or in the body. An equipotential area means that anywhere on the surface area of the electrode the potential (voltage) will be the same. This is because electrodes are substantially more conductive than the surrounding tissue. To record a biopotential signal, two electrodes are required. The pair of electrodes will measure the voltage which is impressed between the two equipotential areas created by the electrodes.

Biopotential recording electrodes are of two types, namely invasive and noninvasive. Invasive electrodes are designed to sense biopotentials inside the body, meaning they are inserted inside the body, past the skin boundary. Historically, invasive electrodes have been designed as needles or wires to better penetrate the skin. By controlling the conductive and insulating areas of the needle or wire, the electrode can be used to sense biopotentials originating at any depth in the body volume. If the invasive electrode is to be inserted into the body for a long time, then the electrode might take a different shape, such as a conductive disk which can be sutured into place.

Noninvasive electrodes are designed to sense biopotentials which manifest on the outside skin surface. These kinds of electrodes do not penetrate the skin surface layer. Because the body is a volume conductor, biopotentials originating anywhere in the body travel to the entire skin surface area. As an example, a polarized biopotential wave is generated by the heart during the course of each beat. This signal is easily detectable between any two locations on the body’s skin surface that are physically oriented to different sides of the heart.

In practice, it’s best to collect biopotential data as near to the biopotential generating site as possible for the best recording. This is because the body generates a large number of biopotential signals, sourced from a variety of excitable cells. Because the body is conductive, a myriad of these signals will superimpose at any body recording location. As the distance grows between a particular source and the differential recording location, the source signal attenuates. Sources, that are subject to a range of attenuation, will simply add to the desired signal being measured, as they are included in the volume conduction path defined by the differential biopotential recording.

When collecting biopotential data from surface electrodes, the contact area of the electrode has an impact on the frequency and amplitude components recorded in the biopotential. Because the body volume is relatively conductive, increased electrode surface area has a tendency to reduce biopotential amplitudes and suppress higher frequency components. This happens because multiple, and often uncorrelated, biopotential sources in the body can act in random opposition as the various biopotentials superimpose in the conductive body volume and then express on the skin surface. A biopotential averaging process takes place in the body tissue volume and an aspect of the averaged signal is reflected on the skin surface area. This biopotential signal averaging quality increases in scope as the size the measurement surface electrodes increases.

If a biopotential electrode is reduced in size and then inserted into the body near the location of interest, then measured signals will typically increase in amplitude and frequency components. These kinds of electrodes are called needle or wire electrodes and typically have an insulating needle shaft with a conductive tip. Despite certain benefits of needle electrodes, complications can arise when breaking the skin barrier and inserting foreign objects into a subject’s body. Needle electrodes can be difficult to use because they have smaller surface area than surface electrodes. Furthermore, smaller contact surface area always means that the electrode contact impedance is higher. Very high contact impedance, typically in excess of 1 Mohm, specifies the need for excellent lead shielding and specialized input amplifier characteristics.

Biopotential measurements from surface electrodes on the body have material harmonic content of less than 500 Hz. Nearly all of the signal power which can be collected from surface electrodes is between DC and 500 Hz. If the electrode is smaller, such as a conductive-tipped needle, and inserted through the skin surface to near the biopotential of interest, biopotential signal frequencies can exceed 10,000 Hz.

For more information on BIOPAC’s wide range of tools for recording, displaying, and analyzing biopotential measurements from human and animal subjects, visit BIOPAC’s electrocardiograpy, electromyography,  or electroencephalograpy pages and view BIOPAC’s full line of electrodes, amplifiers, and wearable, wireless transmitters and loggers.

BIOPAC Systems, Inc. provides life science researchers and educators with data acquisition and analysis systems that inspire people and enable greater discovery about life.  Visit us at www.biopac.com.

Electroencephalography (EEG) Pt. 2

Short-term Electroencephalography or EEG measurements are typically performed in synchrony with well-controlled, environmental, stimuli. Signal-averaging measurements, of this type, are known as Event Related Potentials (ERPs).

By Alan Macy, BIOPAC Systems, Inc.

This blog is a continuation of the previous discussion of Electroencephalography or EEG. Short-term Electroencephalography or EEG measurements are typically focused on the nature of cognition. These types of recordings are typically performed in synchrony with well-controlled, environmental, stimuli. Signal-averaging measurements, of this type, are known as Event Related Potentials (ERPs). There are a range of ERP signals, stretching between 50 ms to many seconds, with respect to the occurrence of the event. ERPs require signal averaging methods, to be observed, because their amplitude levels (0.2-2 uV) are usually lower than the ambient EEG signal level.

ERPs can be generated by a wide range of stimuli. The stimulus event can be targeted to any specific human sense or combination of senses (auditory, visual, olfactory, touch or taste). ERPs indicate the superimposed potentials of neuronal activity that synchronously generate when a subject processes sensory information. There are two general types of human subject ERPs. Early ERP wave components occur before 100 milliseconds after the stimulus. Late ERP components occur after 100ms after the stimulus. Early ERPs are known as exogenous potentials and late ERPs are known as endogenous potentials. Exogenous potentials depend on neuronal sensory structure responses that occur prior to cognition.  Endogenous potentials depend on cognitive responses to the sensory stimuli.

Slow Cortical Potentials (SCPs) are a class of ERPs that are characterized by slowly-moving, stimulus-related changes in the EEG signal. SCPs originate in cell concentrations in the top cortical layer of the brain. SCP waves (0.01-3 Hz) are EEG signals that occur before and after stimulus presentation. They encompass such pre-stimulus measures as Contingent Negative Variation (CNV) and Readiness Potential (RP).  The CNV is a slow-changing negative potential that happens between an initial warning and a “go” stimulus.  NV amplitude depends on the subject’s expectation of an imagined, forthcoming event. The RP is associated with the beginning of movement.  The RP precedes movement and is identified as a slow-changing negative potential that maximizes with movement onset. The RP is observed when signal averaging the EEG, from the motor cortex, synchronously with movement.

EEG can be useful to:

  • Monitor alertness and conscious states
  • Evaluate inhibitory control over behavior
  • Locate areas of neural damage
  • Establish levels of cognitive engagement
  • Investigate brain disorders, such as Alzheimer’s, epilepsy and seizures
  • Establish brain / computer interfaces
  • Monitor sleep

For more information on BIOPAC’s wide range of tools for recording, displaying, and analyzing EEG signals from human and animal subjects, including automated EEG analysis, seizure detection, evoked responses and many others, visit BIOPAC’s EEG Analysis page or view BIOPAC’s full line of electrodes, amplifiers, and wearable, wireless transmitters and loggers.

BIOPAC Systems, Inc. provides life science researchers and educators with data acquisition and analysis systems that inspire people and enable greater discovery about life.  Visit us at www.biopac.com.

Electroencephalography (EEG) Pt. 1

An EEG recording can be short or long-term. Shorter-term, signal-averaged, EEG measurements are typically used to evaluate precognitive and cognitive processes with respect to specific stimuli.

by Alan Macy, BIOPAC Systems, Inc.

EEG or Electroencephalography is the measurement of differences in electrical potential (voltage) between points on the scalp. These voltages differences are the result of ionic current flow within neurons, and glial cells, in the brain. The measured scalp voltages are primarily in the 200 nV-200 uV amplitude range, 0.01 Hz – 100 Hz frequency range, and are typically simultaneously recorded at multiple sites on the scalp. The EEG is usually collected using the 10-20 electrode montage. This arrangement of electrodes typically references left or right hemisphere electrodes to the left or right earlobe (or mastoid), respectively. However, a wide range of signal referencing methods are used depending on the situational requirements.

An EEG recording (knows as an electroencephalogram) can be short or long-term. Shorter-term, signal-averaged, EEG measurements are typically used to evaluate precognitive and cognitive processes with respect to specific stimuli. These EEG signals have relatively low amplitude levels, typically 200 nV – 2 uV, so signal averaging methods are required to discern these signals from background concurrent EEG sources. Longer-term, non-signal-averaged, EEG measurements are used to discern the subject’s, real-time, conscious state. Different and observable wave rhythms are evident during such recordings. Commonly observed rhythms include: Delta, Theta, Alpha, Beta and Gamma waves. These waves can be continuously recorded and are in the range of 2 uV – 200 uV.

Delta waves (0.5-4 Hz) are considered slow rhythms and tend to be the highest in amplitude. Delta waves are normally the dominant rhythm in infants. Delta waves are found in sleeping adults and consistent Delta is considered abnormal in conscious adults.  Delta waves are low-frequency EEG patterns that increase during sleep in the normal adult.  Although Delta waves are generally prominent during sleep, there are cases when Delta rhythms are recorded from awake individuals. Delta waves may increase during difficult mental activities requiring concentration and other continuous-attention tasks. Delta rhythms depend on activity of motivational systems, in the brain, and participate in the identification of prominent phenomena.  The presence and amplitude of Delta rhythms are highly variable within and between individuals.

Theta waves (4-8 Hz) are considered slow rhythms. Theta waves are normal in children up to 13 years old.  Theta waves are found in sleeping adults and consistent Theta is considered abnormal in conscious adults. Theta rhythms are low-frequency EEG patterns that increase during sleep in the normal adult. Although Theta rhythms are generally prominent during sleep, there are cases when theta rhythms are recorded from awake individuals.  Theta rhythms are involved in memory and emotional regulation. Theta waves will spike during emotional responses to frustrating events or situations.  Theta waves are associated with the inhibition of elicited responses, in that Theta activity has been found to temporarily increase when a person is actively trying to repress a behavioral response. The presence and amplitude of theta rhythms are highly variable within and between individuals.

Alpha waves (8-13 Hz) are considered moderate rhythms and usually seen in the occipital regions of the head and are higher in amplitude on the dominant side. Alpha waves appear when relaxing and closing the eyes. Alpha waves are suppressed when opening the eyes or coming to an alert state. Alpha waves are the primary rhythm observed in relaxed adults and are present during most of life after 13 years old. Each region of the brain has a characteristic Alpha rhythm amplitude and the largest Alpha waves are from the occipital and parietal regions of the cerebral cortex. Alpha rhythms correlate with inhibitory processes in the brain. Reduced Alpha wave occurrence and amplitude, in relation to Delta-Theta activity, is associated with reduced inhibitory control over behavior.

Beta waves (13-30 Hz) are considered fast rhythms. Beta waves are typically observed on both sides of the head and are most evident frontally (executive function). Beta waves may be substantially reduced in areas of cortical damage.  Beta waves are considered normal and are the dominant rhythm in subjects whose eyes are open or are otherwise attentive to external stimuli or exerting specific mental effort. Beta rhythms also occur during rapid eye movement (REM) sleep. In this situation, the typical Alpha rhythm is suppressed and supplanted by Beta waves. This replacement of Alpha rhythm is called desynchronization, or “Alpha block”, because it represents a change in the synchronized activity of neural systems in the brain. It is thought that Beta waves represents arousal of the cortex to a higher state of alertness and may also be associated with memory retrieval.

Gamma waves (30-100 Hz) are considered fast rhythms. Gamma waves are present during mixed sensory processing, such as perceptual tasks that combine hearing and seeing. Gamma waves are also evident during short-term memory matching of recognized sights, sounds or sensations. A reduction in Gamma wave activity might be associated with cognitive decline, especially when compared to Theta wave activity levels.

Long-term EEG signal characteristics are related to consciousness. As conscious activity increases, the dominant EEG rhythms shift to higher frequencies. When asleep, with the exception of REM, the dominant EEG rhythms move to lower frequencies.  In deep sleep, the EEG is characterized by low frequency Delta waves.

This blog is continued in Part 2.

For more information on BIOPAC’s wide range of tools for recording, displaying, and analyzing EEG signals from human and animal subjects, including automated EEG analysis, seizure detection, evoked responses and many others, visit BIOPAC’s EEG Analysis or view BIOPAC’s full line of electrodes, amplifiers, and wearable, wireless transmitters and loggers.

BIOPAC Systems, Inc. provides life science researchers and educators with data acquisition and analysis systems that inspire people and enable greater discovery about life.  Visit us at www.biopac.com.

CNAP HD: Noninvasive Hemodynamic Monitoring in Research

Cardiac Output (CNCO® ) and further essential hemodynamic parameters calculated from the continuous non-invasive arterial pressure curve (CNAP®) by means of the Pulse Contour Analysis shows high accuracy and high trending ability (precision) compared to invasive clinical standards (e.g. thermodilution and PiCCO) with valuable benefit for scientific and clinical research.

By Dr. Jürgen Fortin, CEO, CNSystems

Pulse Contour Analysis (PCA) for deriving complete Hemodynamics from continuous blood pressure wave (CNAP)

Pulse Contour Analysis (PCA)[1] derives important physiological information on preload, contractility, afterload and compliance of the heart from the well validated CNAP® Continuous Noninvasive Arterial Pressure Curve[2],[3]. By adding biometric patient data Stroke Volume (SV) and therefrom Continuous Noninvasive Cardiac Output (CNCO®), both essential hemodynamic markers, are calculated. Further hemodynamic parameters such as Systemic Vascular Resistance (SVR) as well as all indexed values SI, CI or SVRI are derived completing the hemodynamic picture.

Validation: CNCO® is clinically validated against invasive methods

Non-invasive continuous CNCO® is the non-invasive continuous cardiac output calculated from CNAP® Arterial Pressure as described above.

Accuracy of CNCO® compared to clinical standards such as invasive thermodilution (TD) or PiCCO is expressed as percentage error. In 1999, Critchley and Critchley suggested a percentage error of 30% or less[4]. In clinical practice, however, percentage errors of 40-45% are more realistic for the interchangeability between two CO-measurement methods (meta-analysis by Peyton and Chong[5]).

Trending ability is the precise tracking of changes in CO. According to Critchley, Lee and Ho, reliable trending ability[6] is indicated by concordance rates of > 90%. Vincent and colleagues state that following hemodynamic trends may be more important than absolute values[7].

CNCO® shows both high accuracy as well as high trending ability (precision) compared to the invasive clinical standards thermodilution and PiCCO fulfilling all Critchley criteria:

Bland-Altman plots show

  • Small bias and narrow limits of agreement
  • Percentage errors ≤ 30% (according to strict Critchley standard [8],[9])
  • Concordance rates ≥ 90% (according to standard [10])

Read more on CNAP accuracy here and here.

Benefit of continuous BP, CO & SVR in research (examples)

Blood pressure, cardiac output and vascular resistance are used to differentiate between challenge and threat states (positive and negative stress)[11],[12] and to quantify emotional response[13] in psychophysiological studies. A challenging situation causes a far bigger rise in cardiac output than a threating state. Total peripheral resistance rises in threat state but shows strong decrease in the challenging situation.

CNCO® is available with the CNAP® HD feature, currently only available in Europe.

For more information on CNAP, to include references to studies and research and plots, click here.

[1] https://en.wikipedia.org/wiki/Cardiac_output#Pulse_Pressure_methods
[2] Jeleazcov C et. al. Precision and accuracy of a new device (CNAP®) for continuous noninvasive arterial blood pressure monitoring: assessment during general anaesthesia. BJA. 2010; 105(3):264-272
[3] Biais, M. et. al. Continuous non-invasive arterial pressure measurement: Evaluation of CNAPTM device during vascular surgery Ann Fr Anesthesia
[4] Critchley, L. A., & Critchley, J. A. (1999). A meta-analysis of studies using bias and precision statistics to compare cardiac output measurement techniques. Journal of clinical monitoring and computing, 15(2), 85–91
[5] Peyton PJ, Chong SW: Minimally invasive measurement of cardiac output during surgery and critical care. Anesthesiology 2010; 113:1220-35

[6] Critchley LA, Lee A, Ho AMH: A critical review of the ability of continuous cardiac output monitors to measure trends in cardiac output. Anesth Analg 2010; 111:1180-92.

[7] Vincent JL et al.: Clinical review: Update on hemodynamic monitoring – a consensus of 16. Critical Care 2011, 15:229.

[8] Critchley, L. A., & Critchley, J. A. (1999). A meta-analysis of studies using bias and precision statistics to compare cardiac output measurement techniques. Journal of clinical monitoring and computing, 15(2), 85–91

[9] Peyton PJ, Chong SW: Minimally invasive measurement of cardiac output during surgery and critical care. Anesthesiology 2010; 113:1220-35.

[10] Critchley LA, Lee A, Ho AMH: A critical review of the ability of continuous cardiac output monitors to measure trends in cardiac output. Anesth Analg 2010; 111:1180-92.

[11] Kirby, L. D., & Wright, R. A. (2003). Cardiovascular correlates of challenge and threat appraisals: A critical examination of the Biopsychosocial Analysis. Personality and Social Psychology Bulletin, 7, 216-233.

[12] Tomaka, J., Blascovich, J., Kelsey, R. M., & Leitten, C. L. (1993). Subjective, physiological, and behavioral effects of threat and challenge appraisal. Journal of Personality and Social Psychology, 65, 248-260.

[13] Lackner, H. K., Weiss, E. M., Schulter, G., Hinghofer-Szalkay, H., Samson, A. C., & Papousek, I. (2013). I got it! Transient Cardiovascular Response to the Perception of Humor. Biological Psychology, 93, 33–40.

For more information on BIOPAC’s Noninvasive Blood Pressure monitoring and measurement systems and advanced functionality in the area of cardiovascular hemodynamics, to include CNAP noninvasive blood pressure systems, visit BIOPAC’s NIBP page or view BIOPAC’s NIBP amplifiers (MRI and small animal applications are also supported) and related equipment for a wide variety of research applications.

BIOPAC Systems, Inc. provides life science researchers and educators with data acquisition and analysis systems that inspire people and enable greater discovery about life.  Visit us at www.biopac.com.

Electrodermal Activity (EDA)

Typically, EDA is measured as skin conductance and a small direct constant voltage (0.5 vdc) is used as excitation source across the skin electrodes.

By Alan Macy, BIOPAC Systems, Inc.

Electrodermal activity measurement is subject to electrically-related characteristics of the skin. There are two phenomena associated with this type of skin activity. One is skin potential, which is a self-generated potential intrinsic to the skin. This potential is a consequence associated with dissimilar skin layers placed in proximity coupled with the presence and movement of interstitial fluids. An evoked skin potential response is called the sympathetic skin response. This change in skin potential can be evoked by electrical, auditory or magnetic stimulation. The other phenomenon associated with skin electrical activity can be measured when a stimulation (excitation) current is injected through, or a voltage is applied across, attached skin electrodes. The current or voltage stimulation is typically at constant (DC) level, or at low frequency, because the skin impedance is high. The application of excitation current or voltage produces a corresponding voltage or current, respectively, that changes over time subject to physiological state. In these cases, the skin’s resistance, impedance, conductance or admittance is being measured, corresponding to the type of electrical stimulation used.

EDA Measurements – subject to electrical excitation type:

Skin Resistance – Direct Constant Current (not commonly used)

Skin Conductance – Direct Constant Voltage (most commonly used)

Skin Impedance – Alternating Constant Current (not commonly used)

Skin Admittance – Alternating Constant Voltage (sometimes used)

Typically, EDA is measured as skin conductance and a small direct constant voltage (0.5 vdc) is used as excitation source across the skin electrodes. The skin admittance method (alternating constant voltage excitation) may provide some advantages in measurement in that this method does not polarize the skin electrodes during EDA recording. Skin conductance is usually measured in units of “Siemens” although sometimes “mho” is used. The unit “mho” comes from the reverse spelling of “ohm”, the unit of resistance. One mho equals one Siemen.  The conductivity of the skin is small, so values are given in microsiemens (uS) or micromhos (umho).

Changes in the electrically-related characteristics of the skin is correlated to eccrine sweat gland activity. Eccrine glands are in nearly all skin locations and are found, in highest concentrations, on the palms of hands, fingertips and soles of the feet. EDA, measured as skin conductance, is a physiological signal that indicates increased sympathetic nervous system (SNS) activity. This aspect of EDA is representative of changes in the electrical conductance of the skin due to eccrine (sweat) gland activity. SNS activity increases sweat gland secretions. Eccrine glands only receive activation signals from the SNS, so increased EDA is an indicator of increased arousal.

There are two aspects to skin conductance measurements, namely phasic and tonic. Tonic value is the average skin conductance level (SCL), that is relatively consistent over time, and is related to arousal. The phasic component  of skin conductance is the change of the skin conductance, over a short time period, in reaction to a stimulus. For a skin conductance response (SCR), the skin conductance rises in a short time period and then returns to tonic levels. SCRs are characterized by four different parameters: the response peak amplitude, latency of response, rise time to the response peak, and recovery time after peak.

For more information on BIOPAC’s EDA research solutions, including real-time live raw EDA data as well as real-time filtering or calculation channels including High-pass filtered/AC Coupled EDA, visit BIOPAC’s EDA Analysis page or view BIOPAC’s full line of electrodes, amplifiers, and wearable, wireless transmitters and loggers.

Additionally, a link to a recently updated EDA SCR Analysis Guide for Psychological Experiments came be found here.

BIOPAC Systems, Inc. provides life science researchers and educators with data acquisition and analysis systems that inspire people and enable greater discovery about life.  Visit us at www.biopac.com.

error: Content is protected !!