ECG – The Little Wave You Can’t Live Without

For millennia, ancient healers across the globe long recognized the human heart as immeasurably vital to human life. Other organs may take an occasional time out, but not the heart. This sinewy fist-sized pump contracts and relaxes an average 60 to 80 beats per minute and faithfully repeats this cycle some two and a half billion times over an average human lifespan, constantly driving and recirculating lifeblood through 100,000 miles of veins, arteries, and capillaries. It’s a monumental task that we take for granted, but if the process stops for more than a few minutes, so will this mysterious force we call life.

It’s intriguing to consider the wonder with which the ancients must have contemplated this organ that thumps so audibly. They knew it was of critical importance, and over the centuries learned its form and surface physiology, but what did they imagine animated it? What force kept the heart moving so steadily and faithfully, while remaining implacably divorced from the consciousness of its host? (Go ahead. Try to stop your heart. On second thought, don’t.)

The answer, in a word, is electricity. Although the stethoscope, invented in 1816 by French physician René Laennec, augmented audible heart sounds, it wasn’t until 1901 that Dutch physician Willem Einthoven developed a “string galvanometer,” capable of reliably recording the heart’s electrical activity. Einthoven’s work established a standard configuration for recording the electrocardiogram (ECG) and garnered him the Nobel Prize in 1924. Because the ECG reflects electrical activity, it is a useful “picture” of heart normality or abnormality through the observation and analysis of various distinct components of the cardiac cycle. If there are interruptions of the electrical signal generation or transmission, the ECG changes. These changes can be useful in diagnosing changes within the heart.

The methods for recording ECG have become increasingly sophisticated with the advent of digital technology and have put state-of-the art acquisition and analysis of ECG within reach of not only clinicians, but also researchers and educators. Wired in-lab systems such as the BIOPAC MP160 System with AcqKnowledge software are widely used for Research applications, while the MP36 System with Biopac Student Lab software are the industry standard for physiology education around the globe. Wireless systems such as BioNomadix or BioNomadix Smart Center can be used to collect ECG and other body signals in an untethered environment and the BioNomadix Logger is a great solution for acquiring ECG and other body signals over extended periods outside the lab.

We have come a long way since our forebears contemplated the mysteries of the vital mechanical wonder that beats in every chest, and we now have a myriad of accessible options for unlocking its secrets.

For further exploration of ECG, we invite you to enjoy the following comprehensive free ECG webinars:

Recording Great ECG

HRV & RSA – Fundamental ECG Analysis Techniques

BIOPAC offers a wide array of wired and wireless equipment that can be used in your research. To find more information on solutions for recording and analyzing signals such as ECG, heart rate, respiration and more using any platforms mentioned in this blog post, you can visit the individual application pages on the BIOPAC website.


 

Getting the Bands Back Together – Components of the EEG Signal

Many notable events occurred in 1929, not all of them good. The St. Valentine’s Day massacre. The stock market crash that triggered a worldwide economic crisis. The chain saw was invented. Not much good was happening in Germany either. Rampant inflation, the decline of the Weimar Republic, and the implacable rise of Nazism. But 1929 was also the year that German physician Hans Berger made an important scientific discovery that continues to influence how we study the human brain today. Dr. Berger discovered that electrodes placed on the human scalp could detect various patterns of electrical activity. After further study confirmed that these patterns were indeed related to brain activity and not mere scalp muscle artifact, scientists began to delve into the constructs of these “brain waves.” Today, electroencephalography (EEG) is still the primary method employed for recording brain function. In medical and basic research, correlation of particular brain waves reveals valuable information about sleep phases, emotional states, psychological profiles, and other mental activities. Much of this information is derived from five simple periodic rhythms, or frequencies, recorded in the EEG signal—alpha, beta, delta, theta, and gamma waves. These frequencies are known to be associated with specific degrees of alertness, affect, emotional states, and sleep. What do these frequency bands tell us about what is going on behind the gray matter? Allow us to introduce the band members.

Alpha (8-13 Hz) – Mellow Band Member

Alpha waves are associated with relaxation and calm. In general, the alpha rhythm is the prominent EEG wave pattern of adult subjects who are awake, but relaxed with eyes closed. Each region of the brain has a characteristic alpha rhythm but alpha waves of the greatest amplitude are recorded from the occipital and parietal regions of the cerebral cortex. In general, alpha wave amplitudes diminish when subjects open their eyes and are attentive to external stimuli, although some subjects trained in relaxation techniques can maintain high alpha amplitudes even with eyes open.

Beta (13-30 Hz) – Band Manager

Beta waves are related to memory, focus, and problem-solving. beta rhythms occur in alert individuals who are attentive to external stimuli, or exerting specific mental effort. Paradoxically, beta rhythms also occur during deep REM sleep. Beta waves may also be associated with “remembering” or retrieving memories.

Delta (1-5 Hz) – Supportive Band Member and Theta Rhythm (4-8 Hz) – Creative Band Member

Delta and theta rhythms are low-frequency EEG patterns that increase during sleep in the normal adult. Delta waves are associated with rejuvenation of the body through restorative deep sleep. Theta waves are more aligned with creativity and emotional connection. As people move from lighter to deeper stages of sleep (prior to REM sleep,) the occurrence of alpha waves diminishes and is gradually replaced by the lower frequency theta and then delta rhythms.

Although theta and delta rhythms are generally most prominent during sleep, there are cases when delta and theta rhythms are recorded from individuals who are awake. For example, theta waves will occur for brief intervals during emotional responses to frustrating events or situations. Delta waves may increase during difficult mental activities requiring concentration. In general, the occurrence and amplitudes of delta and theta rhythms are highly variable within and between individuals.

Gamma (> 32 Hz) – Perceptive Band Member

Gamma waves bring to the party cognition, information processing, learning, memory, and perception. Gamma waves were largely overlooked before the development of digital electroencephalography, as analog electroencephalography is restricted to recording and measuring rhythms that are usually less than 25 Hz.

A gamma wave is considered to be the “fastest” brain activity. The prominence of this wave leads to anxiety, high arousal, and stress. In optimal conditions gamma waves help with attention, focus, binding of senses (smell, sight, and hearing), consciousness, mental processing, and perception.

Research studies reported that gamma activity is involved in attention, working memory, and long-term memory processes, although excessive Gamma activity is also involved in psychiatric disorders such as schizophrenia, hallucination, Alzheimer’s disease, and epilepsy.

So in a sense, the periodic rhythms alpha, beta, delta, theta, and gamma, like the members of a tight musical ensemble, have distinct but overlapping roles for enabling the human brain to achieve wondrous things great and small that are often taken for granted.

BIOPAC Systems, Inc offers the following solutions for recording and analyzing EEG signals for research and education applications.

MP160 System with AcqKnowledge Software
EEG100D Smart Amplifier
EEG100C Amplifier Module
EEG100C-MRI Amplifier Module
BioNomadix Wireless EEG
BioNomadix Smart Center
Mobita 32-Channel Wireless EEG System
B-Alert Wireless EEG with Cognitive States Software
EPOCH Wireless In Vivo Neural Recording Systems—longterm EEG for rats, mice, or pups
Biopac Student Lab Systems—with EEG I, EEG II, and Hemispheric EEG lessons

We also invite you to enjoy our library of free EEG webinars on our Webinars page.

Understanding Stimulus Presentation Studies

Stimulus presentation studies are an important aspect of modern research that record and organize a participant’s reactions and physiological data to various inputs. These studies are commonly used in neuromarketing or psychophysiological experiments. First off, what is stimulus exactly? Put simply, a stimulus is a sensory input delivered to a participant with the purpose of eliciting a particular response. These stimuli can consist of images, words, lights, sounds, virtual reality, scent, or even mild electrical impulses.

The idea is to present varying types of stimulus to a participant at expected or unexpected intervals and record his/her response. For example, a collection of images might be presented (one at a time) ranging from pleasant (say an impressive vista) to neutral (say a street scene) to unpleasant (possibly a striking snake or other “fight or flight” image). Programmable stimulus systems (such as E-Prime or SuperLab) to present the stimuli, and can be used with a Chronos or M-Pod response keypad that the participant presses, each key representing a different response (e.g., pleasant image = press Key 1, unpleasant = press Key 2, etc.). A physiological signal commonly gathered from the participant is electrodermal activity (EDA), which measures the perspiration generated in a participant’s palms or fingertips. This “eccrine activity” has a strong correlation with emotional responses. For studies involving visual stimuli, a camera may be used to record the participant’s facial expressions. The expressions are simultaneously recorded and categorized using software such as FaceReader.

Stimulus experiments are generally set up using the hardware and software of the stimulus system and the resulting physiological data and stimulus markers recorded using a data acquisition system, such as BIOPAC’s MP160 with STP100C, MP36, or Smart Center Systems. These systems include AcqKnowledge or Biopac Student Lab life science software and the MP data acquisition units that interface with the stimulus hardware.

In practice, setting up stimulus studies is easier than it sounds on paper. The parameters and stimulus types are set up via drag-and-drop-interfaces in the E-Prime or SuperLab software, and the hardware interface set up using an I/O or USB connection between the stim hardware and the computer. The stimulus and BIOPAC data acquisition software can easily reside on the same computer, as can all stimulus and BIOPAC data acquisition hardware.

Stimulus studies can range from a simple setup, such as a participant responding to a sound for reaction time studies, to more randomized studies utilizing different types of stimulus delivered at varying pre-programmed intervals.

When the study is completed, data can be analyzed in AcqKnowledge software, and the various stimulus/responses organized automatically using AcqKnowledge’s automated Stim-Response Analysis routine.

For more information about conducting Stimulus studies using E-Prime, SuperLab, and AcqKnowledge software, we invite you to view the following free webinars and video tutorials:

Stimulus Presentation and Event Mark Up with E-Prime

Stimulus Presentation and Event Mark Up with SuperLab

AcqKnowledge Stim Synchronization and Analysis

Focus Areas – Automatically Create Using Define Between Events

BIOPAC offers a wide array of wired and wireless equipment that can be used in your research. To find more information on solutions for recording and analyzing signals such as ECG, heart rate, respiration and more using any platforms mentioned in this blog post, you can visit the individual application pages on the BIOPAC website.

Stressing over the effects of stress

Several studies show chronic stress is typically detrimental to health, while acute stress may be linked to positive effects in addition to the negative counterparts

With April comes National Stress Awareness Month, and it bears noting that different types of stress have varying effects. Where chronic stress is typically detrimental to health, acute stress may be linked to positive effects in addition to the negative counterparts. But is this trade-off worth it?

In a biological psychology experiment testing the effect of oxytocin on acute social stress, researchers found different results between men and women. Subjects underwent several stress tasks while their electrocardiography and impedance cardiography were recorded with a BIOPAC MP Research System and amplifiers. The researchers found that after being given oxytocin during the stressful event, men had less negative affect and women had greater math performance (compared to the control group).

A neurobiology study examined the effect stress had on an extinction memory process when a competing association was paired with a previously aversive cue. To test this, participants were presented with two images, one that was paired with a shock from a BIOPAC bar electrode, and one that was not. Extinction memory training immediately followed this stimulus, with extinction retrieval testing following a day later. Data gathered by a BIOPAC data acquisition system suggested significantly lower retrieval in the group that experienced the acute stress stimulus.

Another biopsychology experiment measured the effect of acute stress on pro-inflammatory cytokine levels in the blood. BIOPAC equipment was used to measure ECG while participants were given the Trier Social Stress Test. After reviewing the data and blood samples, the researchers determined that levels of the cytokine cell, interleukin-1β, increased significantly immediately after the stress test.

The physiological and psychological impacts of stress are clearly multifaceted with many potential results. In some situations, a heightened positive affect or greater analytical thinking may be beneficial. But is this boost in mental performance worth the increase of inflammatory cells and lower memory retention? As with many aspects of life, moderation is the safest answer, ensuring the negative effects do not become chronic problems.

For more information on BIOPAC’s wide range of tools for recording, displaying, and analyzing ECG measurements from human and animal subjects including respiration, heart rate variability, and RSA, visit BIOPAC’s electrocardiography pages and view BIOPAC’s full line of electrodes, amplifiers, and wearable, wireless transmitters and loggers.

BIOPAC Systems, Inc. provides life science researchers and educators with data acquisition and analysis systems that inspire people and enable greater discovery about life. Visit us at www.biopac.com.

The Trouble with Fatigue

Fatigue is a troublemaker–it can have serious impacts on data quality, even when using gold standards of measurement.

Fatigue is a known troublemaker in athletics, but can also have negative effects in physiology research. Fatigue can become a confounding variable, giving researchers data that may be less accurate or reliable.

Men and women may respond to fatigue differently, which can make obtaining good data especially difficult. In one study on fatigue by Stern et al. (2012), the researchers attempted to monitor fatigue and show different effects between men and women. This study attempted to follow a central nervous system component, as well as the peripheral nervous system. Using the BIOPAC MP160 system with AcqKnowledge software to record and analyze EMG, researchers were able to continually monitor muscle and neuron activation during the exercise tests.

The results of the study found that females had a higher rate of reduced central neural drive of the quadriceps, coupled with knee extension torque preservation. These factors, when paired together, can create a higher percentage for the possibility of knee injury for women.

With coffee being such a staple in the home (and in the lab!), researchers Smirmaul et, al (2017) wanted to see if coffee had any effect on fatigue, duration of exercise, and the perception of effort. This study used seven adult male cyclists in moderate hypoxic states to obtain their results. The experiment used a double-blind procedure, with some participants receiving no coffee. The researchers wanted to see if the coffee participant group took a longer time to reach fatigue. EMG was obtained by using BIOPAC MP160 with EMG amplifiers. The results showed that coffee has no effect on fatigue, but coffee did improve the time it took until the athletes reached exhaustion in high endurance tasks. The researchers believe that coffee lowers the perceived effort of the athlete, leading them to think they can go further.

Fatigue can also have impacts on data, even when using gold standards of measurement. A separate study done on fatigue by Neyroud et al. (2016), attempted to show that muscle fatigue has an effect on the validity of the ITT (Interpolated Twitch Technique). The ITT is used to evaluate the capacity of the central nervous system in activating skeletal muscles. This study used BIOPAC’z MP research system with EMG amplifiers to monitor muscle and neuron activation. Electrical stimulus was given to both samples to create fatigue, and a separate stimulus was given to mimic the ITT. This study found that peripheral fatigue factors do have an effect on the outcome of the ITT.

BIOPAC offers a variety of equipment that can be used in studies similar to the ones presented. To find more information on solutions for recording and analyzing signals such as EEG, EMG, respiration, skin conductance using the MP160/MP150, MP36, and other platforms, you can visit the individual application pages on the BIOPAC website. If you are interested in reading other related studies, visit the publications page on the BIOPAC website.

Holiday Happiness Part 2: Sounds, Smells, and Self-Reflection

In a previous post, we discussed the stress-reducing benefits of loving interactions with close friends and family during the holiday season. In addition to family, there are many mood-shaping habits and activities that characterize the holidays: the smell of home-cooked meals, seasonal music, and reflection on the past year, to name a few. But do these have a real impact on happiness?

In a psychophysiology study, Matsunaga, et al., tested odor effects on autobiographical memory recall. The researchers introduced several odor stimuli to participants and measured their psychological and physiological reactions. Heart rate and skin conductance were recorded throughout the experiment with a BIOPAC data acquisition system. The odor stimuli resulted in decreased heart rate, increased skin conductance level, and an increase in positive mood states.

Another article tested the effects of meditation on emotional regulation. Participants completed emotional measures before and after a meditation intervention, and had their ECG, respiration, and blood pressure recorded using a BIOPAC MP unit. The meditation correlated with greater participant emotional regulation, as suggested by lower heart rate and respiration.

In addition to meditation and smell, Harmat and Eerola have found music to also be emotionally significant. Participants listened to a musical piece, and then responded to a questionnaire about their emotional state. In addition to measuring pulse rate and facial expressions, the BIOPAC Research System and EDA Amplifier were used to record skin conductance while participants listened to the stimulus. The results found that music samples evoked several emotions, including nostalgia and happiness.

This research suggests that we can affect happiness using subtle techniques that are part of everyday living. To read more studies about psychophysiology and stress reduction, visit the BIOPAC publication page.

BIOPAC offers a variety of equipment that can be used in studies similar to the ones presented. To find more information on solutions for recording and analyzing signals such as skin conductance, ECG, heart rate, respiration, and EDA using the MP160/MP150, and other platforms, you can visit the individual application pages on the BIOPAC website. 

Holiday Happiness: Gratitude or Gifts?

Studies investigated the anxiety of gift-giving, the effects of social support in stressful situations, and what impact meditation has on heart rate, ECG, and blood pressure.

December has arrived, and for many the holidays bring a rush to check items off of a long shopping list for parents, siblings, friends, in-laws, and many more. Often we struggle to find that “perfect” gift, but are the physical goods we exchange the true source of the warmth and happiness that characterizes the season?

An article by Nomura investigated anxiety induced by gift-giving. To test this, EDA data was recorded with a BIOPAC data acquisition system and STP100 while participants responded to stimuli. The participants visualized a specific relative while being presented with potential gift options, and were asked how likely they were to purchase the potential gift for that relative. The data found that people who self-reported thinking of in-laws were the most stressed, while those who reported thinking of children or same-gender friends were least stressed.

A psychosomatic study by Inagaki and Eisenberger found that mental and physical well-being benefit from forms of social support. They tested this by administering mild shocks with the BIOPAC STMISOLA to male patients who held the hand of a female partner lying in an fMRI. The results suggest that this support (hand-holding) provided possible stress-reduction for both the male and female participants.

Another article on nonverbal communication and well being by Shaltout, et al. tested the effects of meditation and the subsequent ECG, blood pressure, and heart rate effects. The BIOPAC ambulatory BioHarness and NIBP Blood Pressure System gathered data while participants underwent several mediation episodes, during which they were instructed to focus on loving kindness towards a subject. The results found that participants had decreased heart rate.

Research suggests direct, loving interactions with those who are close to us have many stress-reducing benefits. So when you are shopping for gifts, remember that spending time is more important than spending money. To read more studies about love and stress reduction, visit the BIOPAC publication page.

BIOPAC offers a variety of equipment that can be used in studies similar to the ones presented. To find more information on solutions for recording and analyzing signals such as EEG, EMG, respiration, and EDA using the MP160/MP150, MP36, and other platforms, you can visit the individual application pages on the BIOPAC website. 

BIOPAC Systems, Inc. provides life science researchers and educators with data acquisition and analysis systems that inspire people and enable greater discovery about life. Visit us at www.biopac.com.

Respiration and ECG

By Alan Macy, BIOPAC Systems, Inc. The mechanical relationship between the diaphragm and heart and Respiratory Sinus Arrhythmia (RSA). are two influences of respiratory activity on the electrocardiogram (ECG).

By Alan Macy, BIOPAC Systems, Inc.

There are two influences of respiratory activity on the electrocardiogram (ECG). The first influence is characterized by the mechanical relationship between the diaphragm and heart. The second influence is a consequence of respiratory action on the vagus nerve and is known as Respiratory Sinus Arrhythmia (RSA).

  1. The position and movement of the diaphragm determine the position of the heart because the pericardium is firmly attached to the central tendon of the diaphragm. With deep inspiration, the diaphragm contracts and becomes flatter and less dome-shaped. As it does, the heart descends, moves backward, and rotates to the right so that it becomes narrower and more vertical. The apex beat is lower and more medial. During deep expiration, the diaphragm relaxes, elevates, and becomes more dome-shaped, and movements of the heart are the converse of those that occur during deep inspiration. The degree of the directional movements of the heart during quiet breathing is similar, but reduced, compared to deep breathing and, in some persons, may be hardly noticeable. Diaphragmatic breathing cyclically affects the position of the heart, thus modifying the ECG.
  2. Heart rate increases during inhalation and decreases during exhalation. Heart rate is normally controlled by centers in the medulla oblongata. One of these centers, the nucleus ambiguus, increases parasympathetic nervous system input to the heart via the vagus nerve. The vagus nerve decreases heart rate by decreasing the firing rate of the sinoatrial (SA) node. The SA node is the “pacemaker” of the heart. Upon expiration, the cells in the nucleus ambiguus are activated and heart rate slows down. In contrast, inspiration triggers inhibitory signals to the nucleus ambiguus and consequently the vagus nerve remains unstimulated. When recording the ECG, this phenomenon is experienced as subtle changes in the R-R interval that appears synchronized with respiration. This is the time period between two “R” waves on an electrocardiogram. The R-R interval associated with the ECG is shortened during inspiration and prolonged during expiration.

For more information on BIOPAC’s wide range of tools for recording, displaying, and analyzing ECG measurements from human and animal subjects including respiration, heart rate variability, and RSA, visit BIOPAC’s electrocardiography pages and view BIOPAC’s full line of electrodes, amplifiers, and wearable, wireless transmitters and loggers.

BIOPAC Systems, Inc. provides life science researchers and educators with data acquisition and analysis systems that inspire people and enable greater discovery about life. Visit us at www.biopac.com.

Electroencephalography (EEG) Pt. 2

Short-term Electroencephalography or EEG measurements are typically performed in synchrony with well-controlled, environmental, stimuli. Signal-averaging measurements, of this type, are known as Event Related Potentials (ERPs).

By Alan Macy, BIOPAC Systems, Inc.

This blog is a continuation of the previous discussion of Electroencephalography or EEG. Short-term Electroencephalography or EEG measurements are typically focused on the nature of cognition. These types of recordings are typically performed in synchrony with well-controlled, environmental, stimuli. Signal-averaging measurements, of this type, are known as Event Related Potentials (ERPs). There are a range of ERP signals, stretching between 50 ms to many seconds, with respect to the occurrence of the event. ERPs require signal averaging methods, to be observed, because their amplitude levels (0.2-2 uV) are usually lower than the ambient EEG signal level.

ERPs can be generated by a wide range of stimuli. The stimulus event can be targeted to any specific human sense or combination of senses (auditory, visual, olfactory, touch or taste). ERPs indicate the superimposed potentials of neuronal activity that synchronously generate when a subject processes sensory information. There are two general types of human subject ERPs. Early ERP wave components occur before 100 milliseconds after the stimulus. Late ERP components occur after 100ms after the stimulus. Early ERPs are known as exogenous potentials and late ERPs are known as endogenous potentials. Exogenous potentials depend on neuronal sensory structure responses that occur prior to cognition.  Endogenous potentials depend on cognitive responses to the sensory stimuli.

Slow Cortical Potentials (SCPs) are a class of ERPs that are characterized by slowly-moving, stimulus-related changes in the EEG signal. SCPs originate in cell concentrations in the top cortical layer of the brain. SCP waves (0.01-3 Hz) are EEG signals that occur before and after stimulus presentation. They encompass such pre-stimulus measures as Contingent Negative Variation (CNV) and Readiness Potential (RP).  The CNV is a slow-changing negative potential that happens between an initial warning and a “go” stimulus.  NV amplitude depends on the subject’s expectation of an imagined, forthcoming event. The RP is associated with the beginning of movement.  The RP precedes movement and is identified as a slow-changing negative potential that maximizes with movement onset. The RP is observed when signal averaging the EEG, from the motor cortex, synchronously with movement.

EEG can be useful to:

  • Monitor alertness and conscious states
  • Evaluate inhibitory control over behavior
  • Locate areas of neural damage
  • Establish levels of cognitive engagement
  • Investigate brain disorders, such as Alzheimer’s, epilepsy and seizures
  • Establish brain / computer interfaces
  • Monitor sleep

For more information on BIOPAC’s wide range of tools for recording, displaying, and analyzing EEG signals from human and animal subjects, including automated EEG analysis, seizure detection, evoked responses and many others, visit BIOPAC’s EEG Analysis page or view BIOPAC’s full line of electrodes, amplifiers, and wearable, wireless transmitters and loggers.

BIOPAC Systems, Inc. provides life science researchers and educators with data acquisition and analysis systems that inspire people and enable greater discovery about life.  Visit us at www.biopac.com.

Electroencephalography (EEG) Pt. 1

An EEG recording can be short or long-term. Shorter-term, signal-averaged, EEG measurements are typically used to evaluate precognitive and cognitive processes with respect to specific stimuli.

by Alan Macy, BIOPAC Systems, Inc.

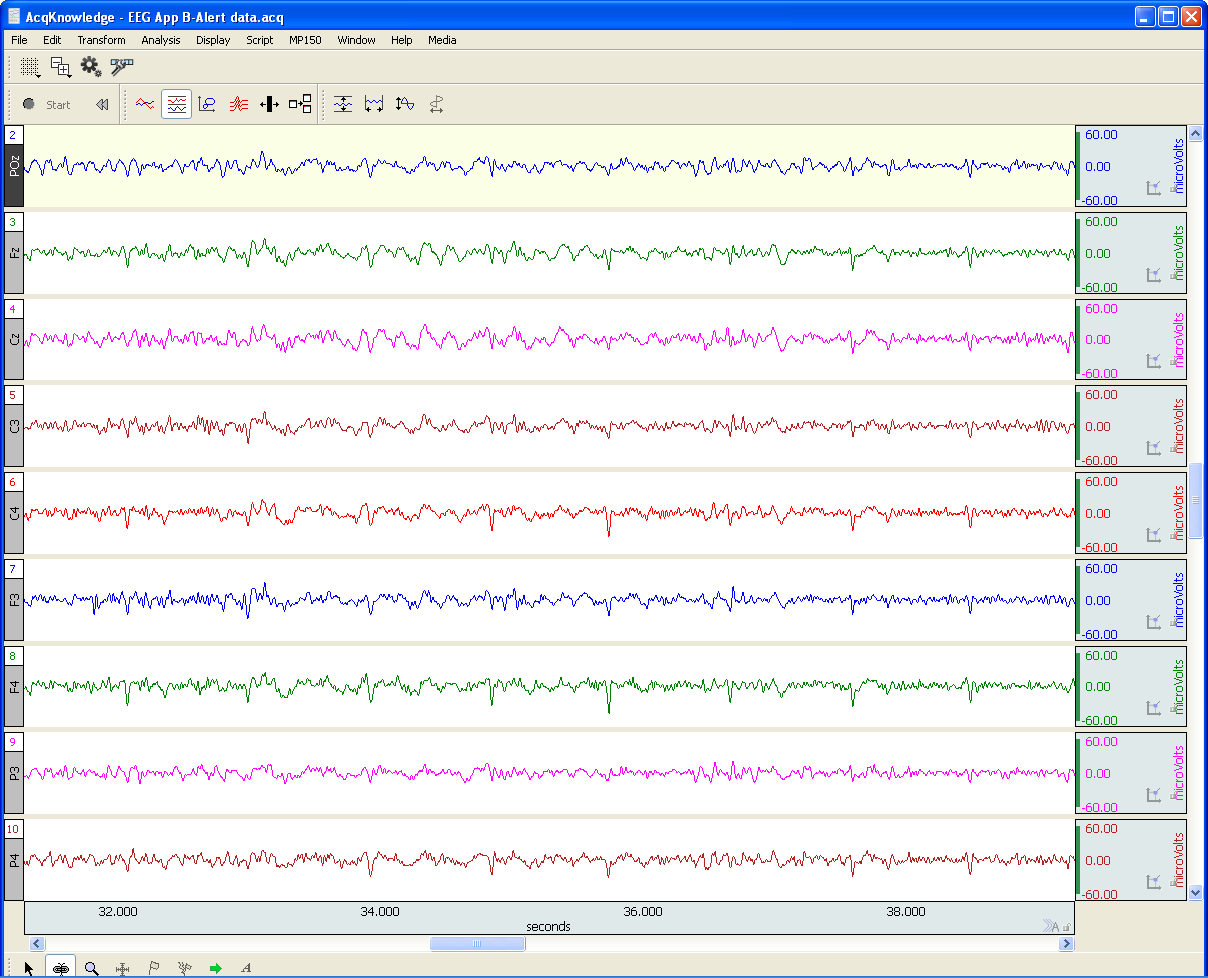
EEG or Electroencephalography is the measurement of differences in electrical potential (voltage) between points on the scalp. These voltages differences are the result of ionic current flow within neurons, and glial cells, in the brain. The measured scalp voltages are primarily in the 200 nV-200 uV amplitude range, 0.01 Hz – 100 Hz frequency range, and are typically simultaneously recorded at multiple sites on the scalp. The EEG is usually collected using the 10-20 electrode montage. This arrangement of electrodes typically references left or right hemisphere electrodes to the left or right earlobe (or mastoid), respectively. However, a wide range of signal referencing methods are used depending on the situational requirements.

An EEG recording (knows as an electroencephalogram) can be short or long-term. Shorter-term, signal-averaged, EEG measurements are typically used to evaluate precognitive and cognitive processes with respect to specific stimuli. These EEG signals have relatively low amplitude levels, typically 200 nV – 2 uV, so signal averaging methods are required to discern these signals from background concurrent EEG sources. Longer-term, non-signal-averaged, EEG measurements are used to discern the subject’s, real-time, conscious state. Different and observable wave rhythms are evident during such recordings. Commonly observed rhythms include: Delta, Theta, Alpha, Beta and Gamma waves. These waves can be continuously recorded and are in the range of 2 uV – 200 uV.

Delta waves (0.5-4 Hz) are considered slow rhythms and tend to be the highest in amplitude. Delta waves are normally the dominant rhythm in infants. Delta waves are found in sleeping adults and consistent Delta is considered abnormal in conscious adults.  Delta waves are low-frequency EEG patterns that increase during sleep in the normal adult.  Although Delta waves are generally prominent during sleep, there are cases when Delta rhythms are recorded from awake individuals. Delta waves may increase during difficult mental activities requiring concentration and other continuous-attention tasks. Delta rhythms depend on activity of motivational systems, in the brain, and participate in the identification of prominent phenomena.  The presence and amplitude of Delta rhythms are highly variable within and between individuals.

Theta waves (4-8 Hz) are considered slow rhythms. Theta waves are normal in children up to 13 years old.  Theta waves are found in sleeping adults and consistent Theta is considered abnormal in conscious adults. Theta rhythms are low-frequency EEG patterns that increase during sleep in the normal adult. Although Theta rhythms are generally prominent during sleep, there are cases when theta rhythms are recorded from awake individuals.  Theta rhythms are involved in memory and emotional regulation. Theta waves will spike during emotional responses to frustrating events or situations.  Theta waves are associated with the inhibition of elicited responses, in that Theta activity has been found to temporarily increase when a person is actively trying to repress a behavioral response. The presence and amplitude of theta rhythms are highly variable within and between individuals.

Alpha waves (8-13 Hz) are considered moderate rhythms and usually seen in the occipital regions of the head and are higher in amplitude on the dominant side. Alpha waves appear when relaxing and closing the eyes. Alpha waves are suppressed when opening the eyes or coming to an alert state. Alpha waves are the primary rhythm observed in relaxed adults and are present during most of life after 13 years old. Each region of the brain has a characteristic Alpha rhythm amplitude and the largest Alpha waves are from the occipital and parietal regions of the cerebral cortex. Alpha rhythms correlate with inhibitory processes in the brain. Reduced Alpha wave occurrence and amplitude, in relation to Delta-Theta activity, is associated with reduced inhibitory control over behavior.

Beta waves (13-30 Hz) are considered fast rhythms. Beta waves are typically observed on both sides of the head and are most evident frontally (executive function). Beta waves may be substantially reduced in areas of cortical damage.  Beta waves are considered normal and are the dominant rhythm in subjects whose eyes are open or are otherwise attentive to external stimuli or exerting specific mental effort. Beta rhythms also occur during rapid eye movement (REM) sleep. In this situation, the typical Alpha rhythm is suppressed and supplanted by Beta waves. This replacement of Alpha rhythm is called desynchronization, or “Alpha block”, because it represents a change in the synchronized activity of neural systems in the brain. It is thought that Beta waves represents arousal of the cortex to a higher state of alertness and may also be associated with memory retrieval.

Gamma waves (30-100 Hz) are considered fast rhythms. Gamma waves are present during mixed sensory processing, such as perceptual tasks that combine hearing and seeing. Gamma waves are also evident during short-term memory matching of recognized sights, sounds or sensations. A reduction in Gamma wave activity might be associated with cognitive decline, especially when compared to Theta wave activity levels.

Long-term EEG signal characteristics are related to consciousness. As conscious activity increases, the dominant EEG rhythms shift to higher frequencies. When asleep, with the exception of REM, the dominant EEG rhythms move to lower frequencies.  In deep sleep, the EEG is characterized by low frequency Delta waves.

This blog is continued in Part 2.

For more information on BIOPAC’s wide range of tools for recording, displaying, and analyzing EEG signals from human and animal subjects, including automated EEG analysis, seizure detection, evoked responses and many others, visit BIOPAC’s EEG Analysis or view BIOPAC’s full line of electrodes, amplifiers, and wearable, wireless transmitters and loggers.

BIOPAC Systems, Inc. provides life science researchers and educators with data acquisition and analysis systems that inspire people and enable greater discovery about life.  Visit us at www.biopac.com.

error: Content is protected !!