Ensuring Error-free NIBP Measurements & Accurate Data

Correct subject set-up of upper arm cuff, CNAP® NIBP finger sensor and CNAP® controller is essential to ensure accurate data reading and collection of continuous blood pressure and hemodynamics with the NiBP 100D throughout the measurement.

By Dr. Jürgen Fortin, CEO, CNSystems

The NIBP100D provides proven accuracy for blood pressure and, using the  NIBP100-HD, full hemodynamics with validation in a number of settings and against research and clinical gold standards. Subject setup with the NIBP100D upper arm cuff and reusable finger sensor is extremely easy, however, please keep the following practical tips in mind to ensure accurate data collection:

1. Upper arm Cuff: Sizing and placement

Over the years, upper arm cuffs have become a standard measurement in basic research setup providing brachial pressure intermittently (timed intervals) rather than continuously (for every heart beat).

The NIBP100D has an upper arm cuff (Suntech Medical) integrated to provide calibration for the continuous finger sensor. For accurate calibration please mind the following steps:

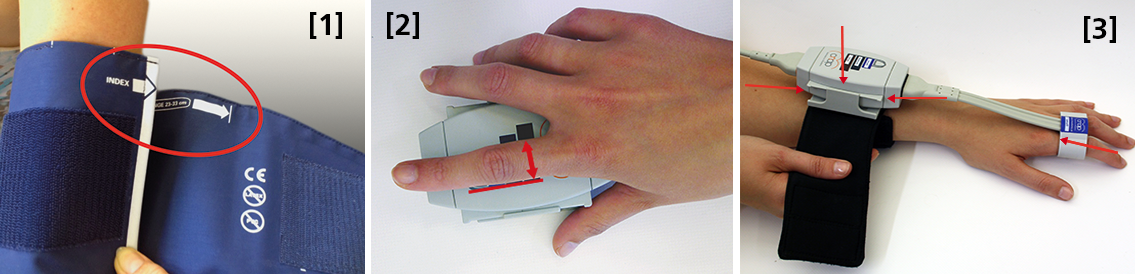
 Size: using a too small or too big upper arm cuff can lead to significant over- /or under- reading of blood pressure. Always ensure you choose the right size ( four sizes are provided with the NIBP100D) by using the range marker on the inside of the cuff–see image #3 in the photo above or review setup procedures here:

  • When wrapping the cuff around the upper arm before fixing the Velcro, ensure the white “index” arrow points into the indicated range area. If it does not, use the bigger or the smaller cuff! 
  • Placement: always align the artery marker (white arrow) on the cuff with the brachial artery (in the crook of the arm). The cuff can be placed ipsilaterally or contralaterally to the arm with the CNAP finger sensor on.
  • Wrapping: pull the upper arm cuff so tight that you could still get about 2 fingers under the wrapped cuff (air volume).

SunTech has developed a short video on the basics of measuring blood pressure. Although designed for a clinical audience, the video provides good information for researchers. Watch the SunTech NBP training video here.

2. CNAP finger sensor: Sizing and placement

Using a too small or too big finger sensor cuff can distort the continuous blood pressure readings. Avoid placing the sensor on finger joints, which may lead to a poor or even no signal. 

Size: Choose the right size from three different sizes by using the size indicator on the top of the CNAP Controller:

  • Put the proximal phalanx of the index finger on the indicator align with the grey line on the left. Choose the sensor size indicated on the shortest bar which is still visible.
  • Always use the larger sensor if you are in doubt about the size.
  • In some subjects it may be difficult to place the finger sensors on the proximal limb (i.e. finger-arthrosis, too short finger joints). In these cases, try placing the finger sensors on the middle limbs. However, make sure that the sensors are not placed over the finger joints. Hold the sensor in place or use medical tape until the sensor is inflated (start of measurement).

With the CNAP Software V5.2, sensor sizing becomes even easier—the size of the finger sensor is checked automatically upon start and the software gives notice if it does not fit. 

  • Placement: The finger sensor is placed on two neighboring fingers and slid back fully to the proximal limb!
  • Make sure not to place them on the finger joints!

3. CNAP Controller:  correct placement

The slide for the CNAP Controller allows for slight hand movement without dislocating the CNAP finger sensor. It is very important that the CNAP Controller is correctly placed:

  • Placement: Make sure that the CNAP Controller is placed in central position of the slide.
  • If the CNAP Controller is not placed correctly, the CNAP finger sensor might be pushed forward on the finger joints. 
  • View detailed pictures of CNAP Monitor Set Up Overview here.

4. Further recommendations

4.1. Start of measurement

  • Make sure that the subject keeps still and does not move his/her hand.
  • Do not change body posture during until a continuous signal is displayed!

4.2. Improving signal quality if signal is poor

  • Warm up fingers to improve blood flow (cover hand, hold hand in warm water prior to measurement, use disposable exam glove)
  • Check position of CNAP finger sensor: the sensor must not be placed on the finger joints.
  • Check if CNAP finger sensor size is correct.
  • Try to measure on the other hand.

4.3 Manual calibration with NBP

  • Trigger a manual NBP after moving or repositioning the subject/the subject’s hand or whenever hydrostatic change/offset happens.
  • Trigger a manual NBP whenever you feel that an update to the NBP reading may be beneficial
  • Triggering a manual NBP is possible at any time and in any mode. 
  • Additional information—view the CNAP NIBP100D operator’s manual here.

4.4 Removal of CNAP finger sensor

  • Do not remove the CNAP finger sensor when a measurement is still in progress. Stop measurement first, then remove the sensor!

 4.5. Battery

  • Never completely discharge the battery.
  • Immediately connect to power supply if battery charge status is below 25%.

To read a recent study which evaluated the agreement of the continuous noninvasive cardiac output measurements by CNAP in comparison with cardiac output measurements obtained invasively using transpulmonary thermodilution (TDCO), go here.

The NIBP100D provides validated, proven accuracy for blood pressure and, with the NIBP100-HD model, full hemodynamics. To ensure the acquisition of good data and accurate readings, researchers should follow the setup procedures outlined above.
For more information on BIOPAC’s Noninvasive Blood Pressure monitoring and measurement systems and advanced functionality in the area of cardiovascular hemodynamics, to include CNAP noninvasive blood pressure systems, visit BIOPAC’s NIBP page or view BIOPAC’s NIBP amplifiers (small animal applications are also supported) and related equipment for a wide variety of research applications.

BIOPAC Systems, Inc. provides life science researchers and educators with data acquisition and analysis systems that inspire people and enable greater discovery about life. Visit us at www.biopac.com.

CNAP HD: Noninvasive Hemodynamic Monitoring in Research

Cardiac Output (CNCO® ) and further essential hemodynamic parameters calculated from the continuous non-invasive arterial pressure curve (CNAP®) by means of the Pulse Contour Analysis shows high accuracy and high trending ability (precision) compared to invasive clinical standards (e.g. thermodilution and PiCCO) with valuable benefit for scientific and clinical research.

By Dr. Jürgen Fortin, CEO, CNSystems

Pulse Contour Analysis (PCA) for deriving complete Hemodynamics from continuous blood pressure wave (CNAP)

Pulse Contour Analysis (PCA)[1] derives important physiological information on preload, contractility, afterload and compliance of the heart from the well validated CNAP® Continuous Noninvasive Arterial Pressure Curve[2],[3]. By adding biometric patient data Stroke Volume (SV) and therefrom Continuous Noninvasive Cardiac Output (CNCO®), both essential hemodynamic markers, are calculated. Further hemodynamic parameters such as Systemic Vascular Resistance (SVR) as well as all indexed values SI, CI or SVRI are derived completing the hemodynamic picture.

Validation: CNCO® is clinically validated against invasive methods

Non-invasive continuous CNCO® is the non-invasive continuous cardiac output calculated from CNAP® Arterial Pressure as described above.

Accuracy of CNCO® compared to clinical standards such as invasive thermodilution (TD) or PiCCO is expressed as percentage error. In 1999, Critchley and Critchley suggested a percentage error of 30% or less[4]. In clinical practice, however, percentage errors of 40-45% are more realistic for the interchangeability between two CO-measurement methods (meta-analysis by Peyton and Chong[5]).

Trending ability is the precise tracking of changes in CO. According to Critchley, Lee and Ho, reliable trending ability[6] is indicated by concordance rates of > 90%. Vincent and colleagues state that following hemodynamic trends may be more important than absolute values[7].

CNCO® shows both high accuracy as well as high trending ability (precision) compared to the invasive clinical standards thermodilution and PiCCO fulfilling all Critchley criteria:

Bland-Altman plots show

  • Small bias and narrow limits of agreement
  • Percentage errors ≤ 30% (according to strict Critchley standard [8],[9])
  • Concordance rates ≥ 90% (according to standard [10])

Read more on CNAP accuracy here and here.

Benefit of continuous BP, CO & SVR in research (examples)

Blood pressure, cardiac output and vascular resistance are used to differentiate between challenge and threat states (positive and negative stress)[11],[12] and to quantify emotional response[13] in psychophysiological studies. A challenging situation causes a far bigger rise in cardiac output than a threating state. Total peripheral resistance rises in threat state but shows strong decrease in the challenging situation.

CNCO® is available with the CNAP® HD feature, currently only available in Europe.

For more information on CNAP, to include references to studies and research and plots, click here.

[1] https://en.wikipedia.org/wiki/Cardiac_output#Pulse_Pressure_methods
[2] Jeleazcov C et. al. Precision and accuracy of a new device (CNAP®) for continuous noninvasive arterial blood pressure monitoring: assessment during general anaesthesia. BJA. 2010; 105(3):264-272
[3] Biais, M. et. al. Continuous non-invasive arterial pressure measurement: Evaluation of CNAPTM device during vascular surgery Ann Fr Anesthesia
[4] Critchley, L. A., & Critchley, J. A. (1999). A meta-analysis of studies using bias and precision statistics to compare cardiac output measurement techniques. Journal of clinical monitoring and computing, 15(2), 85–91
[5] Peyton PJ, Chong SW: Minimally invasive measurement of cardiac output during surgery and critical care. Anesthesiology 2010; 113:1220-35

[6] Critchley LA, Lee A, Ho AMH: A critical review of the ability of continuous cardiac output monitors to measure trends in cardiac output. Anesth Analg 2010; 111:1180-92.

[7] Vincent JL et al.: Clinical review: Update on hemodynamic monitoring – a consensus of 16. Critical Care 2011, 15:229.

[8] Critchley, L. A., & Critchley, J. A. (1999). A meta-analysis of studies using bias and precision statistics to compare cardiac output measurement techniques. Journal of clinical monitoring and computing, 15(2), 85–91

[9] Peyton PJ, Chong SW: Minimally invasive measurement of cardiac output during surgery and critical care. Anesthesiology 2010; 113:1220-35.

[10] Critchley LA, Lee A, Ho AMH: A critical review of the ability of continuous cardiac output monitors to measure trends in cardiac output. Anesth Analg 2010; 111:1180-92.

[11] Kirby, L. D., & Wright, R. A. (2003). Cardiovascular correlates of challenge and threat appraisals: A critical examination of the Biopsychosocial Analysis. Personality and Social Psychology Bulletin, 7, 216-233.

[12] Tomaka, J., Blascovich, J., Kelsey, R. M., & Leitten, C. L. (1993). Subjective, physiological, and behavioral effects of threat and challenge appraisal. Journal of Personality and Social Psychology, 65, 248-260.

[13] Lackner, H. K., Weiss, E. M., Schulter, G., Hinghofer-Szalkay, H., Samson, A. C., & Papousek, I. (2013). I got it! Transient Cardiovascular Response to the Perception of Humor. Biological Psychology, 93, 33–40.

For more information on BIOPAC’s Noninvasive Blood Pressure monitoring and measurement systems and advanced functionality in the area of cardiovascular hemodynamics, to include CNAP noninvasive blood pressure systems, visit BIOPAC’s NIBP page or view BIOPAC’s NIBP amplifiers (MRI and small animal applications are also supported) and related equipment for a wide variety of research applications.

BIOPAC Systems, Inc. provides life science researchers and educators with data acquisition and analysis systems that inspire people and enable greater discovery about life.  Visit us at www.biopac.com.

CNAP Noninvasive Blood Pressure Technology – An Overview

The interaction of an easy-to-use finger sensor with unique control loops and algorithms as well as with NBP provides high accuracy of the BP signal – equivalent to invasive arterial line.

By Dr. Jürgen Fortin, CEO, CNSystems

Continuous noninvasive arterial blood pressure measurement (CNAP®) is the technique for measuring blood pressure (BP) that is, as the title describes, both continuous and noninvasive. CNAP combines the advantages of the following two clinical “gold standards:” it measures blood pressure (BP) continuously in real time like the invasive arterial catheter system (IBP) and it is noninvasive, like the standard upper arm sphygmomanometer (NBP).

The CNAP principle is the intelligent interaction and synergy of IP-protected features and functions based on the well-known Vascular Unloading Principle by Penaz (with significant improvement over the past 15 years) [1], on unique control algorithms (e.g. VERIFI) [2] and on calibration mechanisms, making it a reliable and accurate method with results comparable to the intra-arterial measurement.

Pulsating blood flow detected by infrared light sensors is kept constant by the counter pressure exerted on the artery through inflating or deflating the integrated cuff. The resulting pressure in the finger sensor corresponds to the real arterial pressure [1]. The pressure system is controlled by multiple digital feedback loops. The “VERIFI-algorithm” is used for high fidelity signal processing and artifact rejection. This is a superior method for filtering vasomotoric influences, in contrast to Standard methods based on Vascular Unloading Principle, which can show false BP shifts due to influence of vasomotoric tone.

In terms of calibration, CNAP is the only available technology calibrating to directly measured upper arm values, providing blood pressure variations in absolute values at heart-level. The interaction of finger sensor with NBP provides high accuracy of the BP signal – equivalent to invasive arterial line.

Use of CNAP provides researchers with several benefits, including: 

  •  NBP Cuff – Automated scaling to brachial pressure (gold standard) at start of measurement and user programmable
  • Double finger sensor – Quick and error-free application
  • Continuous waveform – Continuous tracing of hemodynamic changes without interruptions to recalibrate; beat-to-beat systolic, diastolic, mean BP values
  • Connectivity – Plug-and-play integration into all common data acquisition systems and patient monitors
  • Data storage and analysis – Unlimited data storage via USB interface. Data format (*.csv) for import into all common data analysis software packages (e.g. BIOPAC’s AcqKnowledge®, Matlab, MS Excel, SPSS, etc.)
  • Accuracy – Reliably equivalent to invasive blood pressure (IBP) [3], [4]

Notes:

[1]  Jan Penaz, Brno, Czech Republic 1973.

[2]  Fortin J et al.: Continuous non-invasive blood pressure monitoring using concentrically interlocking control loops. Comput in BiolMed 36 (2006) 941 – 957.

[3]  Jeleazcov C et. al. Precision and accuracy of a new device (CNAP) for continuous noninvasive arterial blood pressure monitoring: assessment during general anaesthesia. BJA. 2010; 105(3):264-272.

[4]Biais, M. et. al. Continuous non-invasive arterial pressure measurement: Evaluation of CNAP device during vascular surgery Ann Fr Anesthesia.

Studies documenting the CNAP device’s performance can be found below:

Arterial stiffness is higher in older adults with increased perceived fatigue and fatigability during walking

Does conscious intention to perform a motor act depend on slow cardiovascular rhythms?

The Effect of Mainstream Media on Body Image and Stress Reactivity in Latina Females

For more information on BIOPAC’s Noninvasive Blood Pressure monitoring and measurement and cardiology research solutions, to include CNAP noninvasive blood pressure systems, visit BIOPAC’s NIBP page or view BIOPAC’s NIBP amplifiers (MRI and small animal applications are also supported) and related equipment for a wide variety of research applications.

BIOPAC Systems, Inc. provides life science researchers and educators with data acquisition and analysis systems that inspire people and enable greater discovery about life.  Visit us at www.biopac.com.

Electrocardiogram Waveshape Pt. 2

In some situations, it can be helpful to craft a compromise between maximizing ECG signal bandwidth, preserving the essential ECG waveshape, reducing the impact of skeletal myo-electrical noise and removing mains interference.

By Alan Macy, BIOPAC Systems, Inc.

This blog continues the discussion of Electrocardiogram waveshape.

In some situations, it can be helpful to craft a compromise between maximizing ECG signal bandwidth, preserving the essential ECG waveshape, reducing the impact of skeletal myo-electrical noise and removing mains interference. If this collective compromise is not well-considered, certain problems can arise. For example, if notch filters are used to remove mains interference in the ECG signal processing channel, significant distortion can be introduced into the ECG waveshape. Accordingly, notch filters are generally avoided or only used in combinations with lowpass filters to minimize undesired effects.

When constraining the ECG signal bandwidth, it becomes increasingly important to be aware of the phase linearity of the filters used to bandlimit the channel. For example, if a 35 Hz, second order, lowpass, Butterworth filter is used instead of one at 150 Hz, then an observable “ringing” will be evident after the QRS interval. This ringing occurs because of the phase non-linearity of the 35Hz Butterworth filter. However, if the 35 Hz filter is adjusted to have more “Bessel-like” phase qualities, the problematic ringing can be eliminated. When limiting the ECG signal frequency band to less than 0.05-150 Hz, reasonably phase linear highpass and lowpass filters will preserve the essential waveshape of the ECG. Phase linearity implies constant group delay. Constant group delay means that all frequencies in the filter passband are delayed by the same amount of time. Phase linear analog filters, and their digital equivalents, can be designed to process an ECG signal with minimal, filter-induced, distortion.

In addition to the above-listed simple strategies, a host of digital signal processing methods are available to optimize the previously mentioned compromise. Methods include linear and non-linear adaptive filters, synchronous adaptive noise cancellation, dynamic neural networks, coherent averaging, transform domain singular value decomposition and Legendre moments. [2]
References:

[2] http://www.ijric.org/volumes/Vol7/Vol7No7.pdf

For more information on BIOPAC’s ECG solutions, visit BIOPAC’s ECG-Cardiology page or view BIOPAC’s full line of electrodes, amplifiers, and wearable, wireless transmitters and loggers.

BIOPAC Systems, Inc. provides life science researchers and educators with data acquisition and analysis systems that inspire people and enable greater discovery about life.  Visit us at www.biopac.com.

Electrocardiogram Waveshape – Pt 1

When recording ECG, it’s important to consider the impacts of electrode placement and amplifier filters on the measured biopotential. Electrode placement is important because different orientations of biopotential surface electrodes with respect to the heart’s position will result in different signal shapes.

By Alan Macy, BIOPAC Systems, Inc.

When recording ECG, it’s important to consider the impacts of electrode placement and amplifier filters on the measured biopotential. Electrode placement is important because different orientations of biopotential surface electrodes with respect to the heart’s position will result in different signal shapes. As the heart contracts and expands, during the course of pumping blood, a time-varying, voltage signal is propagated over the volume of the heart. This voltage signal conducts to the surface of the body and is detectable between any two points on the body that straddle the heart. The signal can look quite different depending on whether the signal is collected from left hand to right hand or from right hand to left leg. When the ECG signal is recorded far from the heart, electrode placement is not critical to obtain similar-looking ECG waveforms when recording over time. As electrodes are placed increasingly close to the heart, then electrode placement becomes quite specific to recreate similar-looking ECG signals. This is because the body is a volume conductor and the heart is not a point-source of electrical signal activity.

The ECG waveform has been specified to consist of frequency components in the range of 0.05 Hz to 150 Hz, even though the characteristic ECG waveform shape is largely composed of components from 0.05 Hz to 35 Hz. However, even if the ECG’s primary waveshape is preserved, bandwidth limits affect usability of the data. For a high-resolution ECG recording, the signal bandwidth should be maximized. Although the Association for the Advancement of Medical Instrumentation (AAMI) standard recommends an ECG bandwidth of 0.05-150 Hz, surface electrodes measurements can show ECG components up to 500 Hz. [1]

As with any physiological measurement from a subject, the balance lies in attempting to isolate the signal of interest from residual noise sources. In the case of ECG recording, interfering noise is often generated by skeletal muscle that lies in the superposition path defined by electrode placement. This noise (recorded as the electromyogram) can be especially problematic if the subject is intentionally moving during the ECG measurement. Other noise sources include interference resulting from mains-generated displacement currents (50/60 Hz hum).

Depending on the nature of the ECG measurement requirements, filtering methodology can be a helpful ally to reduce the effects of interfering noise sources.  The critical aspects of filtering are a function of the filter’s magnitude and phase characteristics.  Choice of filter topologies can have a significant effect on the shape of the ECG.  Given that AAMI guidelines are primarily concerned with ECG filter flatness from 0.05-150 Hz, typically, second-order (or higher) Butterworth filters are used to define these limits.

The discussion of ECG waveshape is continued in Electrocardiogram Waveshape Pt. II.

[1] http://circ.ahajournals.org/content/115/10/1306.full

For more information on BIOPAC’s ECG solutions, visit BIOPAC’s ECG-Cardiology page or view BIOPAC’s full line of electrodes, amplifiers, and wearable, wireless transmitters and loggers.

For more information on BIOPAC Systems, visit us at www.biopac.com.

error: Content is protected !!