T4 Conference Wrap-up

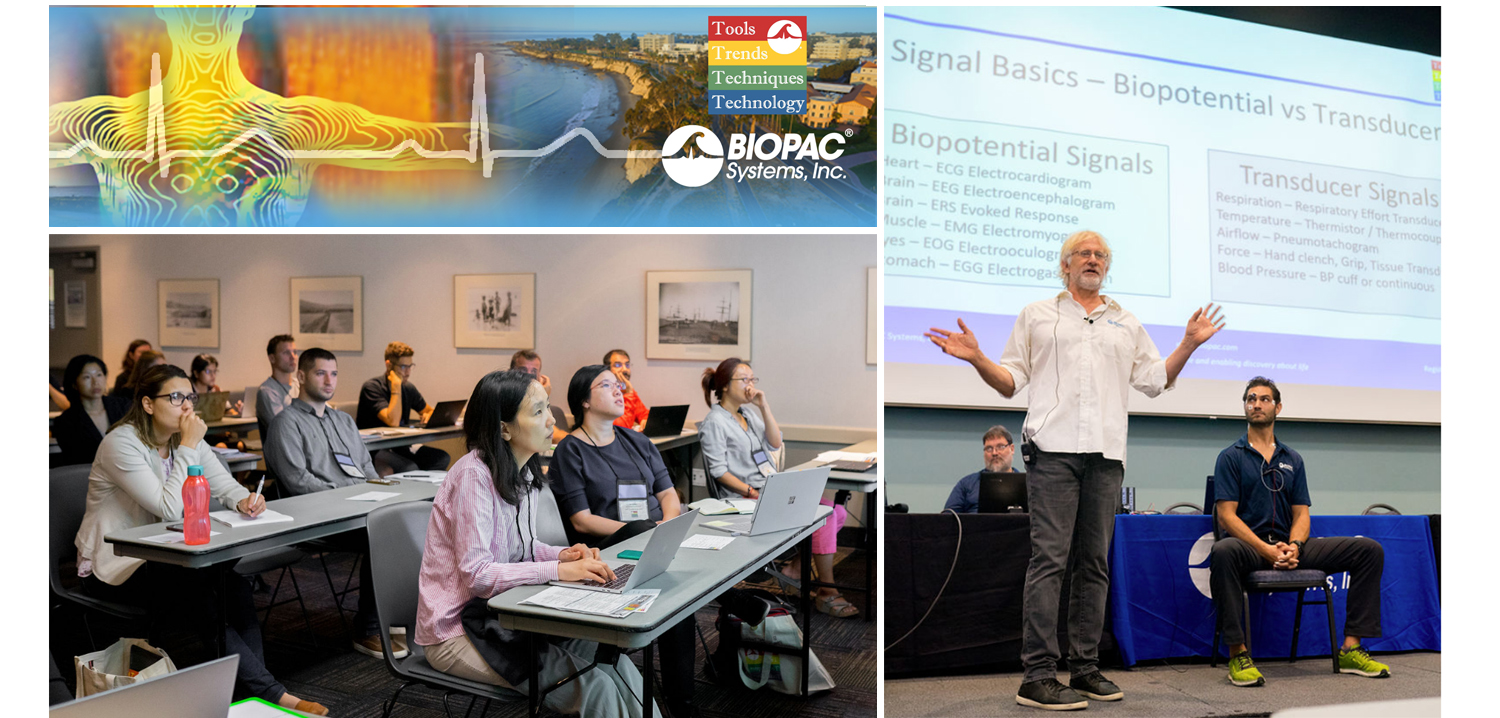
August is a month of barbecues, baseball, and last-minute vacations against the backdrop of a fading summer, and the eighth month of 2019 proved to be an equally exciting time at BIOPAC, with something of a pleasant vacation thrown in. On August 12-14, BIOPAC hosted its 2nd Biennial “Tools, Trends, Techniques, and Technology” Human Physiology Conference, known as “T4” to our friends and partners around the world. This three-day event, first held in 2017, featured lively, informative sessions hosted by BIOPAC staff, partners, noted academics, and industry experts, and covered a wide range of physiological techniques and disciplines. Over 150 attendees joined BIOPAC at the 2019 T4 Conference staged once again at the beautiful University of California at Santa Barbara campus. Participants and instructors winged in from China, Australia, Germany, Sweden, Italy, Spain, U.K., Ireland, and Egypt, as well as from wide regions of the U.S and Canada to soak up the idyllic surroundings of this ocean-side campus.

The focus of BIOPAC’s T4 Conference was to provide a fun, relaxed environment while hosting nearly 40 hands-on, human physiology training workshops chaired by over 20 distinguished instructors from around the globe. One of the many conference highlights was the “Mindfulness, Meditation, and Measurement: Mindfulness Exercises in Physiological Monitoring” session, hosted by Dr. Allan Weiss of the University of Southern California and  BIOPAC Co-founder and Director of R & D Alan Macy. These sessions, conducted in two parts over a two day period were booked beyond capacity, even though the early morning fog hadn’t yet lifted from the campus skyline.

The varied additional sessions covered a range from the basics, “Setting Up Your Lab, Getting Great Data and Troubleshooting,” (hosted by Dr. Terry Blumenthal of Wake Forest University, and BIOPAC’s Alan Macy and Tim Cook), and “Creating Your Own Lessons Using BSL PRO,” (hosted by Dr. Taffeta Elliot of the New Mexico Institute of Mining and Technology), to exciting new technologies such as “Integrating Screen-based Eye Trackers with AcqKnowledge,” with Keith Jackson of BIOPAC partner company EyeTech, BIOPAC CEO Frazer Findlay, and BIOPAC Engineering Manager Ed Peterlin. Additional wide-ranging physiological disciplines were also covered, including MRI techniques, stimulation, and exercise physiology. All sessions were conducted using BIOPAC hardware and software systems, as well as platforms provided by BIOPAC partners such as Cedrus, fNIR, WorldViz, Psychology Software Tools, and CNSystems. At the end of each day, it was time to relax and unwind with a beverage of choice, a a walk along the beach, and some good conversation. Each evening featured excellent meals and camaraderie in the relaxed yet elegant environment of some of Santa Barbara and Goleta’s most stunning surroundings. After three great days of immersive sessions, it came time for everyone to part ways, having forged new collaborative partnerships and an enhanced knowledge about the full potential of BIOPAC and BIOPAC partner products.

You don’t have to wait for T4 2021 to learn more about life science data—watch Fundamentals of Physiological Data Recording now!

For a closer look at T4, and a preview of what is sure to be an exciting 2021 event, we invite you to visit our T4 Human Physiology Conference page.

Looking for additional resources, tips, tricks, and expert advice on BIOPAC and BIOPAC Partner products? Please also visit our Webinars and Video Tutorial pages.


BIOPAC offers a wide array of wired and wireless equipment that can be used in your research. To find more information on solutions for recording and analyzing signals such as ECG, heart rate, respiration and more using any platforms mentioned in this blog post, you can visit the individual application pages on the BIOPAC website.


Best Practices for Recording & Analyzing Data

Over the past several years, tools and techniques for recording and analyzing physiological data recording have seen steady and marked improvement. Modern life science data acquisition systems such as the MP160 System and powerful research-grade software suites such as AcqKnowledge bring high-end physiology tools within reach of the smallest lab. Even with continuing advances and reduced margin for error, it remains prudent to follow some fundamental guidelines for maximizing data quality and clarity.

Preparation is important. First, invest time exploring the system if it’s new or unfamiliar. An overview of the documentation, training videos, and available webinars, as well as some practice runs with the hardware and software will save time and effort when the time comes to conduct a study. This will also build proficiency at identifying the differences between good and poor data.

Next, familiarize yourself with the type of electrodes and/or transducers necessary for the physiological signals you will be acquiring, which includes proper electrode and skin site preparation. For example, gently abrading the skin prior to applying electrodes is normally recommended for most signal types, except for electrodermal activity (EDA), in which case it’s vital to NOT abrade the skin beforehand. It is also helpful to wait at least 5 minutes before starting a recording, which enables the electrode gel to be absorbed into the skin, helping reduce the impedance.

Performing an impedance check to ensure that the electrodes are making good contact with the skin is also highly recommended. This task is made easier by using an Electrode Impedance Checker (such as EL-CHECK), a simple device for quickly measuring the resistance between the skin and the electrode that provides an LED readout of the skin/electrode contact quality. If the resistance is too high (indicating poor contact) proper adjustments can be made before starting an experiment.

For certain signal types, excessive participant movement can introduce unwanted artifact into the signal, resulting in poor or skewed data. Make sure the participant remains as still as possible during studies involving these signals. Using tape to attach the electrode leads to the skin and keep them from moving excessively can also be helpful.

A thorough check of the system and all connections, cameras, and other hardware is important, so that any problems with equipment or setup can be addressed in advance, thus avoiding a show-stopping issue in the midst of an experiment. This would include performing a pilot study with trained personnel in order to head off any unforeseen issues with the data collection.

Creating a lab setup conducive to a relaxed environment for the participant and technician alike will yield better results. This means eliminating clutter, noise, and other distractions that can affect comfort and attention span. Some labs even avoid having their staff wear lab coats because this can heighten participant nervousness.

Keeping detailed notes on successful lab setups is also helpful and will streamline the preparation process for future experiments. Additionally, creating and saving graph templates for regularly-repeated experiments will save further time and effort.

For more about the fundamentals of recording great data, we invite you to view this free on-demand webinar Fundamentals of Physiology Recording.


BIOPAC offers a wide array of wired and wireless equipment that can be used in your research. To find more information on solutions for recording and analyzing signals such as ECG, heart rate, respiration and more using any platforms mentioned in this blog post, you can visit the individual application pages on the BIOPAC website.

Photo by John Schnobrich on Unsplash

fNIRS Systems—a NIR miracle

At the dawn of the 19th century, pioneering astronomer Sir William Herschel discovered the existence of infrared radiation, which is electromagnetic radiation invisible to the human eye but identifiable via its ability to heat objects. Infrared radiation is commonly divided into three categories, near, mid, or far infrared waves. In ensuing years, infrared radiation was found to be useful for industrial, scientific, military, and law enforcement applications, such as heat signature tracking and night vision goggles. Over two decades ago, a new technology called near infrared spectroscopy (NIRS) was developed for non-invasively measuring specific aspects of human physiology using near infra-red waves. While far infrared waves lie closest to the microwave region, near infrared waves are closest in length to the visible light part of the electromagnetic spectrum, and are microscopic in size. Unlike far infrared waves, near infrared waves do not produce any heat. In fact, we can’t feel them at all. They are the small waves used by common devices such as a
remote control.

Today, near infrared waves are commonly used  for studying many application areas of human physiology, notably by the fNIRS Imaging Systems to gather precise, high-density brain function and muscle oxygenation data.

How does fNIRS work with regard to human physiology? It’s an optical technology which sends light into the tissue and records the light that scatters back via a photo-diode and sensor attached to the subject. The fNIRS continuous wave technology uses an optical window in the near infrared spectrum that enables light to pass through. For example, when you hold your hand in front of a strong white light, the tissue can appear red and almost translucent. fNIRS shines light into the skull or muscle tissue, and using special detectors, records the resulting light scatter that returns to the surface.  The light penetrates skin, bone, and alights on the brain before its return trip to the surface detectors, and accomplishes this painlessly without heat. In fact, the subject does not even feel the near infrared energy and the light is harmless. The result is startling images and functional data of the brain at work. The fNIRS Systems (ranging from Educational to High-Density versions) include fNIRsoft software for processing, analyzing and visualizing functional near infrared (fNIR) spectroscopy signals through a graphical user interface. Additionally, the fNIRS Systems work with the BIOPAC MP160 Research System and AcqKnowledge software in conjunction with other physiological signals such as ECG, respiration, cardiac output, blood pressure, electrodermal activity, and stimulus response markers. AcqKnowledge software also provides automated analysis tools for event related potentials and ensemble averaging.

fNIRS brain function application areas include workload assignment, VR,  stress, attention, geriatrics, economics, ergonomics, learning and performance, sports science, HCI, pain perception, and cognitive workload – low or high.

fNIRS Systems can also be used to measure muscle oxygenation data, including oxidative capacity, muscle load, lateral imbalances (left vs. right muscle group) oxygenated hemoglobin and de-oxygenated hemoglobin in muscle activity.

We invite you to enjoy a comprehensive free fNIRS webinar and to visit our fNIRS products page.

BIOPAC offers a wide array of wired and wireless equipment that can be used in your research. To find more information on solutions for recording and analyzing signals such as ECG, heart rate, respiration and more using any platforms mentioned in this blog post, you can visit the individual application pages on the BIOPAC website.
Getting the Bands Back Together – Components of the EEG Signal

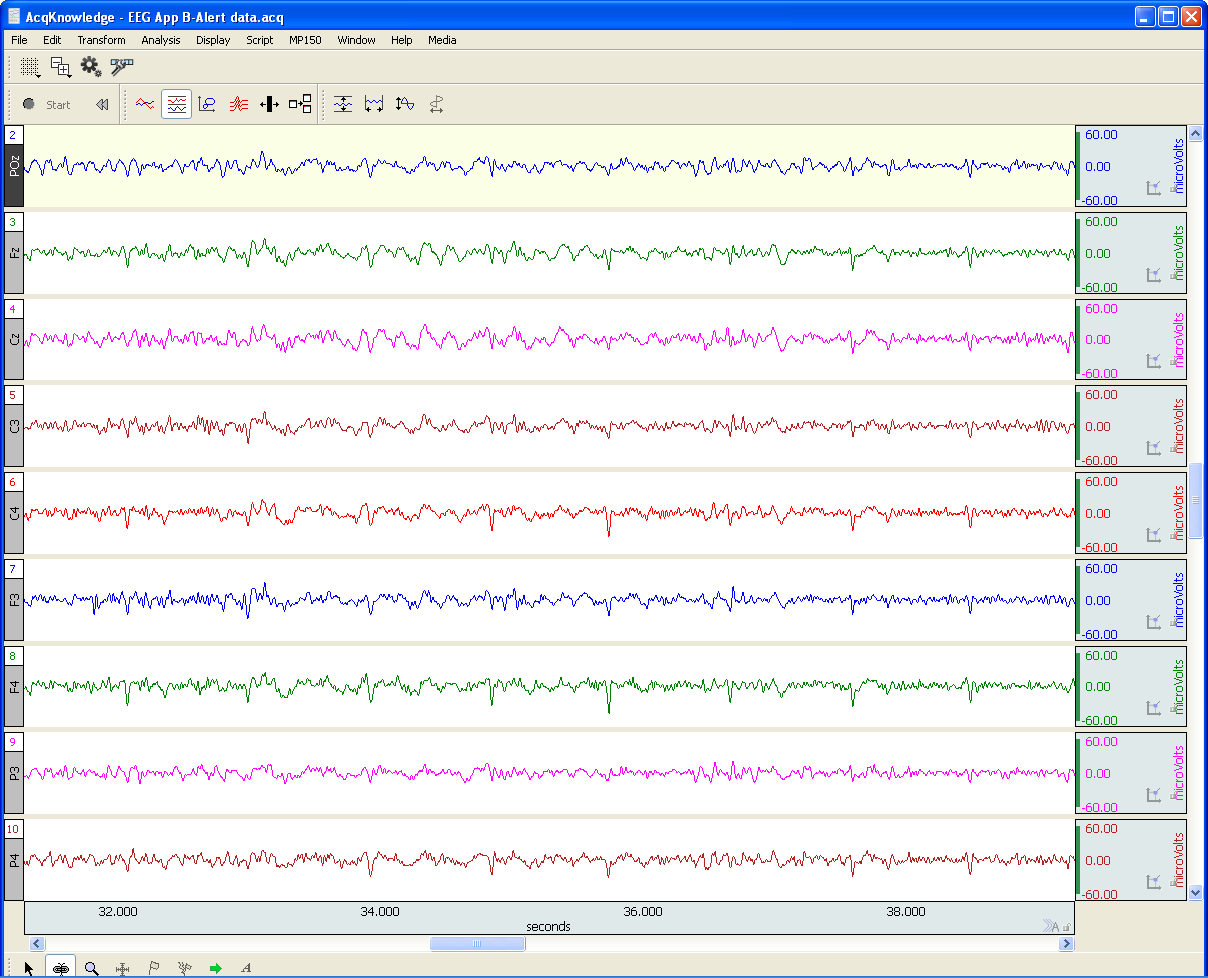
Many notable events occurred in 1929, not all of them good. The St. Valentine’s Day massacre. The stock market crash that triggered a worldwide economic crisis. The chain saw was invented. Not much good was happening in Germany either. Rampant inflation, the decline of the Weimar Republic, and the implacable rise of Nazism. But 1929 was also the year that German physician Hans Berger made an important scientific discovery that continues to influence how we study the human brain today. Dr. Berger discovered that electrodes placed on the human scalp could detect various patterns of electrical activity. After further study confirmed that these patterns were indeed related to brain activity and not mere scalp muscle artifact, scientists began to delve into the constructs of these “brain waves.” Today, electroencephalography (EEG) is still the primary method employed for recording brain function. In medical and basic research, correlation of particular brain waves reveals valuable information about sleep phases, emotional states, psychological profiles, and other mental activities. Much of this information is derived from five simple periodic rhythms, or frequencies, recorded in the EEG signal—alpha, beta, delta, theta, and gamma waves. These frequencies are known to be associated with specific degrees of alertness, affect, emotional states, and sleep. What do these frequency bands tell us about what is going on behind the gray matter? Allow us to introduce the band members.

Alpha (8-13 Hz) – Mellow Band Member

Alpha waves are associated with relaxation and calm. In general, the alpha rhythm is the prominent EEG wave pattern of adult subjects who are awake, but relaxed with eyes closed. Each region of the brain has a characteristic alpha rhythm but alpha waves of the greatest amplitude are recorded from the occipital and parietal regions of the cerebral cortex. In general, alpha wave amplitudes diminish when subjects open their eyes and are attentive to external stimuli, although some subjects trained in relaxation techniques can maintain high alpha amplitudes even with eyes open.

Beta (13-30 Hz) – Band Manager

Beta waves are related to memory, focus, and problem-solving. beta rhythms occur in alert individuals who are attentive to external stimuli, or exerting specific mental effort. Paradoxically, beta rhythms also occur during deep REM sleep. Beta waves may also be associated with “remembering” or retrieving memories.

Delta (1-5 Hz) – Supportive Band Member and Theta Rhythm (4-8 Hz) – Creative Band Member

Delta and theta rhythms are low-frequency EEG patterns that increase during sleep in the normal adult. Delta waves are associated with rejuvenation of the body through restorative deep sleep. Theta waves are more aligned with creativity and emotional connection. As people move from lighter to deeper stages of sleep (prior to REM sleep,) the occurrence of alpha waves diminishes and is gradually replaced by the lower frequency theta and then delta rhythms.

Although theta and delta rhythms are generally most prominent during sleep, there are cases when delta and theta rhythms are recorded from individuals who are awake. For example, theta waves will occur for brief intervals during emotional responses to frustrating events or situations. Delta waves may increase during difficult mental activities requiring concentration. In general, the occurrence and amplitudes of delta and theta rhythms are highly variable within and between individuals.

Gamma (> 32 Hz) – Perceptive Band Member

Gamma waves bring to the party cognition, information processing, learning, memory, and perception. Gamma waves were largely overlooked before the development of digital electroencephalography, as analog electroencephalography is restricted to recording and measuring rhythms that are usually less than 25 Hz.

A gamma wave is considered to be the “fastest” brain activity. The prominence of this wave leads to anxiety, high arousal, and stress. In optimal conditions gamma waves help with attention, focus, binding of senses (smell, sight, and hearing), consciousness, mental processing, and perception.

Research studies reported that gamma activity is involved in attention, working memory, and long-term memory processes, although excessive Gamma activity is also involved in psychiatric disorders such as schizophrenia, hallucination, Alzheimer’s disease, and epilepsy.

So in a sense, the periodic rhythms alpha, beta, delta, theta, and gamma, like the members of a tight musical ensemble, have distinct but overlapping roles for enabling the human brain to achieve wondrous things great and small that are often taken for granted.

BIOPAC Systems, Inc offers the following solutions for recording and analyzing EEG signals for research and education applications.

MP160 System with AcqKnowledge Software
EEG100D Smart Amplifier
EEG100C Amplifier Module
EEG100C-MRI Amplifier Module
BioNomadix Wireless EEG
BioNomadix Smart Center
Mobita 32-Channel Wireless EEG System
B-Alert Wireless EEG with Cognitive States Software
EPOCH Wireless In Vivo Neural Recording Systems—longterm EEG for rats, mice, or pups
Biopac Student Lab Systems—with EEG I, EEG II, and Hemispheric EEG lessons

We also invite you to enjoy our library of free EEG webinars on our Webinars page.

Why Smart Technology Is Smarter

Physiological research studies require a great deal of focused expertise, including an ability to properly set up all necessary equipment for the study at hand. This has long consisted of overseeing a host of manual hardware connections and software settings, and mistakes can be frustrating. The good news is most users become proficient at these detailed configurations, but wouldn’t it be a welcome change if these setups were easier? Think about how helpful it would be if the hardware and software were “smarter” and actively worked on your behalf. This is now a reality with the smart technology offered by BIOPAC’s newly-released line of 100D Smart Amplifiers.

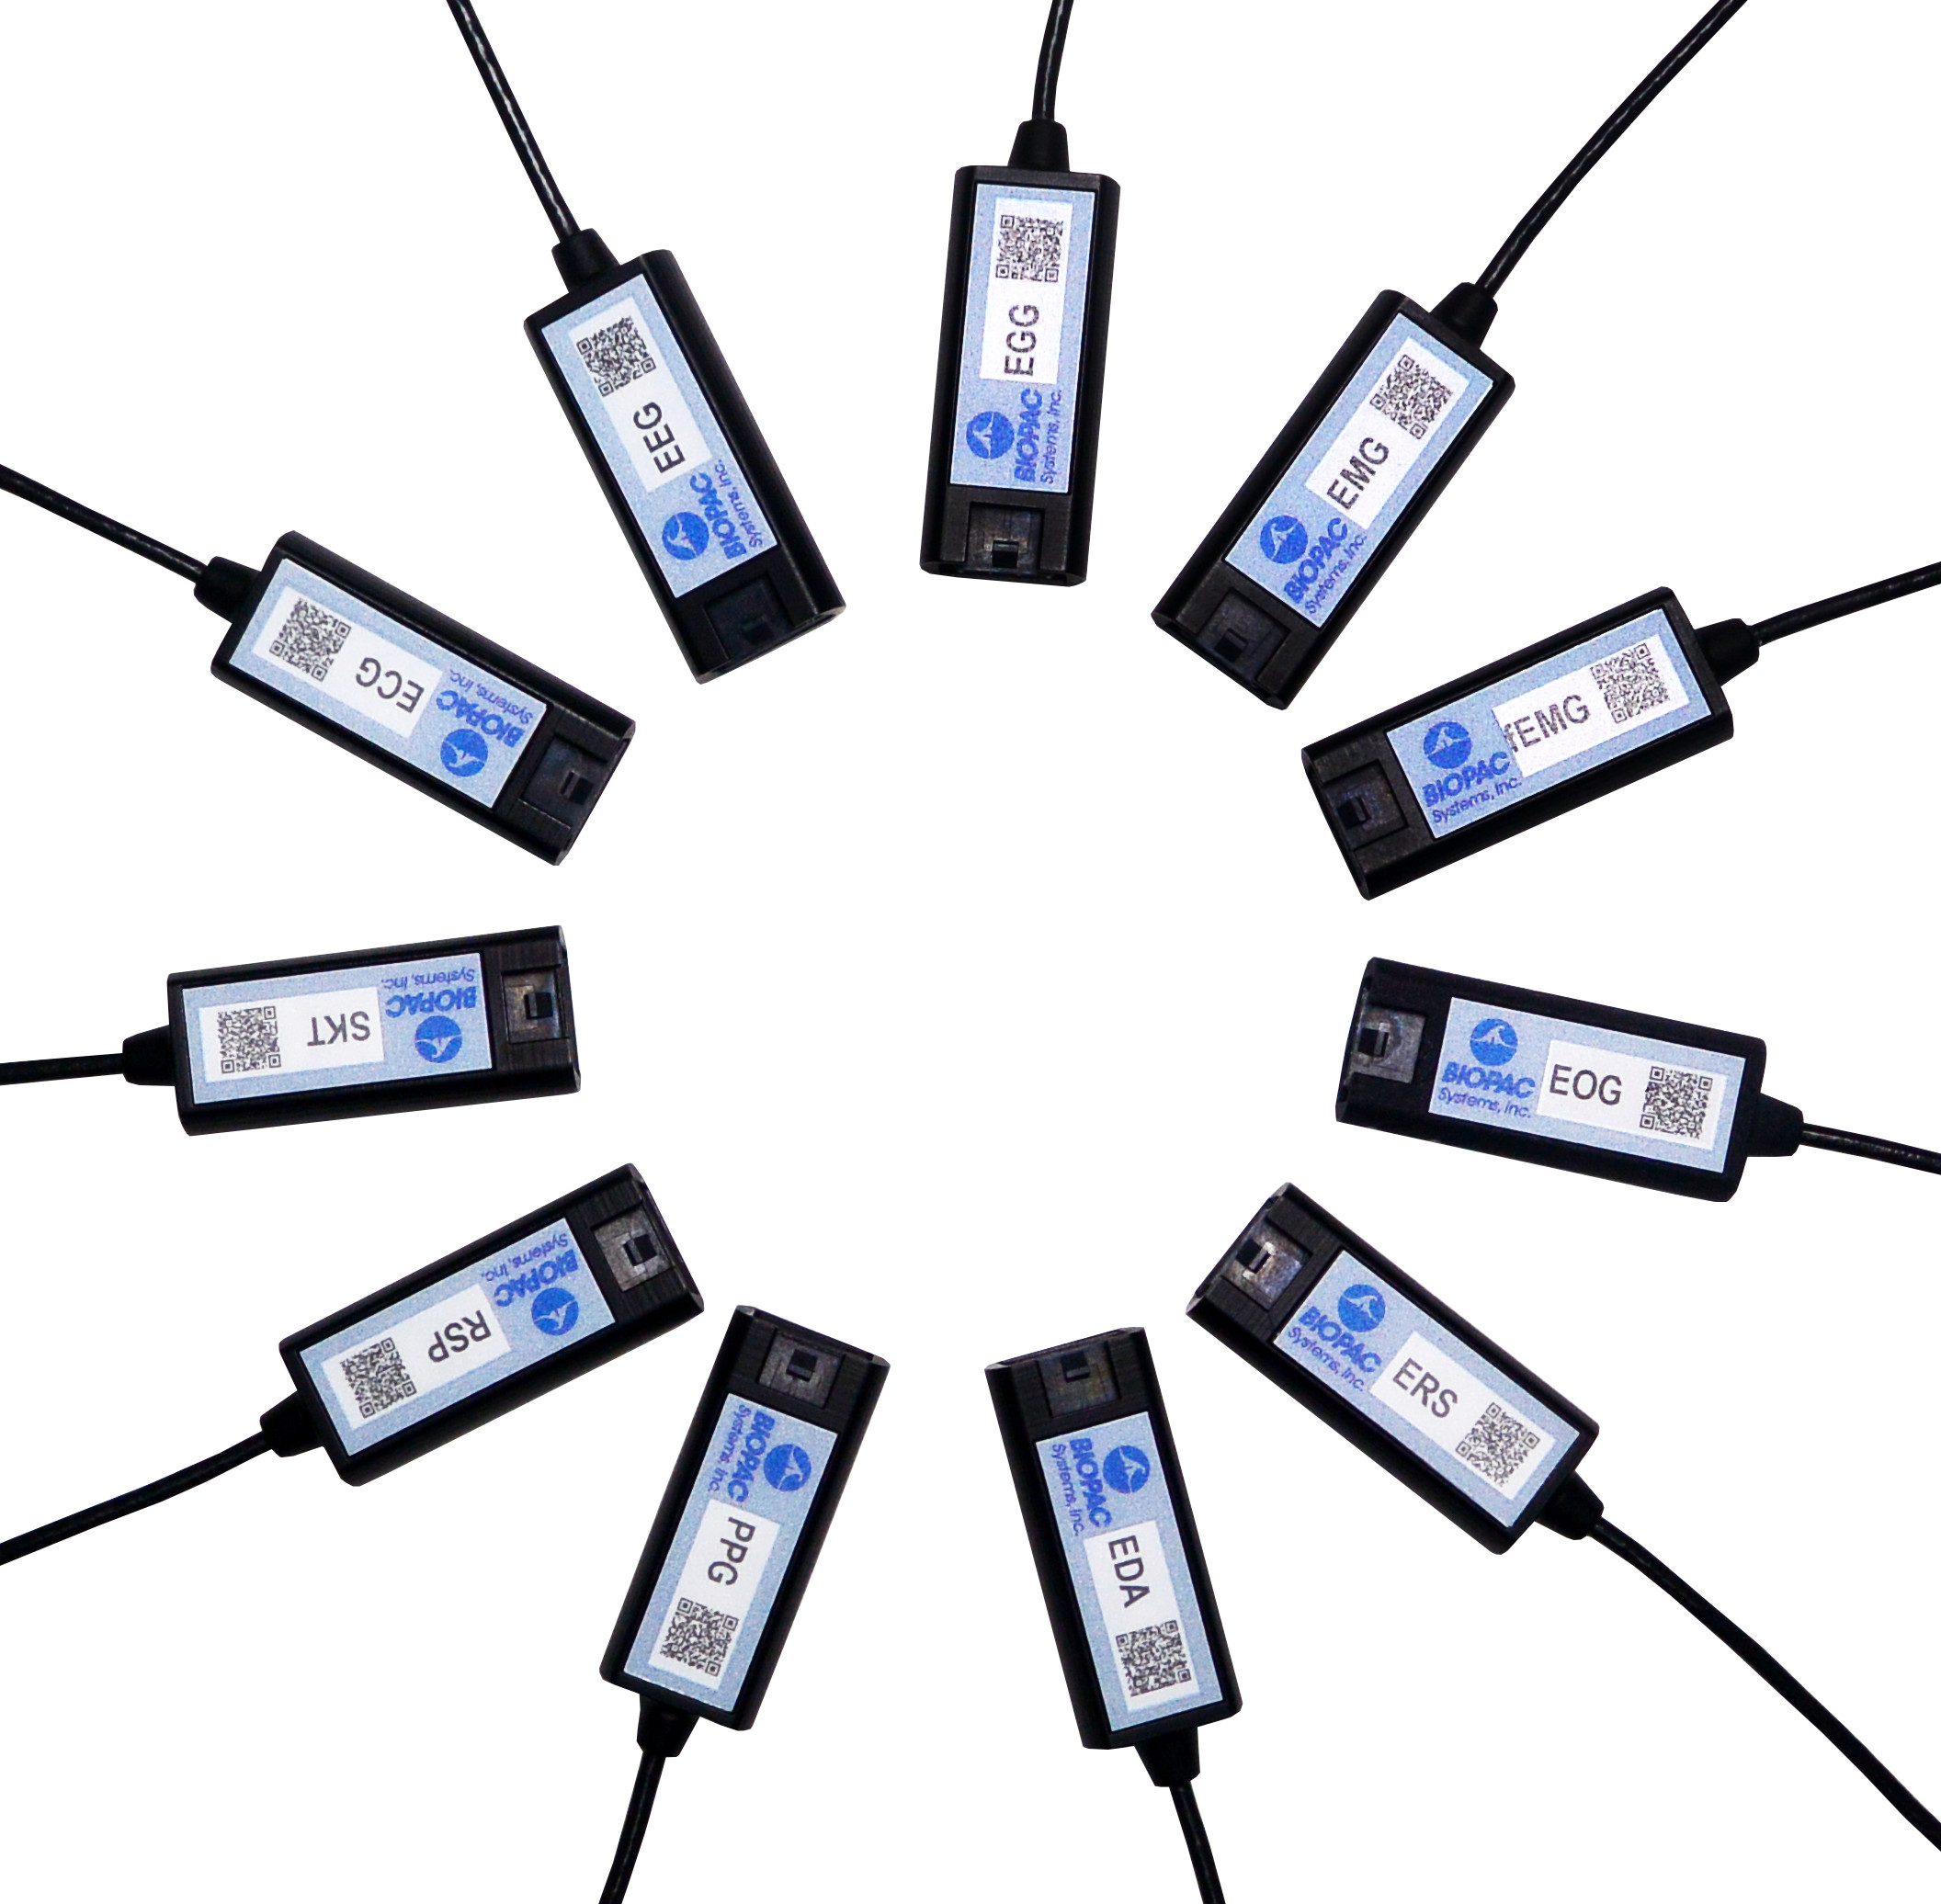
What is smart technology and what makes Smart Amplifiers smarter? To begin with, these amplifiers are significantly smaller than standard amplifiers (only 4.6 mm in length) and have no buttons or switches. The convenient lightweight design is a powerful benefit, enabling these amplifiers to be attached closer to the participant’s body. Because the amp itself is positioned near the signal source(via a lightweight 3-meter cable), the resulting data is of superbly high quality, with less noise and artifact than conventional amplifiers. But let’s get to the smart part. The smart technology in Smart Amplifiers enables them to do the setup work for you. Each Smart Amplifier, regardless of signal type,  self-configures to the optimally recommended settings, negating the need for user-defined adjustments or monitoring of physical switch positions. Simply plug the amplifier into the new AMI100D Input Module now included with every BIOPAC MP160 System, launch the AcqKnowledge software, and begin recording data.

To minimize setup time and errors in the lab, Smart Amplifiers utilize auto-detection and auto-identification technology. Not only do they self-configure, they also alert you (via a software dialog) whether the amplifier is connected to the correct channel. So basically, using Smart Amplifiers right out of the box is a three step process. 1) connect the amplifiers, 2) select any desired calculation channels for derived signals, 3) click Record. That’s it.

Frequently-used calculation channels or transformations are pre-configured for all signals and can be enabled by simply checking a box in the amplifier’s software UI. (For example, the ECG100D Smart Amplifier offers options to add heart rate and/or R-R interval, and will automatically place these derived signals in a separate calculation channel in the AcqKnowledge graph.)

Smart Amplifiers are available for the following signals: ECG, EEG, EGG, EDA, RSP, PPG, ERS, EOG, SKT, EMG and new fEMG (facial and small muscle).

Significantly smaller footprint, simple setup, unparalleled user comfort, superlative data quality, compatible with previous-generation BIOPAC amplifiers (such as 100C and BioNomadix Series), portable and lightweight, Smart Amplifiers will be an epiphany for your research.

To see Smart Amplifiers in action, we invite you to watch our free on-demand webinar New Smart Technology for the Lab.

BIOPAC offers a wide array of wired and wireless equipment that can be used in your research. To find more information on solutions for recording and analyzing signals such as ECG, heart rate, respiration and more using any platforms mentioned in this blog post, you can visit the individual application pages on the BIOPAC website.

Small and Smaller – Untethered and Unfettered

Advancements in the engineering of data acquisition components have closely paralleled the microchip revolution. Ever-smaller form factors available in wireless transmission formats have resulted in a boon for researchers wishing to collect high-quality physiological data from participants in unfettered environments undreamed of a few years ago.

One of the linchpins of these cutting-edge systems is BIOPAC’s BioNomadix Series of wireless life science transmitters and receivers. BioNomadix modular receiver/amplifiers connect to the mother ship of the acclaimed MP160 System while the bite-sized matched transmitters attach to the participant, or comfortably nestle in a garment such as the BioNomadix BIOSHIRT. Unobtrusive specially designed leads connect to skin electrodes affixed to the participant, and BioNomadix units relying on transducers (such as respiration and skin temperature) offer equal convenience.

An even more streamlined system, the BioNomadix Smart Center, is also available. This system combines BioNomadix transmitters with the Smart Center all-in-one receiver and data acquisition unit. The soap bar-sized Smart Center connects to a computer USB port and supports up to 9 channels of physiological data from up to three wireless BioNomadix transmitters. (All BioNomadix transmitters are supported but connection is limited to three at a time.)

BioNomadix transmitters are dual-channel or dual-signal, with the exception of the Accelerometer, which supports three channels (X, Y, and Z axes).

Acquired signals are of extremely high quality and clarity and are rendered in AcqKnowledge Research Software. BioNomadix systems are available for fourteen body signal types, including ECG, RSP, PPG, EDA, EOG, EEG, EMG, EGG, ACCL, SKT, Goniometer, Dynamometer with EMG, Cardiac Output, and Heel-Toe Strike.

What does all of this mean to the researcher? Nearly unlimited freedom of movement at distances up to 10 meters from the receiver units—opening up new avenues of research and even new vistas in artistic expression.

A stunning and eclectic example of the latter can be taken from this brief performance by Compagnie Linga, a contemporary dance company based in Lausanne, Switzerland. Dancers wore BioNomadix accelerometers to record transmit their movements in real time, which were then digitally rendered in sound. The result is a tableau of dance and self-generated musical accompaniment, an artscape created from the firings of human physiology.

For more information about BioNomadix, please see:

BioNomadix Wireless Amplifiers

BioNomadix Wireless EMG for Neuro-Controlled Prosthetic

Free On-Demand Webinar – Recording Great Data from Exercising and Mobile Subjects

BIOPAC offers a wide array of wired and wireless equipment that can be used in your research. To find more information on solutions for recording and analyzing signals such as ECG, heart rate, respiration and more using any platforms mentioned in this blog post, you can visit the individual application pages on the BIOPAC website.

Tips for implanting rodent pups with the Epoch wireless recording system

Implanting pups can be tricky, yet their value as neonatal models of human disease is key.

Tips for implanting rodent pups with the Epoch wireless recording system

The Epoch system enables recording 2 or 4 channels of EEG from neonatal rodents as young as postnatal day 10 (P10) in mice and P6 in rats using the 2-week transmitter. Implanting pups can be tricky—their skulls are very thin and the small size of the animals is difficult to work with. Yet, their value as neonatal models of human disease is key to developing new therapies or understanding neural dysfunction at such an early age.

Our experience has led to the following tips for maximizing the success of implanted pups:

  1. Allow pups time to recover. Although recordings can commence immediately, we recommend waiting 24 hours before commencing recordings to allow a fuller recovery.
  1. Limit recording time. Recording from rodent pups should be limited to about 2 h at a time, preferably in a temperature- and humidity-controlled incubator.
  1. Keep pre-weened pups in their dam’s presence as often as possible. Pups rely on the dam for complete care.
  1. Cull the litter to 4-6 pups. The dam may have issues with pups that are overly cold, not feeding often enough, or simply due to the presence of the transmitter.
  1. Implant all pups. It may be helpful to implant all pups in a litter either with Epoch transmitters or sham transmitters (sham transmitters are available, contact us).
  1. Use chew toys to prevent damage from the dam. Chew toys, such as nylabones, may help prevent the dam from chewing on the transmitters.
  1. Mind the state of the dam. Ultimately, the health and disposition of the dam may affect how she tolerates pups implanted with the Epoch transmitters.

Epoch, the smallest wireless EEG transmitter system available, is provided by BIOPAC to make quality EEG recordings from an early age possible. The Epoch transmitter is simply implanted to the skull of the animal with medical cyanoacrylate, requiring no bone screws. Surgery is quick and simple, requiring a small incision on the scalp, removal of the periosteum with 1% hydrogen peroxide, drilling small holes for the electrodes using a burr-type drill, implanting the transmitter, and re-absorbable sutures.

For more information on BIOPAC’s wide range of tools for recording, displaying, and analyzing EEG signals from human and animal subjects, including automated EEG analysis, seizure detection, evoked responses and many others, visit BIOPAC’s EEG Analysis page or view BIOPAC’s full line of electrodes, amplifiers, and wearable, wireless transmitters and loggers.

BIOPAC Systems, Inc. provides life science researchers and educators with data acquisition and analysis systems that inspire people and enable greater discovery about life. Visit us at www.biopac.com.

Electrodes for Physiological Recording

By Alan Macy, BIOPAC Systems, Inc.

In the context of human physiological recording, an electrode is a conductive probe which is used to sense the presence of biopotentials arising at points in the body. When biopotentials are generated in the body, they can be sensed using a differential voltage amplifier. When a biopotential source activates, electrons are moved within the volume of the source thus creating a voltage potential difference (positive to negative) across the volume of the source. Biopotential sources are continually changing in the body, so the associated differential voltage potentials change too.

Electrodes establish an equipotential area when attached to a location on or in the body. An equipotential area means that anywhere on the surface area of the electrode the potential (voltage) will be the same. This is because electrodes are substantially more conductive than the surrounding tissue. To record a biopotential signal, two electrodes are required. The pair of electrodes will measure the voltage which is impressed between the two equipotential areas created by the electrodes.

Biopotential recording electrodes are of two types, namely invasive and noninvasive. Invasive electrodes are designed to sense biopotentials inside the body, meaning they are inserted inside the body, past the skin boundary. Historically, invasive electrodes have been designed as needles or wires to better penetrate the skin. By controlling the conductive and insulating areas of the needle or wire, the electrode can be used to sense biopotentials originating at any depth in the body volume. If the invasive electrode is to be inserted into the body for a long time, then the electrode might take a different shape, such as a conductive disk which can be sutured into place.

Noninvasive electrodes are designed to sense biopotentials which manifest on the outside skin surface. These kinds of electrodes do not penetrate the skin surface layer. Because the body is a volume conductor, biopotentials originating anywhere in the body travel to the entire skin surface area. As an example, a polarized biopotential wave is generated by the heart during the course of each beat. This signal is easily detectable between any two locations on the body’s skin surface that are physically oriented to different sides of the heart.

In practice, it’s best to collect biopotential data as near to the biopotential generating site as possible for the best recording. This is because the body generates a large number of biopotential signals, sourced from a variety of excitable cells. Because the body is conductive, a myriad of these signals will superimpose at any body recording location. As the distance grows between a particular source and the differential recording location, the source signal attenuates. Sources, that are subject to a range of attenuation, will simply add to the desired signal being measured, as they are included in the volume conduction path defined by the differential biopotential recording.

When collecting biopotential data from surface electrodes, the contact area of the electrode has an impact on the frequency and amplitude components recorded in the biopotential. Because the body volume is relatively conductive, increased electrode surface area has a tendency to reduce biopotential amplitudes and suppress higher frequency components. This happens because multiple, and often uncorrelated, biopotential sources in the body can act in random opposition as the various biopotentials superimpose in the conductive body volume and then express on the skin surface. A biopotential averaging process takes place in the body tissue volume and an aspect of the averaged signal is reflected on the skin surface area. This biopotential signal averaging quality increases in scope as the size the measurement surface electrodes increases.

If a biopotential electrode is reduced in size and then inserted into the body near the location of interest, then measured signals will typically increase in amplitude and frequency components. These kinds of electrodes are called needle or wire electrodes and typically have an insulating needle shaft with a conductive tip. Despite certain benefits of needle electrodes, complications can arise when breaking the skin barrier and inserting foreign objects into a subject’s body. Needle electrodes can be difficult to use because they have smaller surface area than surface electrodes. Furthermore, smaller contact surface area always means that the electrode contact impedance is higher. Very high contact impedance, typically in excess of 1 Mohm, specifies the need for excellent lead shielding and specialized input amplifier characteristics.

Biopotential measurements from surface electrodes on the body have material harmonic content of less than 500 Hz. Nearly all of the signal power which can be collected from surface electrodes is between DC and 500 Hz. If the electrode is smaller, such as a conductive-tipped needle, and inserted through the skin surface to near the biopotential of interest, biopotential signal frequencies can exceed 10,000 Hz.

For more information on BIOPAC’s wide range of tools for recording, displaying, and analyzing biopotential measurements from human and animal subjects, visit BIOPAC’s electrocardiograpy, electromyography,  or electroencephalograpy pages and view BIOPAC’s full line of electrodes, amplifiers, and wearable, wireless transmitters and loggers.

BIOPAC Systems, Inc. provides life science researchers and educators with data acquisition and analysis systems that inspire people and enable greater discovery about life.  Visit us at www.biopac.com.

Electroencephalography (EEG) Pt. 2

Short-term Electroencephalography or EEG measurements are typically performed in synchrony with well-controlled, environmental, stimuli. Signal-averaging measurements, of this type, are known as Event Related Potentials (ERPs).

By Alan Macy, BIOPAC Systems, Inc.

This blog is a continuation of the previous discussion of Electroencephalography or EEG. Short-term Electroencephalography or EEG measurements are typically focused on the nature of cognition. These types of recordings are typically performed in synchrony with well-controlled, environmental, stimuli. Signal-averaging measurements, of this type, are known as Event Related Potentials (ERPs). There are a range of ERP signals, stretching between 50 ms to many seconds, with respect to the occurrence of the event. ERPs require signal averaging methods, to be observed, because their amplitude levels (0.2-2 uV) are usually lower than the ambient EEG signal level.

ERPs can be generated by a wide range of stimuli. The stimulus event can be targeted to any specific human sense or combination of senses (auditory, visual, olfactory, touch or taste). ERPs indicate the superimposed potentials of neuronal activity that synchronously generate when a subject processes sensory information. There are two general types of human subject ERPs. Early ERP wave components occur before 100 milliseconds after the stimulus. Late ERP components occur after 100ms after the stimulus. Early ERPs are known as exogenous potentials and late ERPs are known as endogenous potentials. Exogenous potentials depend on neuronal sensory structure responses that occur prior to cognition.  Endogenous potentials depend on cognitive responses to the sensory stimuli.

Slow Cortical Potentials (SCPs) are a class of ERPs that are characterized by slowly-moving, stimulus-related changes in the EEG signal. SCPs originate in cell concentrations in the top cortical layer of the brain. SCP waves (0.01-3 Hz) are EEG signals that occur before and after stimulus presentation. They encompass such pre-stimulus measures as Contingent Negative Variation (CNV) and Readiness Potential (RP).  The CNV is a slow-changing negative potential that happens between an initial warning and a “go” stimulus.  NV amplitude depends on the subject’s expectation of an imagined, forthcoming event. The RP is associated with the beginning of movement.  The RP precedes movement and is identified as a slow-changing negative potential that maximizes with movement onset. The RP is observed when signal averaging the EEG, from the motor cortex, synchronously with movement.

EEG can be useful to:

  • Monitor alertness and conscious states
  • Evaluate inhibitory control over behavior
  • Locate areas of neural damage
  • Establish levels of cognitive engagement
  • Investigate brain disorders, such as Alzheimer’s, epilepsy and seizures
  • Establish brain / computer interfaces
  • Monitor sleep

For more information on BIOPAC’s wide range of tools for recording, displaying, and analyzing EEG signals from human and animal subjects, including automated EEG analysis, seizure detection, evoked responses and many others, visit BIOPAC’s EEG Analysis page or view BIOPAC’s full line of electrodes, amplifiers, and wearable, wireless transmitters and loggers.

BIOPAC Systems, Inc. provides life science researchers and educators with data acquisition and analysis systems that inspire people and enable greater discovery about life.  Visit us at www.biopac.com.

Electroencephalography (EEG) Pt. 1

An EEG recording can be short or long-term. Shorter-term, signal-averaged, EEG measurements are typically used to evaluate precognitive and cognitive processes with respect to specific stimuli.

by Alan Macy, BIOPAC Systems, Inc.

EEG or Electroencephalography is the measurement of differences in electrical potential (voltage) between points on the scalp. These voltages differences are the result of ionic current flow within neurons, and glial cells, in the brain. The measured scalp voltages are primarily in the 200 nV-200 uV amplitude range, 0.01 Hz – 100 Hz frequency range, and are typically simultaneously recorded at multiple sites on the scalp. The EEG is usually collected using the 10-20 electrode montage. This arrangement of electrodes typically references left or right hemisphere electrodes to the left or right earlobe (or mastoid), respectively. However, a wide range of signal referencing methods are used depending on the situational requirements.

An EEG recording (knows as an electroencephalogram) can be short or long-term. Shorter-term, signal-averaged, EEG measurements are typically used to evaluate precognitive and cognitive processes with respect to specific stimuli. These EEG signals have relatively low amplitude levels, typically 200 nV – 2 uV, so signal averaging methods are required to discern these signals from background concurrent EEG sources. Longer-term, non-signal-averaged, EEG measurements are used to discern the subject’s, real-time, conscious state. Different and observable wave rhythms are evident during such recordings. Commonly observed rhythms include: Delta, Theta, Alpha, Beta and Gamma waves. These waves can be continuously recorded and are in the range of 2 uV – 200 uV.

Delta waves (0.5-4 Hz) are considered slow rhythms and tend to be the highest in amplitude. Delta waves are normally the dominant rhythm in infants. Delta waves are found in sleeping adults and consistent Delta is considered abnormal in conscious adults.  Delta waves are low-frequency EEG patterns that increase during sleep in the normal adult.  Although Delta waves are generally prominent during sleep, there are cases when Delta rhythms are recorded from awake individuals. Delta waves may increase during difficult mental activities requiring concentration and other continuous-attention tasks. Delta rhythms depend on activity of motivational systems, in the brain, and participate in the identification of prominent phenomena.  The presence and amplitude of Delta rhythms are highly variable within and between individuals.

Theta waves (4-8 Hz) are considered slow rhythms. Theta waves are normal in children up to 13 years old.  Theta waves are found in sleeping adults and consistent Theta is considered abnormal in conscious adults. Theta rhythms are low-frequency EEG patterns that increase during sleep in the normal adult. Although Theta rhythms are generally prominent during sleep, there are cases when theta rhythms are recorded from awake individuals.  Theta rhythms are involved in memory and emotional regulation. Theta waves will spike during emotional responses to frustrating events or situations.  Theta waves are associated with the inhibition of elicited responses, in that Theta activity has been found to temporarily increase when a person is actively trying to repress a behavioral response. The presence and amplitude of theta rhythms are highly variable within and between individuals.

Alpha waves (8-13 Hz) are considered moderate rhythms and usually seen in the occipital regions of the head and are higher in amplitude on the dominant side. Alpha waves appear when relaxing and closing the eyes. Alpha waves are suppressed when opening the eyes or coming to an alert state. Alpha waves are the primary rhythm observed in relaxed adults and are present during most of life after 13 years old. Each region of the brain has a characteristic Alpha rhythm amplitude and the largest Alpha waves are from the occipital and parietal regions of the cerebral cortex. Alpha rhythms correlate with inhibitory processes in the brain. Reduced Alpha wave occurrence and amplitude, in relation to Delta-Theta activity, is associated with reduced inhibitory control over behavior.

Beta waves (13-30 Hz) are considered fast rhythms. Beta waves are typically observed on both sides of the head and are most evident frontally (executive function). Beta waves may be substantially reduced in areas of cortical damage.  Beta waves are considered normal and are the dominant rhythm in subjects whose eyes are open or are otherwise attentive to external stimuli or exerting specific mental effort. Beta rhythms also occur during rapid eye movement (REM) sleep. In this situation, the typical Alpha rhythm is suppressed and supplanted by Beta waves. This replacement of Alpha rhythm is called desynchronization, or “Alpha block”, because it represents a change in the synchronized activity of neural systems in the brain. It is thought that Beta waves represents arousal of the cortex to a higher state of alertness and may also be associated with memory retrieval.

Gamma waves (30-100 Hz) are considered fast rhythms. Gamma waves are present during mixed sensory processing, such as perceptual tasks that combine hearing and seeing. Gamma waves are also evident during short-term memory matching of recognized sights, sounds or sensations. A reduction in Gamma wave activity might be associated with cognitive decline, especially when compared to Theta wave activity levels.

Long-term EEG signal characteristics are related to consciousness. As conscious activity increases, the dominant EEG rhythms shift to higher frequencies. When asleep, with the exception of REM, the dominant EEG rhythms move to lower frequencies.  In deep sleep, the EEG is characterized by low frequency Delta waves.

This blog is continued in Part 2.

For more information on BIOPAC’s wide range of tools for recording, displaying, and analyzing EEG signals from human and animal subjects, including automated EEG analysis, seizure detection, evoked responses and many others, visit BIOPAC’s EEG Analysis or view BIOPAC’s full line of electrodes, amplifiers, and wearable, wireless transmitters and loggers.

BIOPAC Systems, Inc. provides life science researchers and educators with data acquisition and analysis systems that inspire people and enable greater discovery about life.  Visit us at www.biopac.com.

error: Content is protected !!