Keep Your Eye on the Ball: Eye Tracking in Exercise Research

When a coach tells a player to keep their eye on the ball, they are addressing the importance of attention and focus to success, both figuratively and literally. Whether hitting a baseball, shooting a basket, or maintaining focus in an exercise routine, how we process visual information is linked to physical and mental performance, and eye tracking is the key to unlocking this relationship.

Modern eye tracking technology is revolutionizing how researchers understand human behavior, perception, and performance during physical activity. With the rise of wearable and mobile technology, eye tracking has been freed from the confines of the lab, offering real-world insights into our exercise habits and mindset. Thanks to innovators like BIOPAC partner Argus, researchers can now access eye tracking information recorded directly from the putting green, ski slope, and even the mountain biking trail.

One of the primary applications of eye tracking in exercise research lies in understanding visual attention and gaze behavior. By tracking where individuals look while engaging in physical activity, researchers can better understand how attentional focus influences performance. For instance, studies have revealed that elite athletes exhibit more focused and efficient gaze patterns, directing their attention to critical cues that enhance their performance. A 2023 study by researchers at North Carolina State University assessed the viability of using an array of mobile physiological measurement tools, including eye tracking, to measure performance optimization techniques for rock climbers. Tools included BIOPAC monitors and transmitters for wireless tracking of skeletal muscle electromyography (EMG) and eye tracking glasses to record gaze. The study affirmed that such technologies could accurately monitor multiple athletic performance metrics in even the most challenging environments. basketball

Beyond performance enhancement, eye tracking technology holds promise in understanding the psychological aspects of exercise behavior. By examining visual attention during exercise-related stimuli such as advertisements or motivational cues, researchers can unravel the underlying mechanisms driving exercise motivation and adherence.

The same principles of eye tracking research used in fitness and physical performance-related exercise studies can be applied in other fields, such as those that examine job performance in highly stressful and physically demanding occupations, like law enforcement. A study published in the 2023 edition of the Journal of Motor Behavior explored the relationship between gaze control and decision-making by police officers in highly stressful situations. The goal was to assess how a participant’s levels of experience and training affected tactical decisions. Participants wore eye tracking glasses during a simulated traffic incident. The participants’ respiration and electrocardiogram (ECG) signals were monitored via a BIOPAC BioNomadix dual-signal wireless transmitter.  Gaze-tracking data, ECG, and respiration data were fed into a BIOPAC data acquisition system for analysis. The study found that higher levels of training “led to increased processing efficiency and effective attentional control.”

The integration of eye tracking technology into exercise physiology and psychology research offers a nuanced understanding of human behavior and performance during physical activity. With wearable and mobile solutions, this technology not only expands the possibilities of research but also holds the potential for personalized programs and the enhancement of exercise experiences for individuals across a wide range of circumstances. For more information on integrating mobile eye tracking into your exercise study, see our webinars on Recording Great Data from Exercising Subjects and Eye Tracking Glasses and AcqKnowledge Integration.


Are you planning to employ eye tracking in your next exercise study? Contact our experts for assistance in selecting the best tools for gathering and analyzing exercise data with eye tracking.
Put a Ring on It: Wearables Offer New Research Options

Rings, watches, bracelets, and belts—we think of them as indispensable fashion accessories. A bit of bling can put the finishing touch on an outfit for a night on the town, but what about a day in the lab? Wearable technology is transforming the landscape of physiology research by enabling real-time, noninvasive data collection in a variety of settings.

For many, their first introduction to the potential of wearable physiology technology came through smartwatches and fitness bracelets. These consumer electronics offer a convenient and affordable way for anyone from professional athletes to fitness hobbyists to monitor their health data, which often includes pulse, blood oxygen levels, steps, and other basic physiological signals.

As the underlying technology has become more sophisticated, researchers have embraced the convenience offered by such devices. Portable, unobtrusive, and wireless wearables have entered the research device market and now allow a range of signals to be monitored under a variety of circumstances and environments.

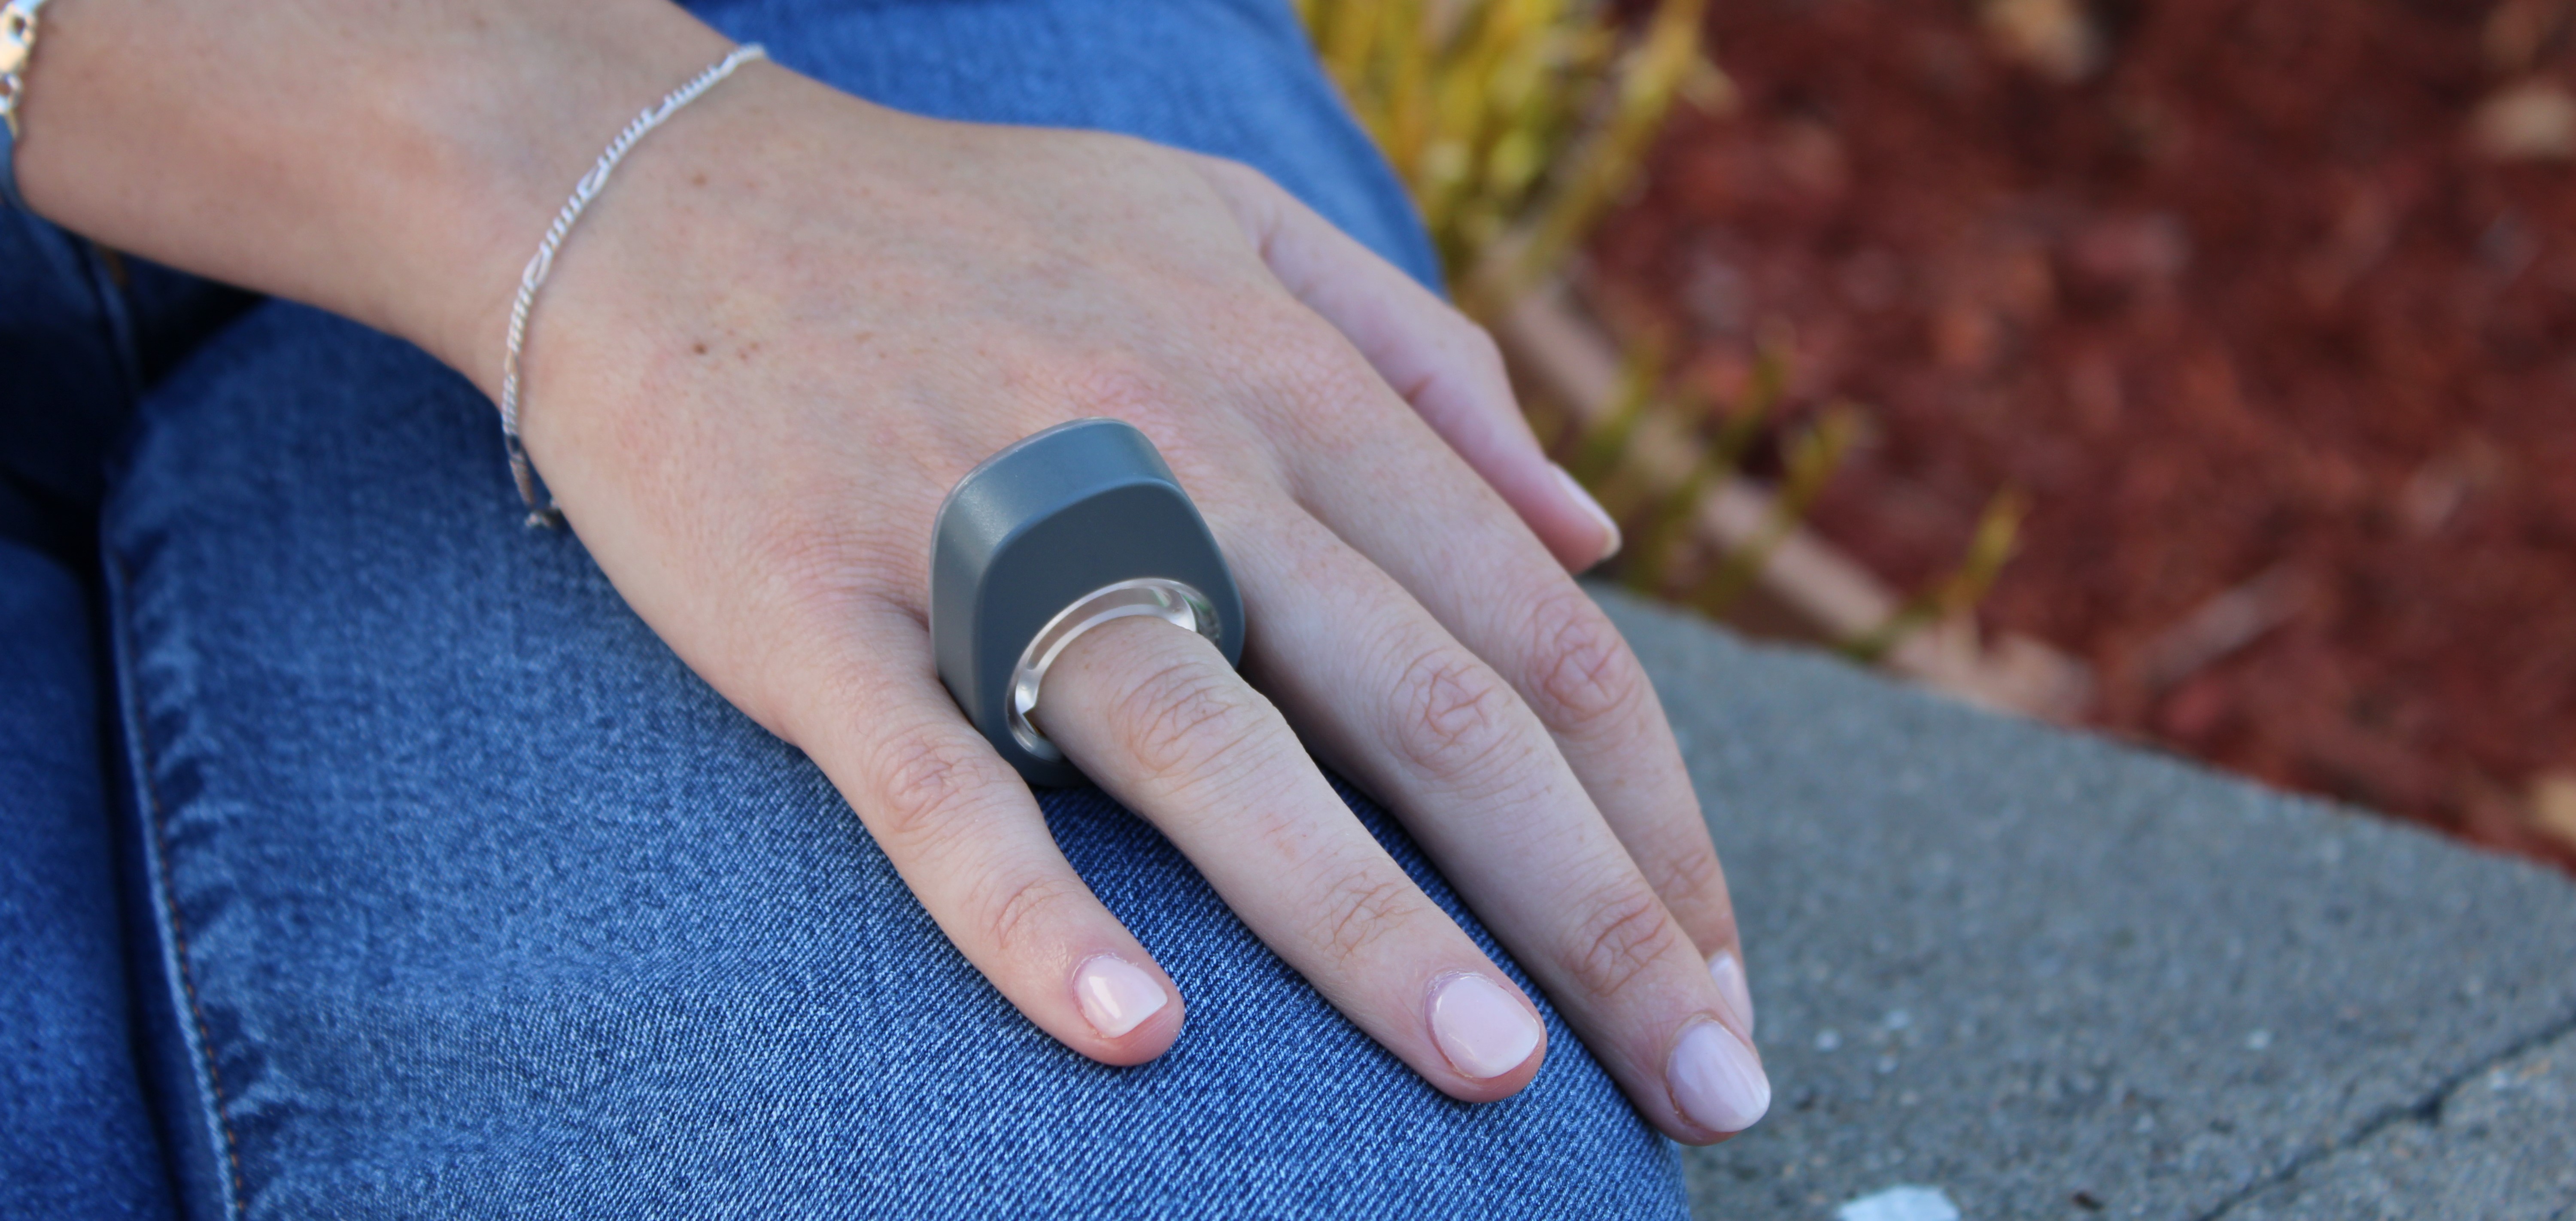
smartphoneBIOPAC recently expanded its established line of wireless devices by introducing the Research Ring, a wearable device with a specific focus on physiological signals such as Photoplethysmography (PPG), Electrodermal Activity (EDA), Electrocardiography (ECG), and body temperature. Products like the Research Ring allow the capture of high-quality data via an unintrusive and accessible wearable device, making them ideal for a wide range of potential applications. These include psychophysiology research, sports and exercise studies, sleep and stress research, and aging and wellness studies, to name just a few.

BIOPAC is no newcomer to providing the research and education communities with wireless and portable solutions designed for gathering physiological data. The Bionomadix line of wearable remote monitoring devices set the standard for such products and have been used in thousands of cited studies. For example, researchers conducting a study of on-the-job stress among healthcare professionals collected EDA and PPG signals using a BIOPAC wireless PPG and EDA amplifier and a wireless respiration with ECG amplifier. Wireless technology proved to be a key component of the study’s success as it allowed the data to be gathered without interfering with the immersive quality of the simulated work environment.

A team of researchers from the University of Porto in Portugal utilized a BIOPAC wearable physiological signal logger to collect EDA and ECG data while studying the correlation between physiological signals and expressive writing. In the study, published in the journal Experimental Psychology, participants were able to engage in writing exercises without the distraction of more cumbersome and intrusive wired solutions.

BIOPAC’s latest entry into its line of wearable wireless data collection devices promises to add greater convenience and versatility to this burgeoning sector. For more information on the new Research Ring, check out the recent webinar BIOPAC hosted with ring developer and partner, Senstream.


If you are interested in adding wearable devices to your next physiology study, reach out to your regional sales representative today to learn which BIOPAC wireless solutions are right for you.

Mind and Body: Signals to Enhance Your Psychophysiology Research

The human body and mind share an intrinsic link, both influencing and reflecting the health and general well-being of the other. Within the field of psychophysiology, researchers gain a wealth of insight into mental processes and disorders by studying physiological signals recorded from both the brain and body. Signals such as electrodermal activity (EDA), skin temperature (SKT), electroencephalogram (EEG), heart rate variability (HRV), and functional near-infrared spectroscopy (fNIRS) provide just a few of the tools helping us to better understand these mind-body interactions.

A wide range of research technologies has made these signals increasingly accessible in the lab as well as in everyday environments, allowing studies to place participants in increasingly naturalistic settings while gathering critical physiological data. In this way, researchers can provide a more accurate picture of how study participants react to stress and arousal, experience emotion, or interact within group environments.

One recent study used EDA and heart rate (HR) to examine the role of emotion in student success within computer-based learning environments (CBLE). As discussed in previous posts, a range of signals can be used to measure the body’s physiological response to emotion, otherwise known as “affect.” By gaining a better understanding of learners’ emotional responses to CBLE stimuli, researchers in this study hope to apply their data to improvements in CBLE design. EDA data was gathered from participants via SS57LA EDA leads while HR signals were collected with SS2LB shielded lead sets, both of which were connected to a BSL MP36 data acquisition and analysis system. Participants were shown imagery designed to evoke a negative emotional reaction before being asked to read a complex academic paper. The study was able to establish a link between the participants’ emotions and their comprehension of the reading material.

head with brain exposedIn another study, researchers used EDA and skin conductance response (SCR) to measure participants’ reactions to conditioned stimuli (CS) and unconditioned stimuli (US). The goal was to determine if fear-inducing memories could be modified either pharmacologically or through behavior modification to overcome fear. An MP36R System with AcqKnowledge software allowed analysis of SCR signals gathered via SS3LA finger transducers across a range of experiments designed to trigger fear-inducing memories. While the overall results were inconclusive, the SCR signals provided valuable feedback regarding the participants’ response to stimuli.

While EDA is a common thread through many of these psychophysiology studies, other signals provide researchers with a more complete and nuanced data set from which to draw their conclusions. Researchers exploring the factors influencing musical preferences combined EDA data with ECG and facial electromyography (fEMG) signals to assess how listeners reacted to familiar and unfamiliar musical stimuli. Data from all three signals were fed to an MP36 data acquisition and analysis system. The study found a strong correlation between musical preferences and familiarity with material as reflected by the subjects’ emotional responses.

These examples only scratch the surface of how psychophysiological research is being aided by an array of signals, all made accessible with available technology. To learn more about how to implement these signals in your next study, see BIOPAC’s Psychophysiology Applications webpage.


Contact your BIOPAC sales representative to learn more about the wide range of data-gathering tools available to help you construct your next psychophysiology study.

Balancing Act: HRV Provides Critical Marker for Psychophysiological Health

Two college wrestlers square off on the mat awaiting the signal that will begin their match. To the casual observer, the outcome seems impossible to predict. Their coach, however, knows one competitor has a clear advantage—a heart rate variability level (HRV) that is higher than his opponent’s. Examining HRV data provides more than insight into athletic performance, it offers a window into a broad spectrum of functions that influence psychophysiological health.

HRV balanceIn simple terms, HRV is the natural variation in the intervals between each heartbeat over time. Unlike a ticking clock, our hearts do not beat at a constant rate. As such, variations in heart rate can provide a wide range of valuable information on our bodily systems. This is because HRV represents a balancing act between our sympathetic and parasympathetic nervous systems, which together make up the autonomic nervous system. As we have discussed in previous posts, the autonomic nervous system controls nearly all the body’s involuntary functions.

The sympathetic nervous system is activated in times of stress or danger (i.e., the fight-or-flight response), during which our bodies sweat, our heart rates increase, and the interval between beats decreases. Conversely, the parasympathetic nervous system acts as a sort of switch, shutting down the sympathetic nervous system and activating a relaxed state (i.e., rest and digest). To do this, it releases acetylcholine, a neurotransmitter that makes the heart beat slower and at greater intervals.

When these two systems are in balance, they produce higher HRV through a more variable heart rate. Greater variability has been associated with the body’s ability to switch between these systems. Thus, HRV is used as a health marker, such that high HRV is associated with better cardiovascular health, mental focus, emotional health, stress management, and ability to recover from exercise, while low HRV is associated with inflammation, chronic fatigue, increased stress, depression, and chronic pain.

HRV has also been connected to willpower and is a predictor of persistence and self-control. HRV increases during periods of self-regulation sometimes called the “pause and plan response.” As such, HRV has been particularly useful in research into the mechanism associated with addiction. A 2019 study used HRV to explore how chronic pain patients treated with opioids could regulate drug cravings and depression through dispositional mindfulness. Electrocardiogram (ECG) data were sampled with a BIOPAC data acquisition unit while HRV was calculated with AcqKnowledge software.HRV chart

Because HRV plays such a critical role in physical and psychological health, several studies have investigated how to self-regulate HRV, including examining how it is affected by posture. A 2020 study used a  2-channel BSL data acquisition unit to gather ECG data to calculate HRV for a variety of bodily positions to determine their impact.

A similar study examined the link between HRV and resilience, i.e., the individual’s ability to return to stable physical and psychological equilibrium after experiencing stress. HRV calculations were made from data gathered via a BIOPAC ECG100C ECG amplifier, RSP100C respiratory amplifier, and EDA/GSR amplifier. The study identified possible trends connecting resilience factors and HRV levels during specific stress-inducing simulations.

Calculating HRV with BIOPAC hardware and software solutions provides researchers with a myriad of psychophysiological insights for their lab work. Learn more about HRV from our Knowledge Base entry, as well as application notes on data preparation for analysis and statistical and geometric measures.


For additional information on how BIOPAC can assist you with a wide range of research and educational applications, contact your local sales representative.


Measuring Moods: Signals for Insight into Emotion

“Do you ever look at someone and wonder what is going on inside their head?”

Joy, an anthropomorphized manifestation of happiness, delivers this line at the opening of Pixar’s 2015 animated hit “Inside Out,” a film that explores the emotional struggles of its young protagonist. She could have been speaking for generations of researchers who have plumbed the depths of the human psyche for a better understanding of the mechanisms behind our feelings, moods, and emotions.

When today’s researchers talk about emotion, they typically do so in terms of affect, the underlying physiological and psychological experience of feelings and emotions as a reaction to stimuli. Affect and emotion are not the same thing, per se, but are fundamentally connected. While the feelings we describe as fear, joy, love, hate, etc. remain abstract, affect is more concrete. BIOPAC co-founder and head of R&D describes it as “the measurable quality or manifestation of emotion in the human body.”

This manifestation can be measured in the human nervous system’s response to stimuli. Depending on the nature of the stimuli and how this sensory data is interpreted by the central nervous system, an array of physiological responses can take place: heart rate changes, the stomach and muscle groups tense, skin temperature responds, triggering sweat glands, among others.

The signals corresponding to these reactions provide researchers with valuable data to help them better understand affect and emotion. These signals—electroencephalogram (EEG), electrodermal activity (EDA), electromyogram (EMG), heart rate, and respiratory rate, to name a few—can be recorded and measured using a range of currently available sensing technologies.

As an example, a 2019 study published through the Queensland University of Technology used respiration signals as a means of classification for human emotions such as happiness, sadness, surprise, disgust, fear, and anger. In the study, breathing signals, including airflow rate and volume, were acquired and recorded using a BIOPAC MP36 data acquisition unit while participants were shown seven film clips, each associated with a different emotion. The study concluded that the respiratory data was 80% effective in accurately classifying affective responses to the film stimuli.

A team of researchers at the Khwaja Fareed University of Engineering and Information Technology in Pakistan took their investigation into the connection between physiological signals and emotion a step further. They used a similar approach by measuring participant response to movie clips, however this time, four types of physiological signals were acquired, including ECG, EMG, respiration, and skin conductivity (SC). The data was acquired with a wide range of signal sensors and analyzed via a BIOPAC MP160 DAQ System.Signals for Emotion

Signal sensing technology also allows researchers to study emotion in multiple participants simultaneously, as was the case in a 2020 dyadic study of how a parent’s stress and emotional suppression affects their children. The study measured physiological responses of both parents and children using ECG and impedance cardiography (ICG) via a BIOPAC MP150 data acquisition unit.

The mysteries of human emotion are being unlocked through a growing understanding of the affective response to stimuli. For more information on how physiological signals can be gathered and analyzed for this purpose, see our app note on emotional state physiology as well as our webinar Emotion and Objective Physiological Measures.


Contact BIOPAC for the latest information on how we can help you measure affect in the lab.

Baby Blues: Neonatal, Infant, and Toddler Research Challenges

The first five years of a child’s life are marked by considerable change—both physiological and psychological. Young children undergo incremental development in their ability to think and solve problems, their emotions, and their linguistic abilities, to name just a few developmental changes. Over time, the rapidity and extent of this development vary by individual, even among children of the same age. For these reasons, research techniques and tools must be adopted that are suitable for the participant’s age group. In this constantly evolving segment of the physiological and psychophysiological field, new approaches and technologies are being implemented with the needs of our youngest participants in mind.

Different Needs, New Approaches

A recent article published by researchers at the University of California Irvine outlined some of the challenges in conducting research within the neonatal to toddler age groups. Chief among these was the higher levels of attrition among these groups compared to older test subjects. Much of this can be linked to the general characteristics of the test group—reduced ability to sit still for long periods of time, shorter attention span, and lack of motivation to participate. While these factors may not surprise an experienced parent or childcare provider, they can throw a wrench into any study that has not taken such challenges into account.

Tools for Toddlers

Choosing the right tools and applying them appropriately in the lab setting can not only significantly improve attrition rates, but also the quality of data. Receiving a clear, uninterrupted signal when gathering data from a research participant is challenging under the best of conditions and can seem insurmountable when it involves a potentially fussy, fidgety young child or infant. Thankfully, research tools and technologies have been developed with our youngest participants in mind. These include electrodes for infants that are not only sized appropriately but also designed not to irritate sensitive skin, as well as infant-sized EEG caps that are comfortable enough to be worn for extended periods and secure to prevent excess movement and signal loss.

Combining Technique with Technology

Dyadic ResearchSome researchers have found the best approach to tackling the challenges presented by these youngest participants is a combination of age-appropriate strategies and specialized equipment. A 2020 dyadic study published in the Journal of Cognitive Neuroscience examined the Effects of Maternal Singing Style on Mother-Infant Arousal and Behavior by using skin conductance (SC) levels as a measure of arousal in both the mother and infant participants. Both participants were fitted with pre-gelled electrodes attached to BioNomadix wireless EDA transmitters, which are less cumbersome than a fully wired solution. While the mother’s electrodes were attached at the neck, the infants were attached to the foot and secured in place with paper medical tape and covered with a sock. This ensured the electrodes would be held securely in place and reduce movement that could negatively impact signal quality.

We have only scratched the surface of the tools and strategies available for conducting lab research on very young participants. For additional information, watch our webinar on Research and Best Practices for Recording from Newborns, Infants, and Toddlers.


For additional information on research tools for young participants, contact your local BIOPAC sales representative.

Choosing the Right Signal: Easy as 1, 2, 3

In physiology and life sciences, researchers rely on a wide range of signals to gather data from humans and animals. These signals provide critical insight into how complex organisms function under a myriad of conditions. However, this wealth of potential data sources can also present a challenge for researchers: choosing the right signals on which to focus their data gathering. For those lacking a background in the disciplines and mechanisms behind these signals, sifting through the available methodology can be overwhelming. The best place to begin is by considering one or a combination of the “Big Three” physiological signals: ECG, EDA, and respiration.

In physiology and life sciences, researchers rely on a wide range of signals to gather data from humans and animals. These signals provide critical insight into how complex organisms function under a myriad of conditions. However, this wealth of potential data sources can also present a challenge for researchers: choosing the right signals on which to focus their data gathering. For those lacking a background in the disciplines and mechanisms behind these signals, sifting through the available methodology can be overwhelming. The best place to begin is by considering one or a combination of the “Big Three” physiological signals: ECG, EDA, and respiration.

One from the Heart

Changes in heart rate can provide information on both the physiological and psychological state of a research participant. Electrocardiography (ECG or EKG) is a biopotential measurement that provides direct metrics on electrical voltage changes in the heart. With the help of simple hardware and software, it is possible to record these voltage variations as waveforms to track how the heart responds to stimuli. Additional data can be provided by creating reoccurring reference points in the waveform, measuring the intervals between beats, and calculating heart rate variability to track changes over time or in response to stimuli.

Skin Deep

Electrodermal Activity (EDA) provides one of the best measurements of how the body responds to psychological stress and anxiety. It can be simply understood as a measure of changes in the electrical conductance of the skin in relation to the production of sweat. The physiological process of EDA comprises two components, skin conductance level (SCL) and skin conductance response (SCR). SCL is a tonic level that slowly changes over time, measuring the period for response to a stimulus to occur, from its onset to its peak. SCR reflects the phasic response to an arousing stimulus that is shown in faster changes of the skin conductance level. As an example of the application of EDA and ECG measurements in psycho-physiological research, a recent study applied both signals in measuring the cognitive states of gamers during human-computer interaction (HCI).

Breathe Easy

ArachnophobiaAs with changes in heart rate, variations in breathing cycle reveal how subjects respond to a wide range of stimuli and conditions. The signal produced by the respiratory cycle is a transduced physiological signal. As such we can apply mechanisms to create a voltage potential to measure phases of inhalation and exhalation in this cycle. This data can be represented in waveforms, providing data on respiratory rate, amplitude, and respiratory sinus arrhythmia (RSA). The latter combines respiratory data with ECG signal data to show changes in heart rate in response phases in the respiratory cycle. A 2020 machine learning study for the development of virtual reality applications combined respiration, EDA, and ECG signals to measure participant’s fear response to spiders, an example of how all three signals can be simultaneously utilized in psychophysiology research.

Choosing the right signal shouldn’t be the biggest hurdle to designing your next research project. Applying one or more of these “Big Three” can cover a wide range of data gathering goals.


For additional assistance, consult BIOPACS online resources on Life Science and Physiological Signals or contact your local BIOPAC representative.

Hitting the Mark: Using Event Markers to Improve Data Quality

Life is a series of events—some are planned while others catch us completely by surprise. This holds true in the lab where the quality of experiments and data depend on accurately identifying, tracking, and sorting key events as they occur. Events like the introduction of stimuli and a test subject’s reaction directly impact data.

Life is a series of events—some are planned while others catch us completely by surprise. This holds true in the lab where the quality of experiments and data depend on accurately identifying, tracking, and sorting key events as they occur. Events like the introduction of stimuli and a test participant reaction directly impact data. Similarly, unplanned events, such as when a participant coughs or sneezes during a respiratory experiment, can affect overall data quality.

In this context, we define an “event” as piece of information associated with a specific time in a waveform. An event can capture points of interest within a file (e.g., subject moved, dose added) or on a particular channel (e.g., T-wave onset).

Whether intentional or not, critical events need to be easily located and identified by those running an experiment. Event marking provides the key to this by helping researchers eliminate outlier data while making it possible to locate data that is significant to the experiment. Today’s researchers benefit from data acquisition software that offers some form of event marking functionality to easily identify, label, and categorize such events. BIOPAC’s latest build of AcqKnowledge, for example, integrates extremely easy-to-use event marking tools that enable users to mark “quick events” with a simple tap of a function/hotkey for 17 different event categories, each containing multiple types of events.

“I’m struggling to think of any time you wouldn’t be using these,” said BIOPAC Technical Support Manager David Pollock as part of the recent webinar AcqKnowledge Bootcamp: Set Up Experiments to Facilitate Data Analysis. “They are critical to being able to interpret your data after you acquire it.”

The benefits of event markers include:

  • Allowing researchers to differentiate stages of an experiment
  • Making it easy to eliminate outlier data
  • Allowing researchers to track and identify stimuli
  • Providing control over event tracking, thus eliminating errors
A Tale of Two Studies

A pair of recent studies illustrate how data acquisition software like AcqKnowledge can streamline event marking. The first sought to test the viability of various commercial-off-the-shelf ECG sensors for monitoring stress levels in participants. Test participants used a manual button to self-mark stress events triggered by mental arithmetic tasks, startle response tests, and a cold-water response test. A BIOPAC MP Research System data acquisition unit provided a clinical baseline for comparison with the pair of COTS ECG monitors. The limitations of self-reported events were revealed when participants were found to have accidentally activated the stress “clicker” about 60% of the time.

Physiological Data in Military StudyA similar 2018 John Hopkins University study avoided this problem through both automated and researcher-controlled event marking. When examining how military commanders maintain combat effectiveness while responding to a range of potentially stressful battlefield situations, researchers employed AcqKnowledge to record event marks at the onset and offset of various stimuli. Physiological data was fed to an AcqKnowledge-equipped computer via a BIOPAC DAQ connected to an STP100C digital interface module. Event markers generated by both AcqKnowledge and E-Prime allowed researchers to easily identify stimuli as well as each task the participants performed by name, start time, end time, and duration.

Not leveraging the power of event marking tools can result in key experimental events being lost in a flood of data, potentially corrupting results. Check out this video tutorial to learn more about event marking with AcqKnowledge.

Scaling Up: The Challenges of Large-Group Studies

When formulating an approach to a research study, planning experiments, and choosing the right technology for the job, size matters. Research studies with human subjects generally fall into three scale-related categories: individual, small-group, and large-group studies. When we discuss “size” in this context, we are talking about the number of subjects sampled together at one time and in one location.

Single-participant studies sample data from subjects separately while dyadic research gathers input from two subjects at the same time and place. It may be necessary, however, to take readings from three, four, or dozens of study subject simultaneously. In such cases, researchers often want to measure how the participants react to identical stimuli or the same external conditions such as those found in a classroom, courtroom, or theater setting. Researchers may also seek to measure how subjects react or interact with other members of the study group such as during business exchanges, in a meeting room environment, or in game sessions or other competitive settings.

These large-group studies present critical challenges that may not normally occur in single-participant studies. First, the stimuli to which the participants respond must be presented in a uniform and synchronous manner. Whether the stimuli are visual or auditory, thermal or olfactory, electrical or haptic, all study subjects must be able to respond to the same stimulus.

A recent study in behavioral economics measured psychophysiological reactions to various stimuli in the form of market and trading games in which multiple interactions took place between a set of “players.” Timing was critical to accurately measure the participants’ physiological responses to trades, losses, and gains. Both the presentation of stimuli and the recording of the participants’ reactions had to be precisely synchronized.

Methods for recording subjects’ response may include biopotential data such as ECG/EKG, EEG, EMG; transducer signals that can include electrodermal activity (EDA), respiration, and temperature; eye tracking; video recording; subjective response; or fNIRS, to name just a few examples. In the above study, participants were equipped with a photodiode that recorded responses during a decision-making experiment. Signals from the photodiodes were transmitted to a 16-channel BIOPAC MP150 Data Acquisition System (since replaced by the MP160 Data Acquisition System), allowing the simultaneous, synchronous recording of timing data from up to 16 subjects.

Child StudiesSynchronizing data is just one consideration when conducting multi-participant studies. Other logistical challenges arise when participants must interact with their surroundings. Another large-group study compared physical and psychological activity among seven-year-old elementary school children as they learned geometry through movement-based teaching methods. This presented several challenges, including the age of the subjects and the need for freedom of movement. Such problems are common to large-group studies that require multiple participants to move unimpeded by recording apparatuses. Typically, a researcher will choose between either a minimally invasive tethered device that can be wired to a data acquisition unit (e.g., BIOPAC ECG100D Smart Amplifier) or a wireless device (e.g., BIOPAC BN-ECG2 Wireless ECG Amplifier) that permits additional freedom of movement. In this study, the researchers used wearable devices to record the children’s energy expenditure, intensity of movements, EDA, body heat flux, and skin temperature.

While large-group studies present an array of unique challenges to gathering data, these challenges can be overcome through careful planning and by choosing the right tools for the job. BIOPAC offers a wide range of scalable technologies, software, and accessories for conducting research with individual subjects, pairs, or large groups that can be adapted to an array of scenarios and research settings.

T4 Conference Wrap-up

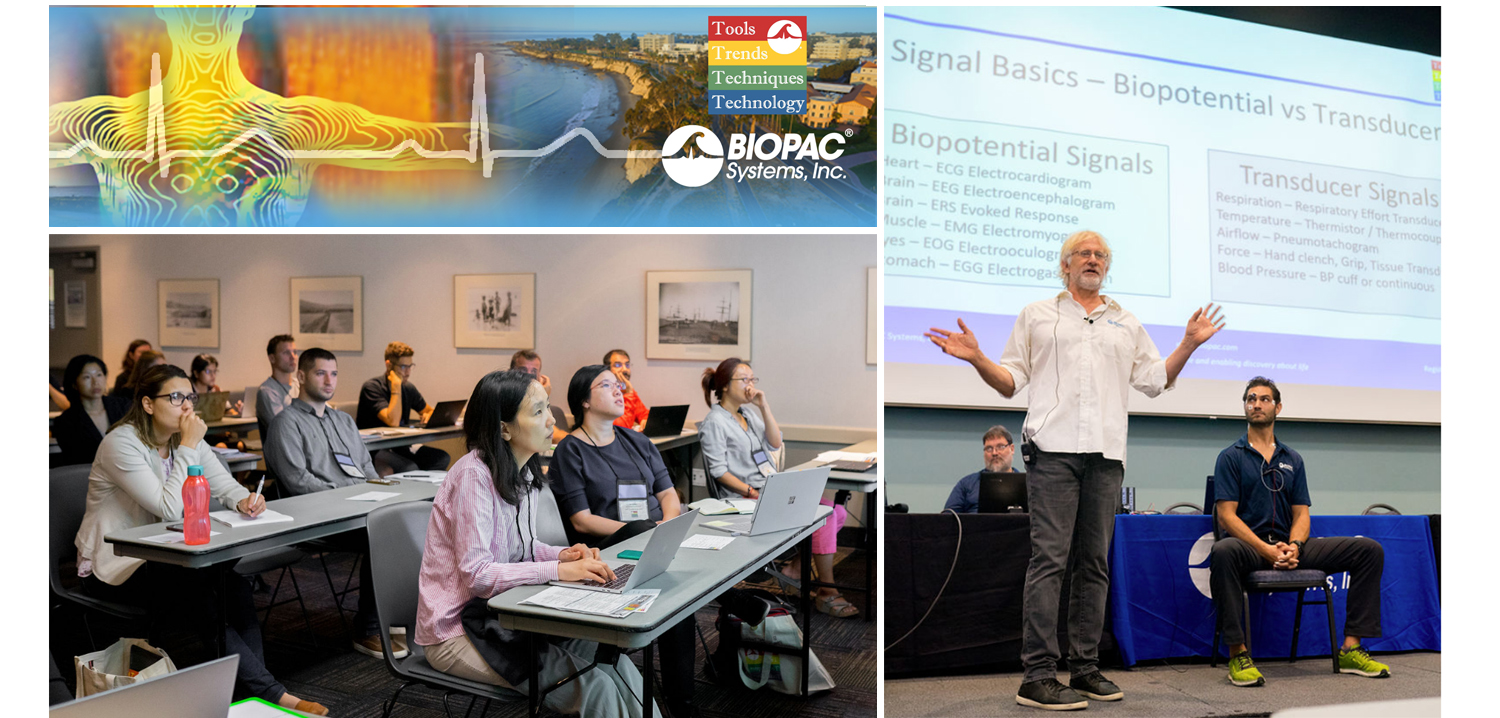
August is a month of barbecues, baseball, and last-minute vacations against the backdrop of a fading summer, and the eighth month of 2019 proved to be an equally exciting time at BIOPAC, with something of a pleasant vacation thrown in. On August 12-14, BIOPAC hosted its 2nd Biennial “Tools, Trends, Techniques, and Technology” Human Physiology Conference, known as “T4” to our friends and partners around the world. This three-day event, first held in 2017, featured lively, informative sessions hosted by BIOPAC staff, partners, noted academics, and industry experts, and covered a wide range of physiological techniques and disciplines. Over 150 attendees joined BIOPAC at the 2019 T4 Conference staged once again at the beautiful University of California at Santa Barbara campus. Participants and instructors winged in from China, Australia, Germany, Sweden, Italy, Spain, U.K., Ireland, and Egypt, as well as from wide regions of the U.S and Canada to soak up the idyllic surroundings of this ocean-side campus.

The focus of BIOPAC’s T4 Conference was to provide a fun, relaxed environment while hosting nearly 40 hands-on, human physiology training workshops chaired by over 20 distinguished instructors from around the globe. One of the many conference highlights was the “Mindfulness, Meditation, and Measurement: Mindfulness Exercises in Physiological Monitoring” session, hosted by Dr. Allan Weiss of the University of Southern California and  BIOPAC Co-founder and Director of R & D Alan Macy. These sessions, conducted in two parts over a two day period were booked beyond capacity, even though the early morning fog hadn’t yet lifted from the campus skyline.

The varied additional sessions covered a range from the basics, “Setting Up Your Lab, Getting Great Data and Troubleshooting,” (hosted by Dr. Terry Blumenthal of Wake Forest University, and BIOPAC’s Alan Macy and Tim Cook), and “Creating Your Own Lessons Using BSL PRO,” (hosted by Dr. Taffeta Elliot of the New Mexico Institute of Mining and Technology), to exciting new technologies such as “Integrating Screen-based Eye Trackers with AcqKnowledge,” with Keith Jackson of BIOPAC partner company EyeTech, BIOPAC CEO Frazer Findlay, and BIOPAC Engineering Manager Ed Peterlin. Additional wide-ranging physiological disciplines were also covered, including MRI techniques, stimulation, and exercise physiology. All sessions were conducted using BIOPAC hardware and software systems, as well as platforms provided by BIOPAC partners such as Cedrus, fNIR, WorldViz, Psychology Software Tools, and CNSystems. At the end of each day, it was time to relax and unwind with a beverage of choice, a a walk along the beach, and some good conversation. Each evening featured excellent meals and camaraderie in the relaxed yet elegant environment of some of Santa Barbara and Goleta’s most stunning surroundings. After three great days of immersive sessions, it came time for everyone to part ways, having forged new collaborative partnerships and an enhanced knowledge about the full potential of BIOPAC and BIOPAC partner products.

You don’t have to wait for T4 2021 to learn more about life science data—watch Fundamentals of Physiological Data Recording now!

For a closer look at T4, and a preview of what is sure to be an exciting 2021 event, we invite you to visit our T4 Human Physiology Conference page.

Looking for additional resources, tips, tricks, and expert advice on BIOPAC and BIOPAC Partner products? Please also visit our Webinars and Video Tutorial pages.


BIOPAC offers a wide array of wired and wireless equipment that can be used in your research. To find more information on solutions for recording and analyzing signals such as ECG, heart rate, respiration and more using any platforms mentioned in this blog post, you can visit the individual application pages on the BIOPAC website.

error: Content is protected !!