
fNIRS Systems—a NIR miracle

At the dawn of the 19th century, pioneering astronomer Sir William Herschel discovered the existence of infrared radiation, which is electromagnetic radiation invisible to the human eye but identifiable via its ability to heat objects. Infrared radiation is commonly divided into three categories, near, mid, or far infrared waves. In ensuing years, infrared radiation was found to be useful for industrial, scientific, military, and law enforcement applications, such as heat signature tracking and night vision goggles. Over two decades ago, a new technology called near infrared spectroscopy (NIRS) was developed for non-invasively measuring specific aspects of human physiology using near infra-red waves. While far infrared waves lie closest to the microwave region, near infrared waves are closest in length to the visible light part of the electromagnetic spectrum, and are microscopic in size. Unlike far infrared waves, near infrared waves do not produce any heat. In fact, we can’t feel them at all. They are the small waves used by common devices such as a
remote control.

Today, near infrared waves are commonly used  for studying many application areas of human physiology, notably by the fNIRS Imaging Systems to gather precise, high-density brain function and muscle oxygenation data.

How does fNIRS work with regard to human physiology? It’s an optical technology which sends light into the tissue and records the light that scatters back via a photo-diode and sensor attached to the subject. The fNIRS continuous wave technology uses an optical window in the near infrared spectrum that enables light to pass through. For example, when you hold your hand in front of a strong white light, the tissue can appear red and almost translucent. fNIRS shines light into the skull or muscle tissue, and using special detectors, records the resulting light scatter that returns to the surface.  The light penetrates skin, bone, and alights on the brain before its return trip to the surface detectors, and accomplishes this painlessly without heat. In fact, the subject does not even feel the near infrared energy and the light is harmless. The result is startling images and functional data of the brain at work. The fNIRS Systems (ranging from Educational to High-Density versions) include fNIRsoft software for processing, analyzing and visualizing functional near infrared (fNIR) spectroscopy signals through a graphical user interface. Additionally, the fNIRS Systems work with the BIOPAC MP160 Research System and AcqKnowledge software in conjunction with other physiological signals such as ECG, respiration, cardiac output, blood pressure, electrodermal activity, and stimulus response markers. AcqKnowledge software also provides automated analysis tools for event related potentials and ensemble averaging.

fNIRS brain function application areas include workload assignment, VR,  stress, attention, geriatrics, economics, ergonomics, learning and performance, sports science, HCI, pain perception, and cognitive workload – low or high.

fNIRS Systems can also be used to measure muscle oxygenation data, including oxidative capacity, muscle load, lateral imbalances (left vs. right muscle group) oxygenated hemoglobin and de-oxygenated hemoglobin in muscle activity.

We invite you to enjoy a comprehensive free fNIRS webinar and to visit our fNIRS products page.

BIOPAC offers a wide array of wired and wireless equipment that can be used in your research. To find more information on solutions for recording and analyzing signals such as ECG, heart rate, respiration and more using any platforms mentioned in this blog post, you can visit the individual application pages on the BIOPAC website.

Getting the Bands Back Together – Components of the EEG Signal

Many notable events occurred in 1929, not all of them good. The St. Valentine’s Day massacre. The stock market crash that triggered a worldwide economic crisis. The chain saw was invented. Not much good was happening in Germany either. Rampant inflation, the decline of the Weimar Republic, and the implacable rise of Nazism. But 1929 was also the year that German physician Hans Berger made an important scientific discovery that continues to influence how we study the human brain today. Dr. Berger discovered that electrodes placed on the human scalp could detect various patterns of electrical activity. After further study confirmed that these patterns were indeed related to brain activity and not mere scalp muscle artifact, scientists began to delve into the constructs of these “brain waves.” Today, electroencephalography (EEG) is still the primary method employed for recording brain function. In medical and basic research, correlation of particular brain waves reveals valuable information about sleep phases, emotional states, psychological profiles, and other mental activities. Much of this information is derived from five simple periodic rhythms, or frequencies, recorded in the EEG signal—alpha, beta, delta, theta, and gamma waves. These frequencies are known to be associated with specific degrees of alertness, affect, emotional states, and sleep. What do these frequency bands tell us about what is going on behind the gray matter? Allow us to introduce the band members.

Alpha (8-13 Hz) – Mellow Band Member

Alpha waves are associated with relaxation and calm. In general, the alpha rhythm is the prominent EEG wave pattern of adult subjects who are awake, but relaxed with eyes closed. Each region of the brain has a characteristic alpha rhythm but alpha waves of the greatest amplitude are recorded from the occipital and parietal regions of the cerebral cortex. In general, alpha wave amplitudes diminish when subjects open their eyes and are attentive to external stimuli, although some subjects trained in relaxation techniques can maintain high alpha amplitudes even with eyes open.

Beta (13-30 Hz) – Band Manager

Beta waves are related to memory, focus, and problem-solving. beta rhythms occur in alert individuals who are attentive to external stimuli, or exerting specific mental effort. Paradoxically, beta rhythms also occur during deep REM sleep. Beta waves may also be associated with “remembering” or retrieving memories.

Delta (1-5 Hz) – Supportive Band Member and Theta Rhythm (4-8 Hz) – Creative Band Member

Delta and theta rhythms are low-frequency EEG patterns that increase during sleep in the normal adult. Delta waves are associated with rejuvenation of the body through restorative deep sleep. Theta waves are more aligned with creativity and emotional connection. As people move from lighter to deeper stages of sleep (prior to REM sleep,) the occurrence of alpha waves diminishes and is gradually replaced by the lower frequency theta and then delta rhythms.

Although theta and delta rhythms are generally most prominent during sleep, there are cases when delta and theta rhythms are recorded from individuals who are awake. For example, theta waves will occur for brief intervals during emotional responses to frustrating events or situations. Delta waves may increase during difficult mental activities requiring concentration. In general, the occurrence and amplitudes of delta and theta rhythms are highly variable within and between individuals.

Gamma (> 32 Hz) – Perceptive Band Member

Gamma waves bring to the party cognition, information processing, learning, memory, and perception. Gamma waves were largely overlooked before the development of digital electroencephalography, as analog electroencephalography is restricted to recording and measuring rhythms that are usually less than 25 Hz.

A gamma wave is considered to be the “fastest” brain activity. The prominence of this wave leads to anxiety, high arousal, and stress. In optimal conditions gamma waves help with attention, focus, binding of senses (smell, sight, and hearing), consciousness, mental processing, and perception.

Research studies reported that gamma activity is involved in attention, working memory, and long-term memory processes, although excessive Gamma activity is also involved in psychiatric disorders such as schizophrenia, hallucination, Alzheimer’s disease, and epilepsy.

So in a sense, the periodic rhythms alpha, beta, delta, theta, and gamma, like the members of a tight musical ensemble, have distinct but overlapping roles for enabling the human brain to achieve wondrous things great and small that are often taken for granted.

BIOPAC Systems, Inc offers the following solutions for recording and analyzing EEG signals for research and education applications.

MP160 System with AcqKnowledge Software
EEG100D Smart Amplifier
EEG100C Amplifier Module
EEG100C-MRI Amplifier Module
BioNomadix Wireless EEG
BioNomadix Smart Center
Mobita 32-Channel Wireless EEG System
B-Alert Wireless EEG with Cognitive States Software
EPOCH Wireless In Vivo Neural Recording Systems—longterm EEG for rats, mice, or pups
Biopac Student Lab Systems—with EEG I, EEG II, and Hemispheric EEG lessons

We also invite you to enjoy our library of free EEG webinars on our Webinars page.

Why Smart Technology Is Smarter

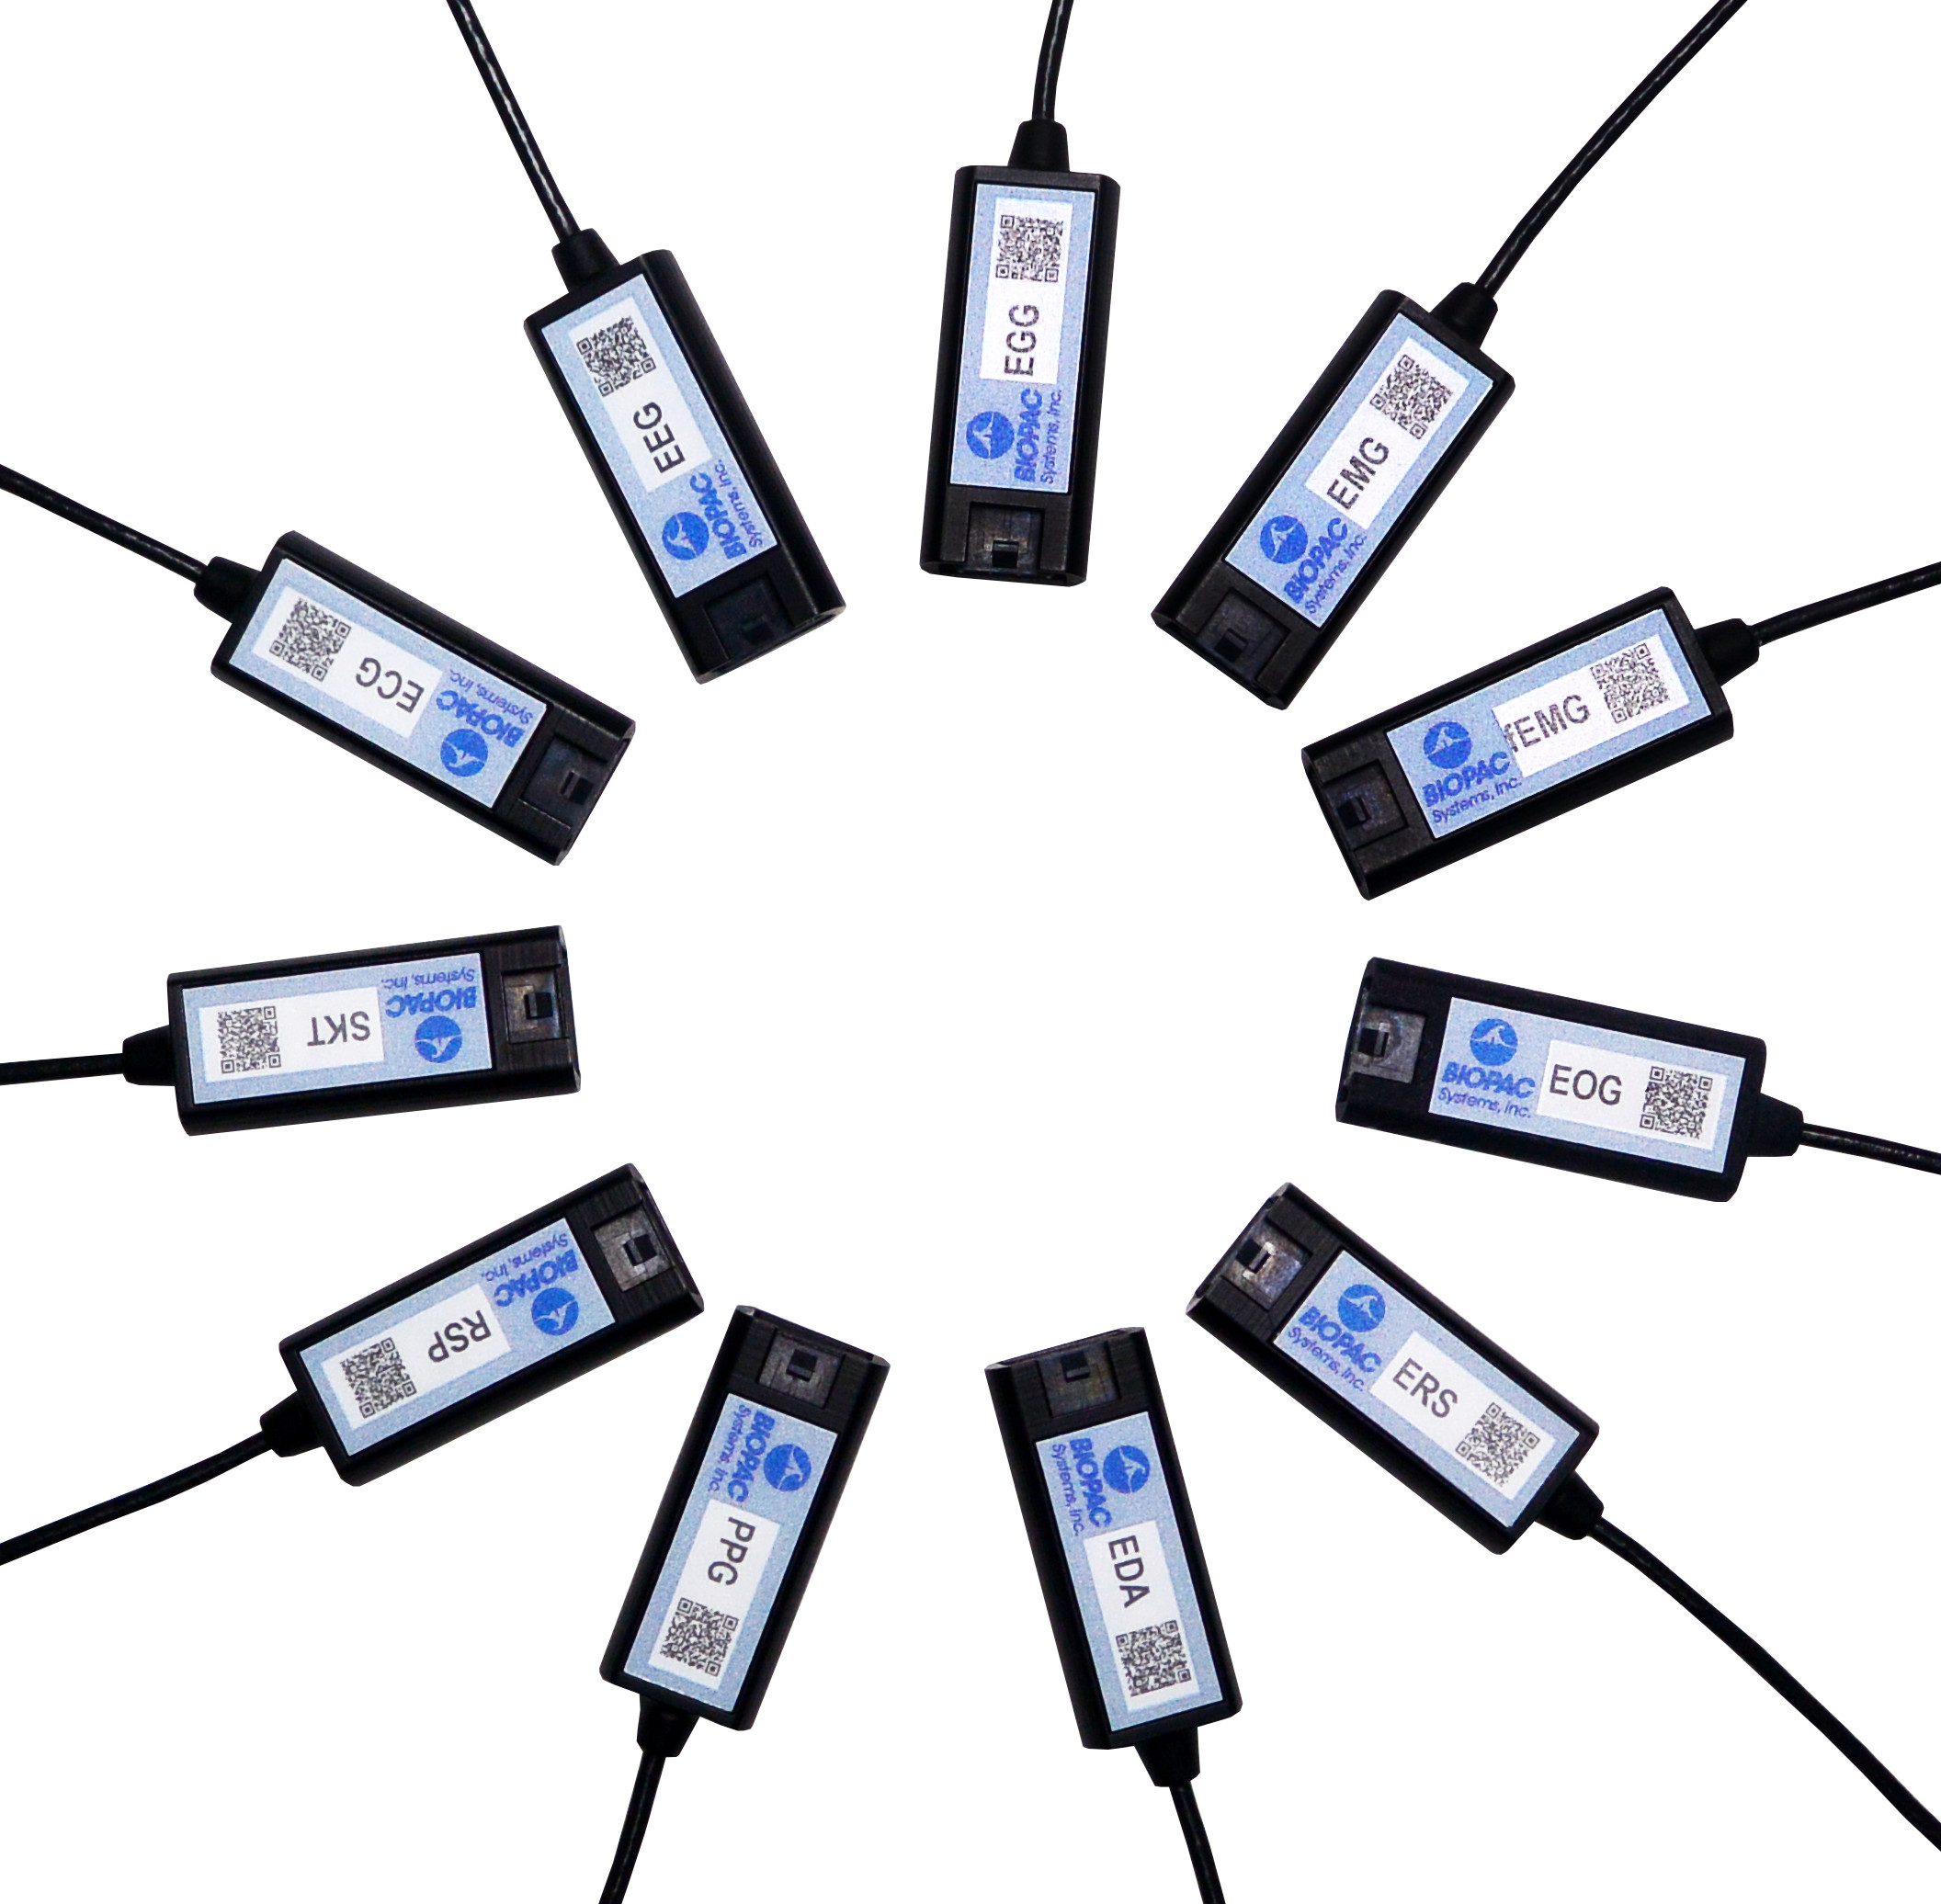
Physiological research studies require a great deal of focused expertise, including an ability to properly set up all necessary equipment for the study at hand. This has long consisted of overseeing a host of manual hardware connections and software settings, and mistakes can be frustrating. The good news is most users become proficient at these detailed configurations, but wouldn’t it be a welcome change if these setups were easier? Think about how helpful it would be if the hardware and software were “smarter” and actively worked on your behalf. This is now a reality with the smart technology offered by BIOPAC’s newly-released line of 100D Smart Amplifiers.

What is smart technology and what makes Smart Amplifiers smarter? To begin with, these amplifiers are significantly smaller than standard amplifiers (only 4.6 mm in length) and have no buttons or switches. The convenient lightweight design is a powerful benefit, enabling these amplifiers to be attached closer to the participant’s body. Because the amp itself is positioned near the signal source(via a lightweight 3-meter cable), the resulting data is of superbly high quality, with less noise and artifact than conventional amplifiers. But let’s get to the smart part. The smart technology in Smart Amplifiers enables them to do the setup work for you. Each Smart Amplifier, regardless of signal type,  self-configures to the optimally recommended settings, negating the need for user-defined adjustments or monitoring of physical switch positions. Simply plug the amplifier into the new AMI100D Input Module now included with every BIOPAC MP160 System, launch the AcqKnowledge software, and begin recording data.

To minimize setup time and errors in the lab, Smart Amplifiers utilize auto-detection and auto-identification technology. Not only do they self-configure, they also alert you (via a software dialog) whether the amplifier is connected to the correct channel. So basically, using Smart Amplifiers right out of the box is a three step process. 1) connect the amplifiers, 2) select any desired calculation channels for derived signals, 3) click Record. That’s it.

Frequently-used calculation channels or transformations are pre-configured for all signals and can be enabled by simply checking a box in the amplifier’s software UI. (For example, the ECG100D Smart Amplifier offers options to add heart rate and/or R-R interval, and will automatically place these derived signals in a separate calculation channel in the AcqKnowledge graph.)

Smart Amplifiers are available for the following signals: ECG, EEG, EGG, EDA, RSP, PPG, ERS, EOG, SKT, EMG and new fEMG (facial and small muscle).

Significantly smaller footprint, simple setup, unparalleled user comfort, superlative data quality, compatible with previous-generation BIOPAC amplifiers (such as 100C and BioNomadix Series), portable and lightweight, Smart Amplifiers will be an epiphany for your research.

To see Smart Amplifiers in action, we invite you to watch our free on-demand webinar New Smart Technology for the Lab.

BIOPAC offers a wide array of wired and wireless equipment that can be used in your research. To find more information on solutions for recording and analyzing signals such as ECG, heart rate, respiration and more using any platforms mentioned in this blog post, you can visit the individual application pages on the BIOPAC website.

Synchronize Participant Video with Physiological Data

AcqKnowledge software includes a Media feature that allows you to record and link participant video with physiological data. A common issue that crops up when analyzing physiological data with linked participant video is a lack of synchronization between the resulting video playback and onscreen data. This most often occurs when a USB webcam-type video camera is used. These types of cameras typically support a 30 frame-per-second rate whereas AcqKnowledge and the MP System can sample at rates up to 200,000 Hz. These factors can introduce an unwanted delay or misalignment between the video playback and data in the resulting AcqKnowledge graph.

So how do we synchronize these disparate signals to dovetail perfectly before recording our data and video? Fortunately, AcqKnowledge provides adjustment tools for addressing this common issue. This simple procedure requires the use of the AcqKnowledge software’s powerful Stimulator feature and a BIOPAC OUT103 LED Video Sync Cable.

Here is the sync method in a nutshell: With the OUT103 LED connected to the Analog Output of the MP160 unit’s HLT100C module, the AcqKnowledge software’s Stimulator is used to output a 5-volt square wave pulse into an AcqKnowledge graph, Using this setup, the LED illuminates when the 5-volt pulse is applied. The trick now is to use the AcqKnowledge Media feature and webcam to record a short video of the LED illuminating while the 5-volt pulse is being applied.

In the resulting graph, it’s easy to see in the Media playback screen when the light comes on by slowly advancing the AcqKnowledge software’s I-beam cursor through the graph data. Does the LED in the recorded video illuminate before the cursor reaches the 5-volt pulse? After? Or at the same time? Chances are, the recorded light will pop on slightly before or after the cursor reaches the pulse.

To compensate for this, the AcqKnowledge Delta-T measurement is used to determine the time interval between the pulse and when the recorded LED illuminates. For example, if the recorded LED lights up an indicated 185 ms before the onset of the pulse, then this discrepancy can be removed by setting a delay of 185 ms in the Media setup tools. If the LED lights up after the pulse onset, a negative delay must be set (ex. -185 ms). Once the playback delay is eradicated, the experiment can continue with confidence that all video and physiological data will be properly aligned.

It’s features such as this that enhance the usability AcqKnowledge Media feature, making it a powerful tool for recording and synchronizing participant video and audio during experiments. After a bit of practice, dialing in the playback video for linked Media acquisitions becomes second nature.

To see AcqKnowledge Media Synchronization in action, we invite you to view a free on-demand webinar covering this procedure in detail.

BIOPAC offers a wide array of wired and wireless equipment that can be used in your research. To find more information on solutions for recording and analyzing signals such as ECG, heart rate, respiration and more using any platforms mentioned in this blog post, you can visit the individual application pages on the BIOPAC website.

How Stimulator Hardware and Software Work Together

In order to create an effective stimulation experiment, two main components are necessary – the stimulator software and and stimulator hardware module. Let’s briefly examine how they work together.

The Stimulator setup window in AcqKnowledge Software is an onscreen toolbox used for constructing  the stimulus waveform type, shape, duration, repetition, and displays a graphical representation of the stimulus type being presented. It also controls how often the stimulus starts and stops within the software. These controls extend to cleverly being able to output two different stimulus types simultaneously, such as a pulse in one channel and a tone in the other. It is bascially the canvas upon which the stimulation paradigm is created, and provides a blueprint for the output.

But without the stimulator hardware, these sophisticated setups are merely waveforms on a screen. In order to control the intensity or voltage level of the stimulation signal and output it to a participant, it’s necessary to incorporate simulator hardware, such as the STM100C stimulator module.

The STM100C, which connects directly to the BIOPAC MP160 System, has a number of controls for outputting and interacting with the stimulation signal generated by the software, the main one of which is the level control on the front panel. This enables you to increase or decrease the amplitude or intensity on the software stimulation waveform, and whereas the waveform shape will remain unaltered, the power of the pulse can be attenuated as desired. The STM100C can also interface with headphones (for audio stimulus), LEDs, and other devices. The STM100C module itself is not powerful enough to generate much voltage on its own, so to provide the desired voltage or current range for nerve conduction studies, an isolation adapter is required. Think of these adapters as small amplifiers that multiply the STM100C voltage or current output to the proper levels needed for the study. Isolation adapters plug directly into the STM100C unit, and the electrodes connected to the participant interface to the isolation adapters. Additionally, a monitoring cable can also be connected so the voltage or current output can be viewed onscreen in AcqKnowledge.

We also invite you to view a free webinar on various stimulation techniques using BIOPAC hardware and software.

BIOPAC offers a wide array of wired and wireless equipment that can be used in your research. To find more information on solutions for recording and analyzing signals such as ECG, heart rate, respiration and more using any platforms mentioned in this blog post, you can visit the individual application pages on the BIOPAC website.

Understanding Stimulation Hardware

Physiology studies often involve the recording of responses from subjects who are reacting to a particular sensory input being presented, otherwise known as stimulation. The presented stimuli can take several forms, and are tightly controlled in lab environments for the comfort and safety of the subject. Different types of human and animal stimulation consist of:

  • Electrical
  • Haptic (touch)
  • Thermal (temperature)
  • Olfactory (scent)
  • Auditory (sound)
  • Visual (light, such as a strobe)

The following is an introduction to some stimulation hardware commonly used in the research market:

Stimulator Modules such as the BIOPAC STM100C is one of the building blocks for many types of stimulation protocols and create a variety of pulse and waveform outputs for nerve conduction, evoked response, audio stimulus-response, and somatosensory response studies. The STM100C interfaces with the BIOPAC MP150 or MP160 data acquisition system and a wide range of devices such as headphones, LEDs, piezo transducer for audio alarms, or haptic transducers. The device also provides technician control of the stimulus level, and works in concert with the AcqKnowledge software Stimulation setup window.

Stimulus Isolation Adapters: These adapters are added to the STM100C module and multiply the output of the STM100C by 5 or 10x to provide the desired range for nerve conduction, muscle twitch, or other studies requiring a stronger stimulus than what the STM100C can generate on its own.

The STM200 is a standalone device that interfaces with the Analog Outputs on the front panel of the Universal Interface (UIM100C) or High Level Transducer Interface (HLT100C) modules. This is a very powerful stimulator, capable of outputting up to 1 amp. It can be used for human and animal applications, including isolated tissue bath preparations.

Linear Isolated Stimulator: The STMISOLA Linear Isolated Stimulator is the most advanced and powerful stimulator offered by BIOPAC. This type of unit can handle almost any application and far exceeds most typical hardware devices in terms of flexibility and control. Typically, stimulators can only generate simple unipolar or bipolar pulses. The STMISOLA, however, can output unipolar or bipolar arbitrary waves such as pulse (single or train), square, sine, triangle, exponentially decaying, modulated envelopes, and fully user-specified types. STMISOLA can be used for Transcranial Direct Current Stimulation (tDCS) and High Definition Transcranial Direct Current Stimulation (HD-tDCS. These are forms of electrical stimulation to effect neuro-modulation in the brain.

Stroboscope: The TSD122 Stroboscope resembles a handheld flashlight and is used for visual evoked response applications and for synchronizing triggers. The unit has a range from zero to a maximum of 12,000 flashes per minute.

Haptic Stimulator: The TSD190 Haptic Stimulator incorporates an internal electromagnetically actuated plunger which can be used to mechanically stimulate a 1.5 mm diameter area of skin surface; both plunger force and travel can be infinitely adjusted between zero and a specified maximum value. This type of stimulator connects directly to the STM100C Stimulator Module and is used for tactile or somatosensory studies.

Thermal Stimulator: The STMTHERM* Thermal Stimulator is used for applying 5-second hot or cold temperature pulses to a  4 cm x 4 cm skin area. AcqKnowledge software controls the actual output from the MP160 data acquisition unit and the stimulator hardware multiplies the signal to achieve the desired voltage or current levels.

Auditory Stimulator: The OUT101 Tubephone is used to deliver aural stimulus in the form of clicks or tones for auditory evoked responses studies such as auditory brainstem response (ABR) and resembles a tube, which is worn in the ear. It connects directly to the STM100C Stimulator Module.

We hope the above thumbnail sketch serves as an introduction to various stimulator hardware and common stimulation protocols. Please visit the above linked content for more in-depth information.

We also invite you to view our free webinar, Stimulation Techniques for Researchers, available on-demand.

*STMTHERM Thermal Stimulator will be available soon! Stay tuned.

BIOPAC offers a wide array of wired and wireless equipment that can be used in your research. To find more information on solutions for recording and analyzing signals such as ECG, heart rate, respiration and more using any platforms mentioned in this blog post, you can visit the individual application pages on the BIOPAC website.

The Face of Facial Expression Analysis

Say you’re in a situation where it behooves you to keep a poker face. At an auto dealership negotiating a price on the new car of your dreams, or sitting across from your boss trying to make a case for a promotion. Your heart is pounding, sweat is forming in the crevasses of your palms, yet you need to keep yourself in check and not betray your excitement or apprehension. How skilled are we at masking emotions really? Emotions affect everyone in daily life, and play a key role in non-verbal communication. They are essential to understanding human behavior. A growing area of research is geared toward classifying and analyzing human emotions for a variety of studies, and methods for acquiring this data have become increasingly reliable and sophisticated. How do these studies work, and how is something as amorphous as the smallest twitch of a facial expression accurately recorded?

Facial “emotion reading” software such as FaceReader can detect minute variations in facial expressions by analyzing key points on the face (over 500) and has been “trained” with more than 10,000 manually annotated images to enhance facial modeling accuracy. Using this vast classification library, the input is distilled into six basic or universal emotions, (happy, sad, angry, surprised, scared, disgusted, or neutral.) Facial expression data is non-invasively gathered in real-time via a still or video camera, so no electrodes or leads are necessary.

But these refinements are more than skin deep. Additional tools for further quantifying facial expression data are commonly available. “Action Units” is the term used to describe individual or group facial muscle activity. The FaceReader Action Units add-on module allows automatic analysis of a selection of 20 common Action Units (such as raising of cheeks, wrinkling of nose, dimpling, and lip tightening) to measure affective attitudes (such as interest, boredom, and confusion).

Facial expressions can be visualized as bar graphs, in a pie chart, and as a continuous signal. Using FaceReader integrated with AcqKnowledge software and the MP160 System extends the functionality. Not only is the data automatically synchronized with other signals (ECG, fEMG, EDA, etc.,) but the recorded facial video can be monitored in the FaceReader display for real-time feedback.

Perhaps with a bit of practice, you can pull off that promotion and be able to afford that new car without tipping your hand!

For more information about FaceReader Software, watch the free On-Demand Webinar, “Using Facial Expressions to Understand Behavior” with BIOPAC CEO Frazer Findlay.


BIOPAC offers a wide array of wired and wireless equipment that can be used in your research. To find more information on solutions for recording and analyzing signals such as ECG, heart rate, respiration and more using any platforms mentioned in this blog post, you can visit the individual application pages on the BIOPAC website.

Understanding Stimulus Presentation Studies

Stimulus presentation studies are an important aspect of modern research that record and organize a participant’s reactions and physiological data to various inputs. These studies are commonly used in neuromarketing or psychophysiological experiments. First off, what is stimulus exactly? Put simply, a stimulus is a sensory input delivered to a participant with the purpose of eliciting a particular response. These stimuli can consist of images, words, lights, sounds, virtual reality, scent, or even mild electrical impulses.

The idea is to present varying types of stimulus to a participant at expected or unexpected intervals and record his/her response. For example, a collection of images might be presented (one at a time) ranging from pleasant (say an impressive vista) to neutral (say a street scene) to unpleasant (possibly a striking snake or other “fight or flight” image). Programmable stimulus systems (such as E-Prime or SuperLab) to present the stimuli, and can be used with a Chronos or M-Pod response keypad that the participant presses, each key representing a different response (e.g., pleasant image = press Key 1, unpleasant = press Key 2, etc.). A physiological signal commonly gathered from the participant is electrodermal activity (EDA), which measures the perspiration generated in a participant’s palms or fingertips. This “eccrine activity” has a strong correlation with emotional responses. For studies involving visual stimuli, a camera may be used to record the participant’s facial expressions. The expressions are simultaneously recorded and categorized using software such as FaceReader.

Stimulus experiments are generally set up using the hardware and software of the stimulus system and the resulting physiological data and stimulus markers recorded using a data acquisition system, such as BIOPAC’s MP160 with STP100C, MP36, or Smart Center Systems. These systems include AcqKnowledge or Biopac Student Lab life science software and the MP data acquisition units that interface with the stimulus hardware.

In practice, setting up stimulus studies is easier than it sounds on paper. The parameters and stimulus types are set up via drag-and-drop-interfaces in the E-Prime or SuperLab software, and the hardware interface set up using an I/O or USB connection between the stim hardware and the computer. The stimulus and BIOPAC data acquisition software can easily reside on the same computer, as can all stimulus and BIOPAC data acquisition hardware.

Stimulus studies can range from a simple setup, such as a participant responding to a sound for reaction time studies, to more randomized studies utilizing different types of stimulus delivered at varying pre-programmed intervals.

When the study is completed, data can be analyzed in AcqKnowledge software, and the various stimulus/responses organized automatically using AcqKnowledge’s automated Stim-Response Analysis routine.

For more information about conducting Stimulus studies using E-Prime, SuperLab, and AcqKnowledge software, we invite you to view the following free webinars and video tutorials:

Stimulus Presentation and Event Mark Up with E-Prime

Stimulus Presentation and Event Mark Up with SuperLab

AcqKnowledge Stim Synchronization and Analysis

Focus Areas – Automatically Create Using Define Between Events

BIOPAC offers a wide array of wired and wireless equipment that can be used in your research. To find more information on solutions for recording and analyzing signals such as ECG, heart rate, respiration and more using any platforms mentioned in this blog post, you can visit the individual application pages on the BIOPAC website.

Keeping Physiology Students Engaged

Keeping students engaged in the study of physiology can be a challenging exercise. Once the sole province of dusty textbooks and cumbersome lab manuals, the computer age ushered in quantum advances in the packaging of physiology curricula. Disadvantages were reflected in the cost of the systems, which often dictated that students crowd around a single computer, peering over shoulders with craned necks at confounding interfaces.

These early systems often left students feeling somewhat isolated because with only one student or instructor operating the computer, it was often difficult to engage all group members. Setting up the data collection was also a challenge and data quality itself was often poor. An unwelcome result was low student satisfaction and learning.

Gradually systems improved, becoming easier to use and more comprehensive. Current student physiology packages (such as Biopac Student Lab) divide various physiological disciplines into individual guided lessons (up to 65) and offer a high degree of interactive and multimedia content. Still, the challenge remains, how to keep students engaged and invested in the study of physiology? When considering a system, the following factors can help in this regard.

Choose a system that allows students to collect data on themselves. Engagement is higher when recording and analyzing one’s own data. Another key is to choose a system designed to offer all students a role. The student who isn’t the subject can be a recorder, director, or computer operator, and students can rotate to ensure everyone has a turn at being a subject. Everyone at every station has an integral role, rather than simply observing while an instructor operates complicated equipment. Simplicity of setup is also important. Systems such as Biopac Student Lab are compact and have standardized, modular “Simple Sensor” leads and transducers. The BSL systems come with all hardware, software, and support materials needed to begin collecting high-quality data within minutes.

The system should also support students’ ability to take their lessons home for further analysis. Biopac Student Lab can be augmented with a free downloadable analysis version of the software that can be used on any computer for analyzing data outside the lab. This enables students to remain more connected with their studies.

Lastly, interactive interfaces with clear onscreen instructions augmented by electronic and printed lab manual documentation are very helpful for beginning physiology students, and the system should be powerful enough to achieve clear, precise results while allowing for statistical comparisons be upper-level students.

This short list of key concepts encourages every student’s full participation, helps ensure all data is accurate, and allows students and instructors alike to obtain the most from the lab experience.

For more, click to watch a free BIOPAC webinar: Teaching Physiology: How to Engage Students in Lab Environments.

BIOPAC offers a wide array of wired and wireless equipment that can be used in your research. To find more information on solutions for recording and analyzing signals such as ECG, heart rate, respiration and more using any platforms mentioned in this blog post, you can visit the individual application pages on the BIOPAC website.

Data Acquisition Basics—Filtering

When setting up data acquisition parameters, one area of befuddlement often involves the use of filters. Which ones should I use, and how do I set them up? What are they really, and why do I need them? In a nutshell, filters are configurable controls for removing certain frequencies from a signal, while leaving others unaffected, and are  useful for removing noise and improving signal quality. Filters can be set up in the software as “online” (applied in real time during acquisition) or “offline” (applied post- acquisition). Some BIOPAC amplifiers, such as the 100C series, include a bank of filter switches relevant to the type of signal being acquired. As far as which filter to use, that is dependent on the type of physiological signal being acquired and BIOPAC amplifiers and software presets will help steer you toward the correct type of filter to use. Subsequent blog entries will delve more into specifics about which types are appropriate for which signals.

As in our earlier blog about frequencies, we’ll again be using the “cars” analogy to bring filtering concepts  into sharper focus. Say we want to look only at cars on a freeway that are traveling at or above the speed limit. To effectively do this, we’ll need to find a way to remove the slower vehicles from view. To isolate the “fastest” cars, we would apply a “High Pass” filter. By “High Pass,” we mean this filter eliminates all frequencies that fall below a specified cutoff point, and allows the higher frequencies to “pass through,” or remain present in the signal. Using the “cars/freeway” analogy, setting a High Pass filter to target cars traveling at 60 mph would eliminate all cars traveling at or below 60 mph and leave all faster cars unaffected.

Conversely, we can apply a “Low Pass” filter, which would eliminate all cars traveling faster than a specified speed and leave only the slower cars intact. Another “combination” filter that can be applied is a “Band Pass” filter, which eliminates the fastest and slowest moving “cars” and retains all cars that are traveling at a specified speed. Additional common filters are:

Band Stop isolates and removes a specific frequency or frequencies (all cars traveling at one particular speed, or range of speed, leaving all the others). This filter is most commonly used to eliminate 50 Hz or 60 Hz electrical noise frequencies from a signal.

Comb Band Stop is another powerful filter commonly used for removing electrical noise. The Comb Band Stop filter removes not only the 50 Hz or 60 Hz frequency, but also all overharmonics, or “echoes” of that frequency. For example, if you are in an area of the world that uses a 50 Hz line frequency, the Comb Band Stop filter will eliminate from the signal the 50 Hz frequency, plus 100 Hz, 150 Hz, 200 Hz, etc. If you live in the U.S. or other part of the world that uses a 60 Hz line frequency, this filter will remove 60 Hz, 120 Hz, 180 Hz, 240 Hz, etc. (A better analogy for this type of filter might be musical notes and their octaves rather than cars traveling at speed.)

All filters discussed above are supported in BIOPAC AcqKnowledge and BSL 4 software, as well 100C series  amplifiers, and can greatly enhance signal and data quality.

For further reading on filters, please see the following resources:

www.biopac.com/knowledge-base/high-pass-filters/

www.biopac.com/knowledge-base/band-pass-and-band-stop-filters/

For more information, please view our Fundamentals of Physiological Data Recording.


BIOPAC offers a wide array of wired and wireless equipment that can be used in your research. To find more information on solutions for recording and analyzing signals such as ECG, heart rate, respiration and more using any platforms mentioned in this blog post, you can visit the individual application pages on the BIOPAC website.

error: Content is protected !!