Best Practices for Recording & Analyzing Data

Over the past several years, tools and techniques for recording and analyzing physiological data recording have seen steady and marked improvement. Modern life science data acquisition systems such as the MP160 System and powerful research-grade software suites such as AcqKnowledge bring high-end physiology tools within reach of the smallest lab. Even with continuing advances and reduced margin for error, it remains prudent to follow some fundamental guidelines for maximizing data quality and clarity.

Preparation is important. First, invest time exploring the system if it’s new or unfamiliar. An overview of the documentation, training videos, and available webinars, as well as some practice runs with the hardware and software will save time and effort when the time comes to conduct a study. This will also build proficiency at identifying the differences between good and poor data.

Next, familiarize yourself with the type of electrodes and/or transducers necessary for the physiological signals you will be acquiring, which includes proper electrode and skin site preparation. For example, gently abrading the skin prior to applying electrodes is normally recommended for most signal types, except for electrodermal activity (EDA), in which case it’s vital to NOT abrade the skin beforehand. It is also helpful to wait at least 5 minutes before starting a recording, which enables the electrode gel to be absorbed into the skin, helping reduce the impedance.

Performing an impedance check to ensure that the electrodes are making good contact with the skin is also highly recommended. This task is made easier by using an Electrode Impedance Checker (such as EL-CHECK), a simple device for quickly measuring the resistance between the skin and the electrode that provides an LED readout of the skin/electrode contact quality. If the resistance is too high (indicating poor contact) proper adjustments can be made before starting an experiment.

For certain signal types, excessive participant movement can introduce unwanted artifact into the signal, resulting in poor or skewed data. Make sure the participant remains as still as possible during studies involving these signals. Using tape to attach the electrode leads to the skin and keep them from moving excessively can also be helpful.

A thorough check of the system and all connections, cameras, and other hardware is important, so that any problems with equipment or setup can be addressed in advance, thus avoiding a show-stopping issue in the midst of an experiment. This would include performing a pilot study with trained personnel in order to head off any unforeseen issues with the data collection.

Creating a lab setup conducive to a relaxed environment for the participant and technician alike will yield better results. This means eliminating clutter, noise, and other distractions that can affect comfort and attention span. Some labs even avoid having their staff wear lab coats because this can heighten participant nervousness.

Keeping detailed notes on successful lab setups is also helpful and will streamline the preparation process for future experiments. Additionally, creating and saving graph templates for regularly-repeated experiments will save further time and effort.

For more about the fundamentals of recording great data, we invite you to view this free on-demand webinar Fundamentals of Physiology Recording.


BIOPAC offers a wide array of wired and wireless equipment that can be used in your research. To find more information on solutions for recording and analyzing signals such as ECG, heart rate, respiration and more using any platforms mentioned in this blog post, you can visit the individual application pages on the BIOPAC website.

Photo by John Schnobrich on Unsplash

Exercise Physiology – Pulling Out All the Stops

Everyone has experienced showing up at the doctor’s office and being tasked with sitting very still while vital signs are taken. You sit almost trance-like, concentrating on slowing your heartbeat, willing your blood pressure down, avoiding any sudden movement that might affect the signals being monitored for posterity. It’s quite another matter when body signals are being monitored and measured from someone in full motion, particularly an elite athlete, all systems performing at maximum capacity. How are multiple facets of our physiology accurately captured when we are puffing and sweating at full exertion? Don’t these movements introduce artifact into the data and affect its quality? Won’t the result be an unusable mess? The truth is with proper setup and hardware, acquiring accurate signals from exercise physiology subjects has never been easier.

Signals typically and simultaneously acquired during exercise physiology studies are heartbeat (ECG), respiration (RSP), muscle activity (EMG), in addition to oxygen uptake, carbon dioxide production, blood pressure, core/surface temperature data, range of motion, and even GPS, if the participant is performing the activity outside the lab.

An important factor in exercise physiology studies is choosing the right electrodes, as well as their placement. We recommended using long-term electrodes, such as EL502, which can be worn up to 24 hours. If sweat is a problem, use stress electrodes which adhere better and are resistant to moisture. For even better adhesion to contoured parts of the body, use fabric electrodes. It is also important to prep the electrode site correctly, by first abrading the skin using an ELPAD, and making sure the electrode has sufficient conductive gel.

For measuring ECG signals, particularly Lead II, place the electrodes over bone such as a clavicle or rib to minimize movement artifact. For studies involving a lot of abdominal movement, a Lead I ECG configuration is recommended (left and right clavicle placement). This will help assure a good ECG signal during exercise.

If the participant is inside the lab (say, on a treadmill or exercise bike), a “wired” system, such as BIOPAC’s MP160 System with 100D-Series Smart Amplifiers is a good choice. Up to 16 channels of data can be acquired which can be extended to include 16 calculation channels of derived signals or online filters. For more freedom of movement, the MP160 System with BioNomadix wireless transmitters/receivers offer unrestrained comfort, including a BioShirt with built-in ECG fabric electrodes and RSP transducer. The wireless BioNomadix System has a range of 10 meters line-of-sight between transmitters and receivers. For long-term studies outside the lab, the BioNomadix Logger records and logs data for up to 24 hours while the subject goes about their protocol.

An additional wireless system commonly used for exercise studies is the Mobita System. Mobita is wireless, and like the aforementioned systems, works with the MP160 and AcqKnowledge software for recording and advanced analysis. Mobita is compact enough to fit in your hand and will record up to 32 channels of biopotential data.

No reason to keep still or be quiet any longer. With this many choices, acquiring high-quality exercise physiology data over a full range of body signals is within easy reach.

For more information about exercise physiology and how to maximize your results, we invite you to view our free webinar, Recording Great Data from Exercising and Mobile Subjects.

Why Smart Technology Is Smarter

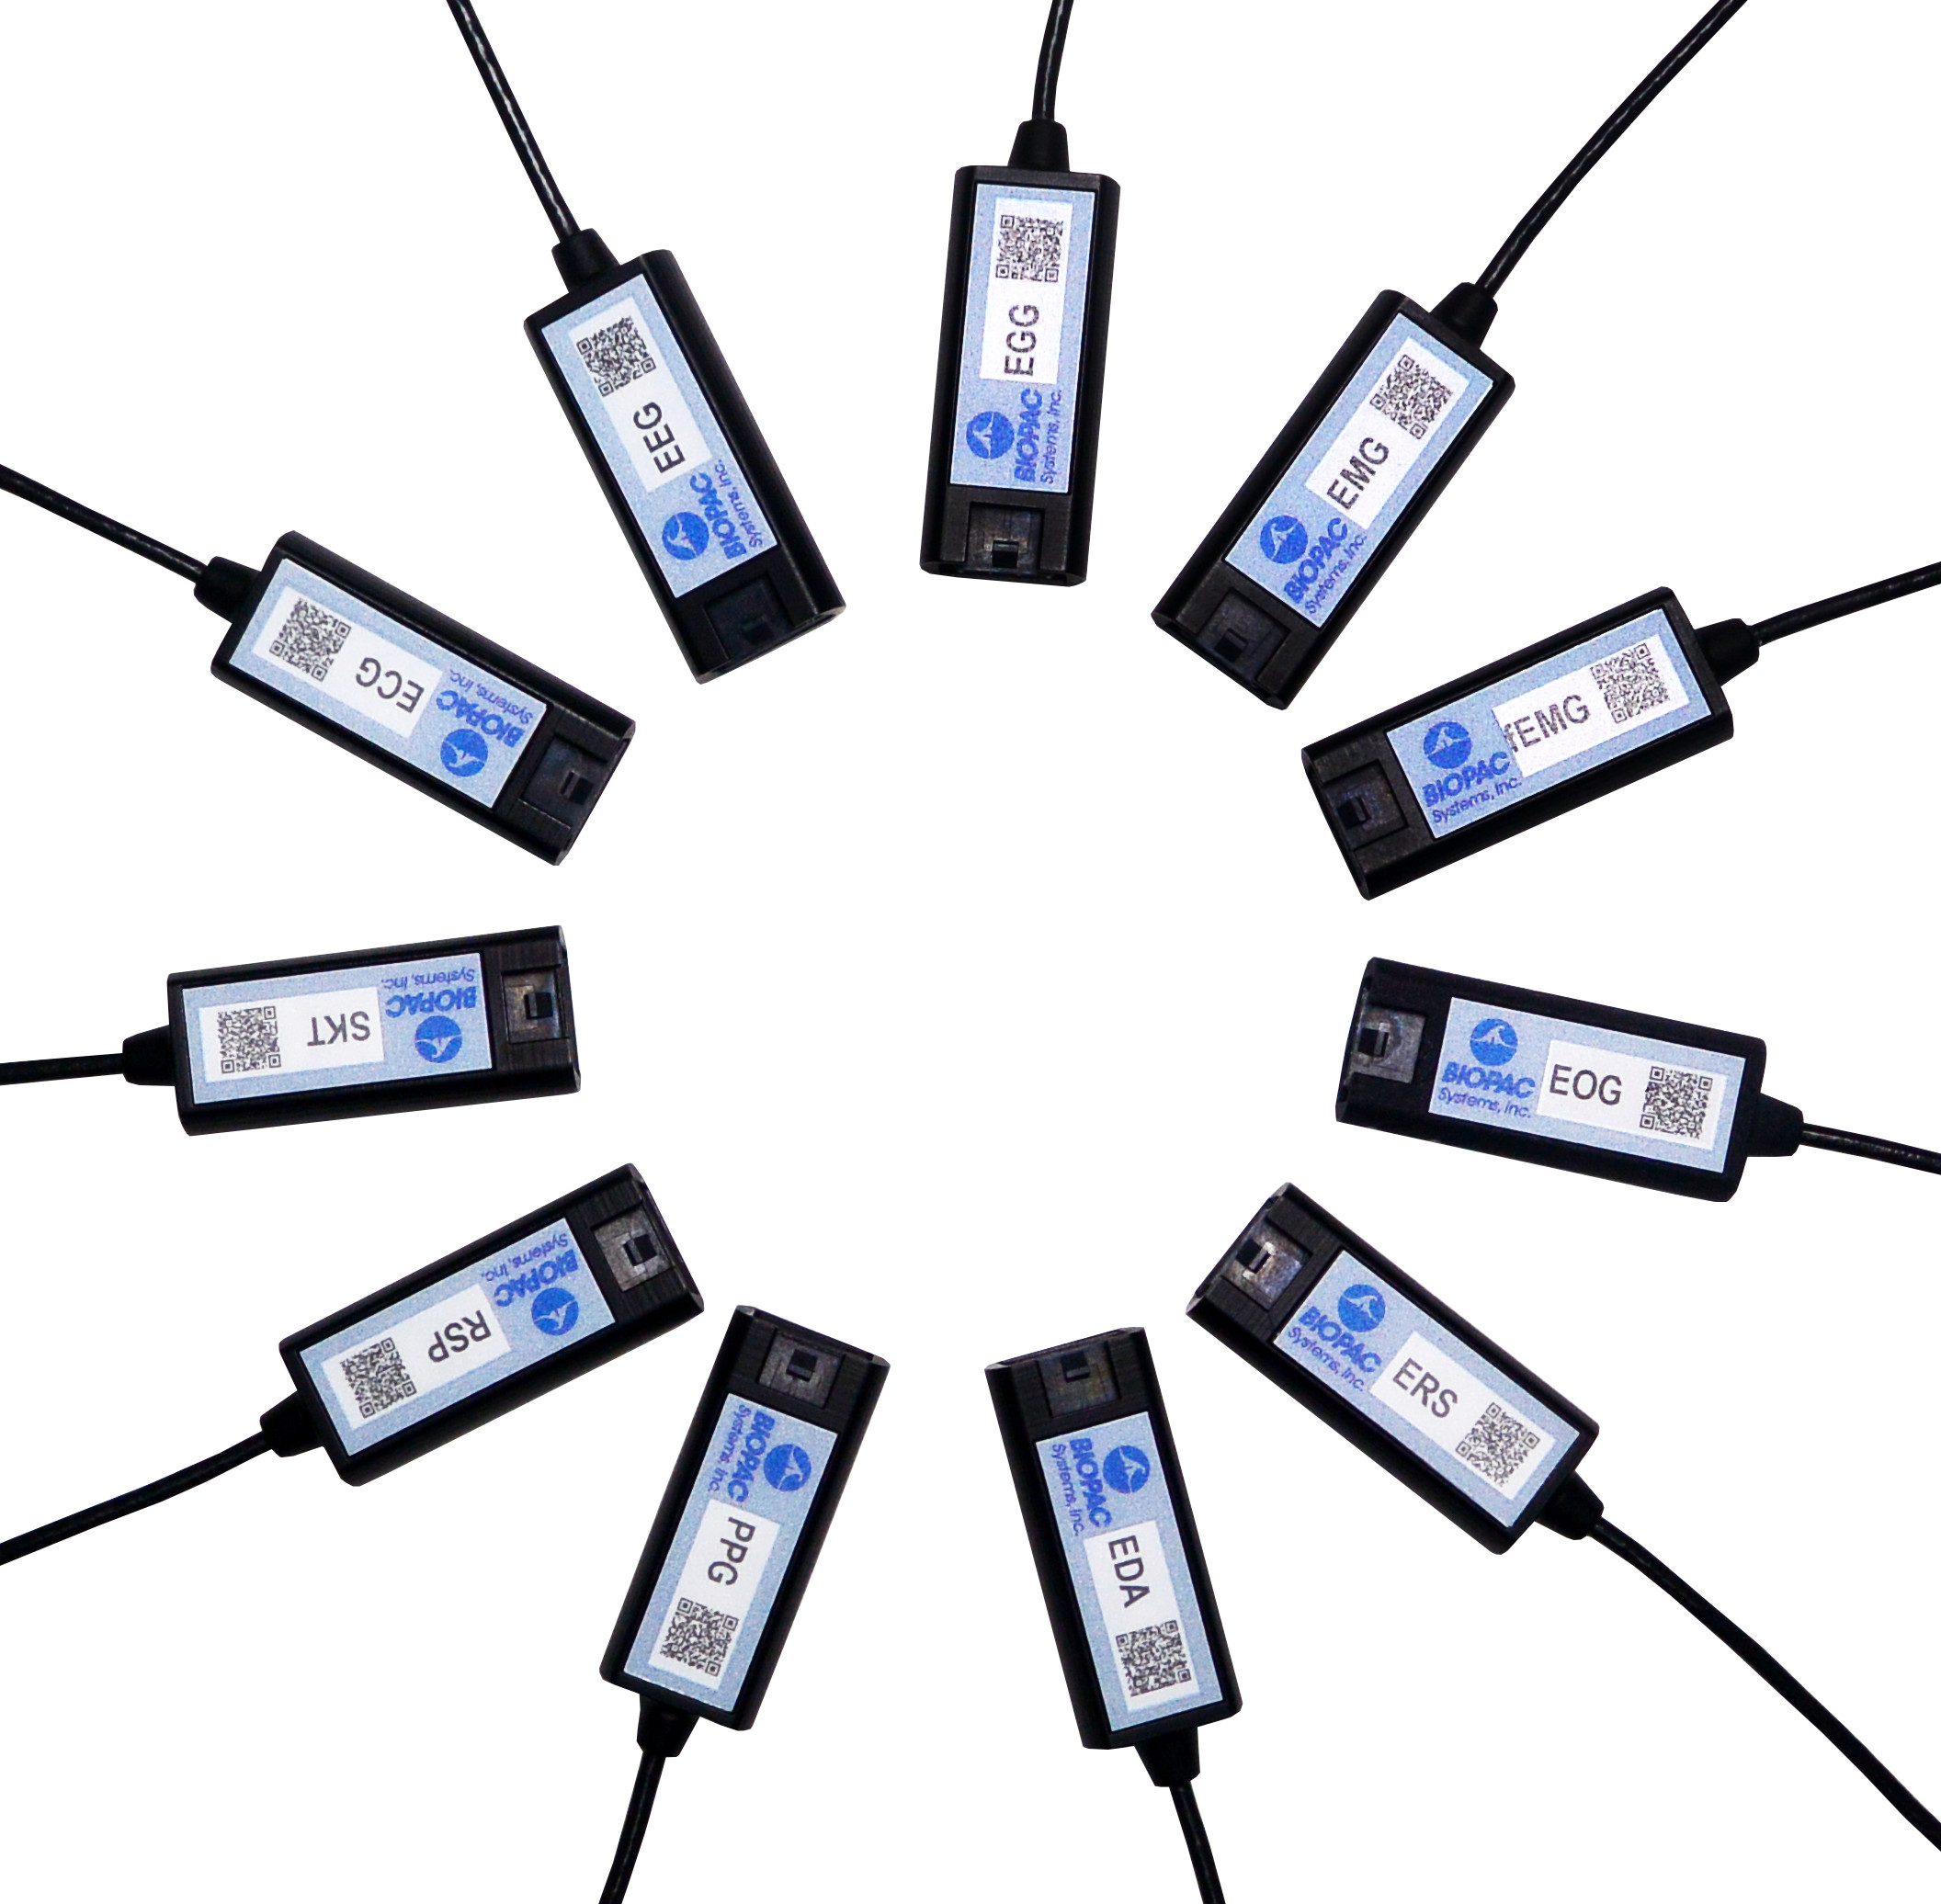
Physiological research studies require a great deal of focused expertise, including an ability to properly set up all necessary equipment for the study at hand. This has long consisted of overseeing a host of manual hardware connections and software settings, and mistakes can be frustrating. The good news is most users become proficient at these detailed configurations, but wouldn’t it be a welcome change if these setups were easier? Think about how helpful it would be if the hardware and software were “smarter” and actively worked on your behalf. This is now a reality with the smart technology offered by BIOPAC’s newly-released line of 100D Smart Amplifiers.

What is smart technology and what makes Smart Amplifiers smarter? To begin with, these amplifiers are significantly smaller than standard amplifiers (only 4.6 mm in length) and have no buttons or switches. The convenient lightweight design is a powerful benefit, enabling these amplifiers to be attached closer to the participant’s body. Because the amp itself is positioned near the signal source(via a lightweight 3-meter cable), the resulting data is of superbly high quality, with less noise and artifact than conventional amplifiers. But let’s get to the smart part. The smart technology in Smart Amplifiers enables them to do the setup work for you. Each Smart Amplifier, regardless of signal type,  self-configures to the optimally recommended settings, negating the need for user-defined adjustments or monitoring of physical switch positions. Simply plug the amplifier into the new AMI100D Input Module now included with every BIOPAC MP160 System, launch the AcqKnowledge software, and begin recording data.

To minimize setup time and errors in the lab, Smart Amplifiers utilize auto-detection and auto-identification technology. Not only do they self-configure, they also alert you (via a software dialog) whether the amplifier is connected to the correct channel. So basically, using Smart Amplifiers right out of the box is a three step process. 1) connect the amplifiers, 2) select any desired calculation channels for derived signals, 3) click Record. That’s it.

Frequently-used calculation channels or transformations are pre-configured for all signals and can be enabled by simply checking a box in the amplifier’s software UI. (For example, the ECG100D Smart Amplifier offers options to add heart rate and/or R-R interval, and will automatically place these derived signals in a separate calculation channel in the AcqKnowledge graph.)

Smart Amplifiers are available for the following signals: ECG, EEG, EGG, EDA, RSP, PPG, ERS, EOG, SKT, EMG and new fEMG (facial and small muscle).

Significantly smaller footprint, simple setup, unparalleled user comfort, superlative data quality, compatible with previous-generation BIOPAC amplifiers (such as 100C and BioNomadix Series), portable and lightweight, Smart Amplifiers will be an epiphany for your research.

To see Smart Amplifiers in action, we invite you to watch our free on-demand webinar New Smart Technology for the Lab.

BIOPAC offers a wide array of wired and wireless equipment that can be used in your research. To find more information on solutions for recording and analyzing signals such as ECG, heart rate, respiration and more using any platforms mentioned in this blog post, you can visit the individual application pages on the BIOPAC website.

Synchronize Participant Video with Physiological Data

AcqKnowledge software includes a Media feature that allows you to record and link participant video with physiological data. A common issue that crops up when analyzing physiological data with linked participant video is a lack of synchronization between the resulting video playback and onscreen data. This most often occurs when a USB webcam-type video camera is used. These types of cameras typically support a 30 frame-per-second rate whereas AcqKnowledge and the MP System can sample at rates up to 200,000 Hz. These factors can introduce an unwanted delay or misalignment between the video playback and data in the resulting AcqKnowledge graph.

So how do we synchronize these disparate signals to dovetail perfectly before recording our data and video? Fortunately, AcqKnowledge provides adjustment tools for addressing this common issue. This simple procedure requires the use of the AcqKnowledge software’s powerful Stimulator feature and a BIOPAC OUT103 LED Video Sync Cable.

Here is the sync method in a nutshell: With the OUT103 LED connected to the Analog Output of the MP160 unit’s HLT100C module, the AcqKnowledge software’s Stimulator is used to output a 5-volt square wave pulse into an AcqKnowledge graph, Using this setup, the LED illuminates when the 5-volt pulse is applied. The trick now is to use the AcqKnowledge Media feature and webcam to record a short video of the LED illuminating while the 5-volt pulse is being applied.

In the resulting graph, it’s easy to see in the Media playback screen when the light comes on by slowly advancing the AcqKnowledge software’s I-beam cursor through the graph data. Does the LED in the recorded video illuminate before the cursor reaches the 5-volt pulse? After? Or at the same time? Chances are, the recorded light will pop on slightly before or after the cursor reaches the pulse.

To compensate for this, the AcqKnowledge Delta-T measurement is used to determine the time interval between the pulse and when the recorded LED illuminates. For example, if the recorded LED lights up an indicated 185 ms before the onset of the pulse, then this discrepancy can be removed by setting a delay of 185 ms in the Media setup tools. If the LED lights up after the pulse onset, a negative delay must be set (ex. -185 ms). Once the playback delay is eradicated, the experiment can continue with confidence that all video and physiological data will be properly aligned.

It’s features such as this that enhance the usability AcqKnowledge Media feature, making it a powerful tool for recording and synchronizing participant video and audio during experiments. After a bit of practice, dialing in the playback video for linked Media acquisitions becomes second nature.

To see AcqKnowledge Media Synchronization in action, we invite you to view a free on-demand webinar covering this procedure in detail.

BIOPAC offers a wide array of wired and wireless equipment that can be used in your research. To find more information on solutions for recording and analyzing signals such as ECG, heart rate, respiration and more using any platforms mentioned in this blog post, you can visit the individual application pages on the BIOPAC website.

Small and Smaller – Untethered and Unfettered

Advancements in the engineering of data acquisition components have closely paralleled the microchip revolution. Ever-smaller form factors available in wireless transmission formats have resulted in a boon for researchers wishing to collect high-quality physiological data from participants in unfettered environments undreamed of a few years ago.

One of the linchpins of these cutting-edge systems is BIOPAC’s BioNomadix Series of wireless life science transmitters and receivers. BioNomadix modular receiver/amplifiers connect to the mother ship of the acclaimed MP160 System while the bite-sized matched transmitters attach to the participant, or comfortably nestle in a garment such as the BioNomadix BIOSHIRT. Unobtrusive specially designed leads connect to skin electrodes affixed to the participant, and BioNomadix units relying on transducers (such as respiration and skin temperature) offer equal convenience.

An even more streamlined system, the BioNomadix Smart Center, is also available. This system combines BioNomadix transmitters with the Smart Center all-in-one receiver and data acquisition unit. The soap bar-sized Smart Center connects to a computer USB port and supports up to 9 channels of physiological data from up to three wireless BioNomadix transmitters. (All BioNomadix transmitters are supported but connection is limited to three at a time.)

BioNomadix transmitters are dual-channel or dual-signal, with the exception of the Accelerometer, which supports three channels (X, Y, and Z axes).

Acquired signals are of extremely high quality and clarity and are rendered in AcqKnowledge Research Software. BioNomadix systems are available for fourteen body signal types, including ECG, RSP, PPG, EDA, EOG, EEG, EMG, EGG, ACCL, SKT, Goniometer, Dynamometer with EMG, Cardiac Output, and Heel-Toe Strike.

What does all of this mean to the researcher? Nearly unlimited freedom of movement at distances up to 10 meters from the receiver units—opening up new avenues of research and even new vistas in artistic expression.

A stunning and eclectic example of the latter can be taken from this brief performance by Compagnie Linga, a contemporary dance company based in Lausanne, Switzerland. Dancers wore BioNomadix accelerometers to record transmit their movements in real time, which were then digitally rendered in sound. The result is a tableau of dance and self-generated musical accompaniment, an artscape created from the firings of human physiology.

For more information about BioNomadix, please see:

BioNomadix Wireless Amplifiers

BioNomadix Wireless EMG for Neuro-Controlled Prosthetic

Free On-Demand Webinar – Recording Great Data from Exercising and Mobile Subjects

BIOPAC offers a wide array of wired and wireless equipment that can be used in your research. To find more information on solutions for recording and analyzing signals such as ECG, heart rate, respiration and more using any platforms mentioned in this blog post, you can visit the individual application pages on the BIOPAC website.

The Trouble with Fatigue

Fatigue is a troublemaker–it can have serious impacts on data quality, even when using gold standards of measurement.

Fatigue is a known troublemaker in athletics, but can also have negative effects in physiology research. Fatigue can become a confounding variable, giving researchers data that may be less accurate or reliable.

Men and women may respond to fatigue differently, which can make obtaining good data especially difficult. In one study on fatigue by Stern et al. (2012), the researchers attempted to monitor fatigue and show different effects between men and women. This study attempted to follow a central nervous system component, as well as the peripheral nervous system. Using the BIOPAC MP160 system with AcqKnowledge software to record and analyze EMG, researchers were able to continually monitor muscle and neuron activation during the exercise tests.

The results of the study found that females had a higher rate of reduced central neural drive of the quadriceps, coupled with knee extension torque preservation. These factors, when paired together, can create a higher percentage for the possibility of knee injury for women.

With coffee being such a staple in the home (and in the lab!), researchers Smirmaul et, al (2017) wanted to see if coffee had any effect on fatigue, duration of exercise, and the perception of effort. This study used seven adult male cyclists in moderate hypoxic states to obtain their results. The experiment used a double-blind procedure, with some participants receiving no coffee. The researchers wanted to see if the coffee participant group took a longer time to reach fatigue. EMG was obtained by using BIOPAC MP160 with EMG amplifiers. The results showed that coffee has no effect on fatigue, but coffee did improve the time it took until the athletes reached exhaustion in high endurance tasks. The researchers believe that coffee lowers the perceived effort of the athlete, leading them to think they can go further.

Fatigue can also have impacts on data, even when using gold standards of measurement. A separate study done on fatigue by Neyroud et al. (2016), attempted to show that muscle fatigue has an effect on the validity of the ITT (Interpolated Twitch Technique). The ITT is used to evaluate the capacity of the central nervous system in activating skeletal muscles. This study used BIOPAC’z MP research system with EMG amplifiers to monitor muscle and neuron activation. Electrical stimulus was given to both samples to create fatigue, and a separate stimulus was given to mimic the ITT. This study found that peripheral fatigue factors do have an effect on the outcome of the ITT.

BIOPAC offers a variety of equipment that can be used in studies similar to the ones presented. To find more information on solutions for recording and analyzing signals such as EEG, EMG, respiration, skin conductance using the MP160/MP150, MP36, and other platforms, you can visit the individual application pages on the BIOPAC website. If you are interested in reading other related studies, visit the publications page on the BIOPAC website.

error: Content is protected !!