
The Physiology of Election Decision-Making

The psychophysiological factors of stress, the behaviors of others, and of introception can play major roles in decision-making, and BIOPAC systems provide measurements of how physiological factors such as these influence decisions.

People experienced varying stress levels because of the 2016 US presidential election. There are a variety of factors that can impact voting behaviors and decision-making. Several recent studies using BIOPAC systems investigated the psychophysiological effects of stress, the behaviors of others, and introception on decision-making.

Stress has been shown to be very influential in decision-making. In their study, Yamakawa, Ohira, and Mastunga Isowa (2016) investigated effects of acute stress and risk taking in decision-making. Participants were asked to perform a decision-making choice where they either kept or bet the money they were given. Cardiodynamic activity was measured with ECG using a BIOPAC MP system. Results suggest that with an increase in cortisol, adrenaline, heart rate, and subjective stress, participants were likely to make fewer risky choices. So, high levels of stress may be key in helping make better decisions when selecting a future president.

Perhaps it’s not stress that will influence the choice of the next POTUS (President of the United States), but rather the behaviors of others. Work by Bault, Joffily, Rustichini, and Coricelli (2011) sought to compare private and social decision-making to discover the effect of social comparison on risky choices. The objective of the study was to understand more about how individuals evaluated the outcomes of their decisions in private as opposed to in a social context. Combining data from functional MRI (FMRI) and skin conductance recordings, subjects’ reactions were measured using a BIOPAC MP150 System. Researchers found that participants took significantly longer to make a decision in a social setting than in a private one.

In the end, many feel that it is important to listen to your heart when deciding who you find qualified to be the next president. A study by Dunn et al. (2010) examined whether introception moderates the coupling of bodily responses to emotional experience and intuitive decision-making. Bodily response and heart rate were recorded using a BIOPAC Research System and electrodes to measure introception through changes in heart rate. Researchers found that introception was not related to arousal, valence ratings, or heart rate response to images.

For more information on BIOPAC’s wide range of tools for recording, displaying, and analyzing physiological measurements from human and animal subjects including respiration, heart rate variability, ECG and EDA, visit BIOPAC’s  psychophysiology page and view BIOPAC’s full line of electrodes, amplifiers, and wearable, wireless transmitters and loggers.

BIOPAC Systems, Inc. provides life science researchers and educators with data acquisition and analysis systems that inspire people and enable greater discovery about life. Visit us at www.biopac.com.
Dark Current Measurement as a Noise Management Tool

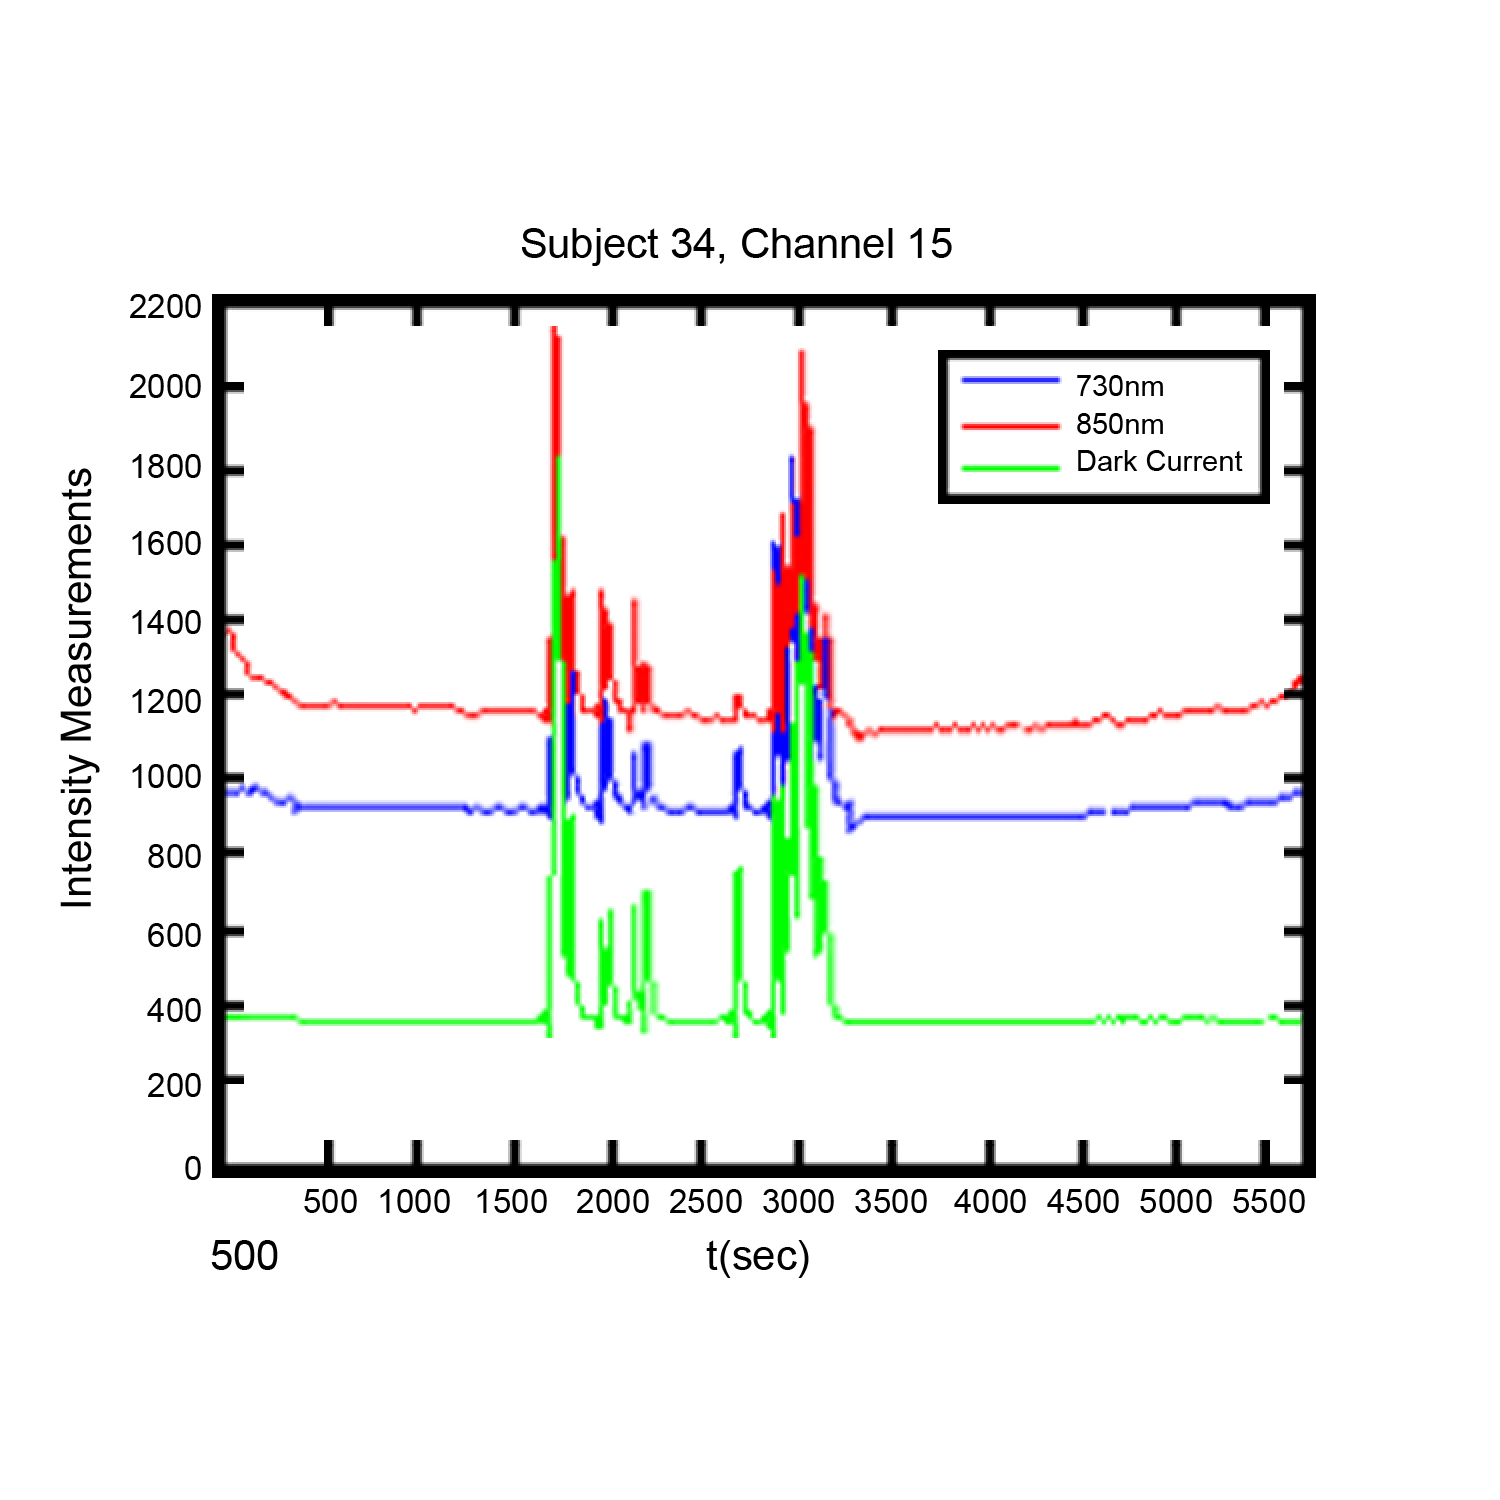
Noise in functional near infrared (FNIR) imaging data utilized for neurophysiological brain functioning research is a challenge to researchers, The use of dark current measurement in functional near infrared (fNIR) brain imaging can provide a valuable tool in identifying and managing certain type of noise in recordings.

By Davood Tashayyod, FNIR Devices

The use of dark current measurement in functional near infrared (fNIR) brain imaging (measurements taken not only when LED type light sources shine light at wavelengths 730 and 850 nm but also when they do not shine light (dark current condition)) can provide a valuable tool in identifying and managing certain types of noise in recordings.

Noise in functional near infrared (fNIR) imaging data utilized for neurophysiological brain functioning research is a challenge to researchers, in that excessive or unmanaged noise may pose a risk to the quality of gathered data and hence in the interpretation of the results. This noise arises from two general categories of sources, biological sources and non-biological sources. It should be noted that sources of noise are routinely present, so that noise cannot be eliminated but rather must be managed. Biological sources of noise include the respiratory and cardiac cycles and slow vasomotor oscillations. Non-biological sources of noise may include contamination from other external devices and noise induced by improper sensor application (light leakage, in the case of fNIR sensors), cable movements, or instruments or equipment used in the course of the experiment. These sources, independently or in combination, can mask the signals of interest.

Close attention to good laboratory practices, to include proper sensor placement, trial runs to establish baselines, and other techniques can help to reduce noise. Close attention to experiment protocols during the experiment can also be of assistance. However, it is in post-experiment data processing and analysis phases that the researcher has the greatest number of tools to manage noise. These tools include intuitive or visual analysis, filtering, and specialized analysis. Each method has strengths and weaknesses, but used in combination they offer a reliable method of managing noise and improving data quality.

Visual or intuitive analysis depends upon researcher experience and qualification, and some artifacts may be too small to be readily apparent. Filtering is useful, but in some range of measurements noisy data segments may be so great or may not contain any signal originated from the brain such as in the case when the sensor loses contact with the skin and captures data only from the ambient that it may not make sense to remove noise, rather such data segments should be identified and discarded.

Specialized analysis, such as dark current measurement, provide a very useful method for both identifying the noise not readily apparent to the naked eye and identifying data segments where filtering is likely to not be useful. A discussion of the use of dark current measurement can be found here.

For more information on optical braining imaging systems, visit BIOPAC’s fNIR page. BIOPAC also provides a wide range of tools for recording, displaying, classifying, and analyzing psychophysiological measurements—including EEG, ECG, EDA, PPG, and emotional states—visit BIOPAC’sapplications pages and view BIOPAC’s full line of physiology data acquisition and analysis systems, electrodes,amplifiers, and wearable, wireless transmitters and loggers.

BIOPAC Systems, Inc. provides life science researchers and educators with data acquisition and analysis systems that inspire people and enable greater discovery about life. Visit us at www.biopac.com.
Practical Tips for Recording Physiological Data in MRI

The MRI system incorporates a VERY strong magnetic field and both emits and records radio frequency (RF) energy. This has impacts on subject and experimenter safety and on data accuracy.

By Alan Macy, BIOPAC Systems, Inc.

When recording physiological signals from subjects in MRI systems, two issues are very important:

  1. The MRI system incorporates a VERY strong magnetic field. It is extremely important that no significant magnetically susceptible objects are taken into the room that houses the MRI System.  All materials have some degree of magnetic susceptibility. However, materials with mass magnetic susceptibility values, similar to or have magnitude less than that of water (-0.91E-8 m^3/kg), are typically permitted to be used in the vicinity of MRI Systems. No electrodes, electrode leads, transducers or cabling, that contain significant magnetically susceptible components, should be used when recording data from a subject in the MRI.
  2. The MRI System both emits and records radio frequency (RF) energy. This energy is typically in the range of 5 to 500 MHz. For a 3T MRI, the characteristic proton precession frequency will be 3T * 42.7 MHz or 128.1 MHz.  MRI generated RF energy will, at least, partially reflect from encountered conductors and induce current flow in those conductors. Signal reflections and induced currents can disrupt sensitive imaging operations by creating signal artifacts. Also, RF induced currents, if not properly controlled, can cause local heating.

Care must be taken to limit the flow of RF energy both in and out of the room that houses the MRI. RF energy from the MRI superimposes with the very small biopotentials and transducer signals in the vicinity of the subject. Alternatively, RF energy from recording or other equipment in the MRI Control Room (e.g. digital clocks and power supply switching noise) can leak into the MRI chamber, via subject cabling, and cause degradation of the image created by the MRI. It can be complicated to record biopotentials, from a subject’s body, during an MRI scan. These signals are very tiny and the RF energy, and associated magnetic field shifting, generated by the MRI corrupts the recording. Accordingly, successful biopotential recording in the MRI involves the use of specialized amplifiers, optimized cabling, patch-panel filtering, advanced signal processing and/or synchronization with MRI scanning processes to perform clean measurements.

When RF energy is pulsed into the subject, this energy spreads throughout the subject because the subject is a volume conductor. As the MRI magnetic gradient shifts in synchrony with RF energy pulsing, the gradient shift induces a current flow in conductors that intersect with the field. From a practical standpoint, RF energy pulsing and gradient-induced current flows often manifest themselves as repetitive artifact signals directly in the band of the physiological generated biopotentials. This is because RF energy pulsing and magnetic field gradient switching are performed synchronously for imaging and the repetition rates for image slice generation usually fall within the range of 1-100 Hz. Depending upon the biopotential frequency range (from lowest to highest: EGG, EOG, ECG, EEG and EMG), different amplification and signal processing techniques can be used to isolate the signal of interest. Furthermore, it’s often helpful to control imaging processes so that the MRI artifact signal spectrum does not unduly impact the measured physiological signal spectrum.

For more information on BIOPAC’s MR Safe and MR Conditional solutions, visit BIOPAC’s MRI page or view BIOPAC’s full line of electrodes, amplifiers, and wearable, wireless transmitters and loggers.

Download a related and important application note that describes the relationship between MRI imaging sequences and associated physiological measurements, when subjects are monitored in the MRI. In particular, this note addresses newfound insights on the impact that imaging sequence types have upon simultaneously recorded electrocardiography (ECG) and impedance cardiography (ICG) subject measurements.

BIOPAC Systems, Inc. provides life science researchers and educators with data acquisition and analysis systems that inspire people and enable greater discovery about life.  Visit us at www.biopac.com.

Signal Artifact Associated with MRI

By Alan Macy, BIOPAC Systems, Inc.

When performing MRI and simultaneously recording time-series physiological data, there are two basic types of artifact associated with MRI processes. The first type of artifact is associated with the presence of the large constant MRI magnetic field.  This type of artifact is typically called “magnetohydrodynamic effect” (MHD). MHD artifact results from movement of conductive fluid (blood) and from the movement of charge inside the body, when exposed to a magnetic field. A motional electromotive force (Vemf) is generated when a conductor moves through a magnetic field. Also, a charge moving in a magnetic field may have its travel path affected by the field. This two phenomenon can distort, and superimpose with, an existing biopotential signal. The most prominent MHD effects occur in the vicinity of the heart. The aortic arch is aligned perpendicularly to the MRI magnetic field and this geometry is conducive to creating large magnitude MHD artifacts in the ECG signal. Aortic blood flow is highest during systole, which corresponds to the ST segment in the ECG signal, so the largest MHD artifacts occur during this period. MHD effects are easily seen when measuring ECG inside the MRI, even when scanning is off. In this situation, the ECG signal will usually distort to the point of being non-diagnostic, such as lengthening QRS time and increasing T-wave amplitude.

The second type of artifact is associated with the time-based scanning processes occurring within the MRI. During scanning, two sources generate artifacts during biopotential measurements in the MRI. The first source is associated with magnetic field gradient switching during EPI or other scanning sequence. As the magnetic field changes orientation with respect to the biopotential electrode lead-subject-amplifier loop, a current is induced in the loop. The magnitude of induced current is proportionally linked to the loop area and number of turns in the loop. The second source is associated with radio-frequency (RF) pulsing coincident with gradient switching during the scanning sequence.  The RF is at the Larmor frequency and couples to the biopotential loop conductors, which include electrodes, electrode leads and subject. RF energy can circulate in this loop because the biopotential signal conductors will travel through the cable harness to the patch panel connectors separating chamber room from control room. RF energy will couple throughout the cabling harness due to distributed capacitance in the cable, thus establishing an RF conducting loop that includes subject, electrodes, electrode leads and distributed capacitance in cable harness.

For more information on BIOPAC’s MR Safe and MR Conditional solutions, visit BIOPAC’s MRI page or view BIOPAC’s full line of electrodes, amplifiers, and wearable, wireless transmitters and loggers.

Download a related and important application note that describes the relationship between MRI imaging sequences and associated physiological measurements, when subjects are monitored in the MRI. In particular, this note addresses newfound insights on the impact that imaging sequence types have upon simultaneously recorded electrocardiography (ECG) and impedance cardiography (ICG) subject measurements.

BIOPAC Systems, Inc. provides life science researchers and educators with data acquisition and analysis systems that inspire people and enable greater discovery about life.  Visit us at www.biopac.com.

error: Content is protected !!