Holiday Happiness: Gratitude or Gifts?

Studies investigated the anxiety of gift-giving, the effects of social support in stressful situations, and what impact meditation has on heart rate, ECG, and blood pressure.

December has arrived, and for many the holidays bring a rush to check items off of a long shopping list for parents, siblings, friends, in-laws, and many more. Often we struggle to find that “perfect” gift, but are the physical goods we exchange the true source of the warmth and happiness that characterizes the season?

An article by Nomura investigated anxiety induced by gift-giving. To test this, EDA data was recorded with a BIOPAC data acquisition system and STP100 while participants responded to stimuli. The participants visualized a specific relative while being presented with potential gift options, and were asked how likely they were to purchase the potential gift for that relative. The data found that people who self-reported thinking of in-laws were the most stressed, while those who reported thinking of children or same-gender friends were least stressed.

A psychosomatic study by Inagaki and Eisenberger found that mental and physical well-being benefit from forms of social support. They tested this by administering mild shocks with the BIOPAC STMISOLA to male patients who held the hand of a female partner lying in an fMRI. The results suggest that this support (hand-holding) provided possible stress-reduction for both the male and female participants.

Another article on nonverbal communication and well being by Shaltout, et al. tested the effects of meditation and the subsequent ECG, blood pressure, and heart rate effects. The BIOPAC ambulatory BioHarness and NIBP Blood Pressure System gathered data while participants underwent several mediation episodes, during which they were instructed to focus on loving kindness towards a subject. The results found that participants had decreased heart rate.

Research suggests direct, loving interactions with those who are close to us have many stress-reducing benefits. So when you are shopping for gifts, remember that spending time is more important than spending money. To read more studies about love and stress reduction, visit the BIOPAC publication page.

BIOPAC offers a variety of equipment that can be used in studies similar to the ones presented. To find more information on solutions for recording and analyzing signals such as EEG, EMG, respiration, and EDA using the MP160/MP150, MP36, and other platforms, you can visit the individual application pages on the BIOPAC website. 

BIOPAC Systems, Inc. provides life science researchers and educators with data acquisition and analysis systems that inspire people and enable greater discovery about life. Visit us at www.biopac.com.

The Physiology of Consumer Buying Habits

On “Black Friday” in the US, shoppers will come out in search of great deals, and researchers can measure the many physiological factors that motivate shoppers other than deals and price cuts.

Black Friday is one of the most exciting days for consumers in the United States. With the holidays right around the corner, significant deals and price cuts incentivize people to do bulk gift shopping. But is price the only factor influencing shoppers to dedicate hours waiting in line for a product?

In a neurophysiology study by Alexander et al., researchers found that participants who received a coupon while shopping online had a significant increase in oxytocin and a decrease in cortisol. A BIOPAC research system was used to gather ECG, respiration, and skin conductance data while the participants browsed a commerce website.

Another article by Ha-Brookshire and Bhaduri measured ECG response to stimuli that tested consumers’ perceived trust of businesses. The BIOPAC MP36R was used to record participants’ heart rates while they read negative reviews of an apparel business. The results found lower heart rate and less trust were correlated with the less favorable comments.

Conversely, a consumer research study by Langner et al. found that consumers’ love of brands is similar to their love of friends. Signals measured included EDA, EMG, ECG, and BPV, and were recorded by BIOPAC MP160/MP150 hardware to measure arousal levels while participants viewed different brand and interpersonal stimuli.

BIOPAC offers a variety of equipment that can be used in studies similar to the ones presented. To find more information on solutions for recording and analyzing signals such as EEG, EMG, respiration, skin conductance using the MP160/MP150, MP36, and other platforms, you can visit the individual application pages on the BIOPAC website. If you are interested in reading other related studies, visit the publications page on the BIOPAC website.

BIOPAC Systems, Inc. provides life science researchers and educators with data acquisition and analysis systems that inspire people and enable greater discovery about life. Visit us at www.biopac.com.

Respiration and ECG

By Alan Macy, BIOPAC Systems, Inc. The mechanical relationship between the diaphragm and heart and Respiratory Sinus Arrhythmia (RSA). are two influences of respiratory activity on the electrocardiogram (ECG).

By Alan Macy, BIOPAC Systems, Inc.

There are two influences of respiratory activity on the electrocardiogram (ECG). The first influence is characterized by the mechanical relationship between the diaphragm and heart. The second influence is a consequence of respiratory action on the vagus nerve and is known as Respiratory Sinus Arrhythmia (RSA).

  1. The position and movement of the diaphragm determine the position of the heart because the pericardium is firmly attached to the central tendon of the diaphragm. With deep inspiration, the diaphragm contracts and becomes flatter and less dome-shaped. As it does, the heart descends, moves backward, and rotates to the right so that it becomes narrower and more vertical. The apex beat is lower and more medial. During deep expiration, the diaphragm relaxes, elevates, and becomes more dome-shaped, and movements of the heart are the converse of those that occur during deep inspiration. The degree of the directional movements of the heart during quiet breathing is similar, but reduced, compared to deep breathing and, in some persons, may be hardly noticeable. Diaphragmatic breathing cyclically affects the position of the heart, thus modifying the ECG.
  2. Heart rate increases during inhalation and decreases during exhalation. Heart rate is normally controlled by centers in the medulla oblongata. One of these centers, the nucleus ambiguus, increases parasympathetic nervous system input to the heart via the vagus nerve. The vagus nerve decreases heart rate by decreasing the firing rate of the sinoatrial (SA) node. The SA node is the “pacemaker” of the heart. Upon expiration, the cells in the nucleus ambiguus are activated and heart rate slows down. In contrast, inspiration triggers inhibitory signals to the nucleus ambiguus and consequently the vagus nerve remains unstimulated. When recording the ECG, this phenomenon is experienced as subtle changes in the R-R interval that appears synchronized with respiration. This is the time period between two “R” waves on an electrocardiogram. The R-R interval associated with the ECG is shortened during inspiration and prolonged during expiration.

For more information on BIOPAC’s wide range of tools for recording, displaying, and analyzing ECG measurements from human and animal subjects including respiration, heart rate variability, and RSA, visit BIOPAC’s electrocardiography pages and view BIOPAC’s full line of electrodes, amplifiers, and wearable, wireless transmitters and loggers.

BIOPAC Systems, Inc. provides life science researchers and educators with data acquisition and analysis systems that inspire people and enable greater discovery about life. Visit us at www.biopac.com.

Electrocardiography (ECG)

Electrocardiography (ECG) is a graph of electrical activity of the heart (cardiac) muscle as it changes over time. The basic principle of the ECG is that periodic waves of propagated electrical stimulation cause cardiac muscle to alternately contract and relax.

By Alan Macy, BIOPAC Systems, Inc

Electrocardiography (ECG) results in a graph of electrical activity of the heart (cardiac) muscle as it changes over time. Cardiac muscle contracts in response to electrical depolarization of the heart muscle cells. The ECG is the measured sum, over time, of this electrical activity as it is recorded from electrode connections.

Willem Einthoven’s contribution to ECG recording technology was the development of the string galvanometer that had improved sensitivity over the capillary electrometer. In 1908, Willem Einthoven published a description of a medically useful ECG recording system. This ECG system employed a specific lead connection method presently known as the Einthoven lead system. The Einthoven lead vectors are based on the assumption that the heart is located in a conductive volume. The Einthoven lead vectors are defined as:

Lead I: LA – RA

Lead II: LL – RA

Lead III: LL – LA

Where:

LA is Left Arm

LL is Left Leg

RA is Right Arm

The basic principle of the ECG is that periodic waves of propagated electrical stimulation cause cardiac muscle to alternately contract and relax. These electrical stimulation waves are transmitted from cardiac muscle cell to cell via gap junctions that connect between the cells. The electrical waves spread through the cardiac muscle cells because of cascaded changes in ions between intracellular and extracellular fluid. When the cardiac muscle cells are in a resting (polarized) state, the insides are negatively charged compared to the outsides. Cell membrane pumps maintain this electrically polarized state. Contraction of cardiac muscle is triggered by depolarization. Following depolarization, the cardiac muscle cells return to their resting charge. This process is called repolarization. These waves of depolarization and repolarization result in a changing electrical potential and can be detected by placing electrodes on the surface of the body.

The normal cardiac cycle begins with spontaneous depolarization of the sinoatrial (SA) node, a small volume of specialized tissue located in the right atrium. The SA node sets the rate of the heartbeat. The SA generated wave of electrical depolarization then spreads through the right atrium and across the inter-atrial septum into the left atrium causing the atria to contract. This contraction pushes blood into the ventricles. The atria are separated from the ventricles by a ring of non-conductive tissue. Accordingly, the only conductive path of electrical depolarization, from atria to ventricles, is through the atrioventricular (AV) node. The AV node is a cluster of cells in the center of the heart between the atria and ventricles. The AV node is a pathway that slows the electrical depolarization wave before it enters the ventricles. The wave of depolarization travels down the interventricular septum, through the His-Purkinje fiber network, to the left and right ventricles. The AV node delay gives the atria time to contract, before the ventricles do, to establish robust pumping action. In addition, with normal conduction, the two ventricles contract simultaneously to further maximize cardiac performance. After a volume of cardiac muscle cells depolarizes, the cells repolarize for the next cardiac cycle.

The net (average) path of electrical depolarization, through the heart, is known as the electrical axis. A fundamental ECG measurement principle is that when the wave of electrical depolarization travels toward a recording lead, this results in a positive voltage on that lead. When the wave travels away from a recording lead this results in a negative voltage on that lead. During repolarization, net wave activity towards or from a recording lead results in the opposite polarity as compared to depolarization.

The nature of the repolarization wave is different, from that of the depolarization wave, in that repolarization is not a propagating phenomenon. Cardiac muscle cell repolarization only occurs after the depolarization action potential duration, so cell repolarization does not depend on the repolarization of an adjoining cell. Assuming the action potential of all cells have equal duration, the repolarization wave would follow the same sequence as depolarization wave. However, in considering the entire extent of cardiac muscle, action potential duration is not identical between cells.

Meaning of ECG waves –

P wave: Depolarization of the right and left atria

QRS complex: Depolarization of the ventricles

T wave: Repolarization of ventricles

Meaning of ECG intervals –

PQ interval: Time period between start of atrial depolarization to start of ventricular depolarization

QRS duration: Time period of ventricular depolarization

QT interval: Time period between start of ventricular depolarization and end of ventricular repolarization

RR interval: Time period of complete cardiac cycle (inverse of heart rate).


For more information on BIOPAC’s wide range of tools for recording, displaying, and analyzing ECG measurements from human and animal subjects, visit BIOPAC’s electrocardiograpy, epages and view BIOPAC’s full line of electrodes, amplifiers, and wearable, wireless transmitters and loggers.

BIOPAC Systems, Inc. provides life science researchers and educators with data acquisition and analysis systems that inspire people and enable greater discovery about life. Visit us at www.biopac.com.

Ensuring Error-free NIBP Measurements & Accurate Data

Correct subject set-up of upper arm cuff, CNAP® NIBP finger sensor and CNAP® controller is essential to ensure accurate data reading and collection of continuous blood pressure and hemodynamics with the NiBP 100D throughout the measurement.

By Dr. Jürgen Fortin, CEO, CNSystems

The NIBP100D provides proven accuracy for blood pressure and, using the  NIBP100-HD, full hemodynamics with validation in a number of settings and against research and clinical gold standards. Subject setup with the NIBP100D upper arm cuff and reusable finger sensor is extremely easy, however, please keep the following practical tips in mind to ensure accurate data collection:

1. Upper arm Cuff: Sizing and placement

Over the years, upper arm cuffs have become a standard measurement in basic research setup providing brachial pressure intermittently (timed intervals) rather than continuously (for every heart beat).

The NIBP100D has an upper arm cuff (Suntech Medical) integrated to provide calibration for the continuous finger sensor. For accurate calibration please mind the following steps:

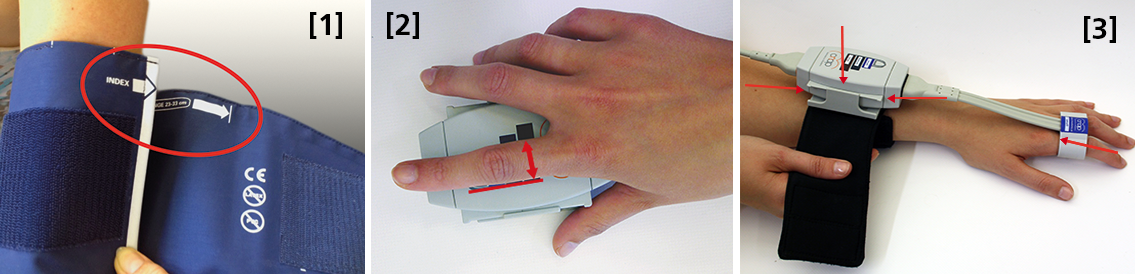
 Size: using a too small or too big upper arm cuff can lead to significant over- /or under- reading of blood pressure. Always ensure you choose the right size ( four sizes are provided with the NIBP100D) by using the range marker on the inside of the cuff–see image #3 in the photo above or review setup procedures here:

  • When wrapping the cuff around the upper arm before fixing the Velcro, ensure the white “index” arrow points into the indicated range area. If it does not, use the bigger or the smaller cuff! 
  • Placement: always align the artery marker (white arrow) on the cuff with the brachial artery (in the crook of the arm). The cuff can be placed ipsilaterally or contralaterally to the arm with the CNAP finger sensor on.
  • Wrapping: pull the upper arm cuff so tight that you could still get about 2 fingers under the wrapped cuff (air volume).

SunTech has developed a short video on the basics of measuring blood pressure. Although designed for a clinical audience, the video provides good information for researchers. Watch the SunTech NBP training video here.

2. CNAP finger sensor: Sizing and placement

Using a too small or too big finger sensor cuff can distort the continuous blood pressure readings. Avoid placing the sensor on finger joints, which may lead to a poor or even no signal. 

Size: Choose the right size from three different sizes by using the size indicator on the top of the CNAP Controller:

  • Put the proximal phalanx of the index finger on the indicator align with the grey line on the left. Choose the sensor size indicated on the shortest bar which is still visible.
  • Always use the larger sensor if you are in doubt about the size.
  • In some subjects it may be difficult to place the finger sensors on the proximal limb (i.e. finger-arthrosis, too short finger joints). In these cases, try placing the finger sensors on the middle limbs. However, make sure that the sensors are not placed over the finger joints. Hold the sensor in place or use medical tape until the sensor is inflated (start of measurement).

With the CNAP Software V5.2, sensor sizing becomes even easier—the size of the finger sensor is checked automatically upon start and the software gives notice if it does not fit. 

  • Placement: The finger sensor is placed on two neighboring fingers and slid back fully to the proximal limb!
  • Make sure not to place them on the finger joints!

3. CNAP Controller:  correct placement

The slide for the CNAP Controller allows for slight hand movement without dislocating the CNAP finger sensor. It is very important that the CNAP Controller is correctly placed:

  • Placement: Make sure that the CNAP Controller is placed in central position of the slide.
  • If the CNAP Controller is not placed correctly, the CNAP finger sensor might be pushed forward on the finger joints. 
  • View detailed pictures of CNAP Monitor Set Up Overview here.

4. Further recommendations

4.1. Start of measurement

  • Make sure that the subject keeps still and does not move his/her hand.
  • Do not change body posture during until a continuous signal is displayed!

4.2. Improving signal quality if signal is poor

  • Warm up fingers to improve blood flow (cover hand, hold hand in warm water prior to measurement, use disposable exam glove)
  • Check position of CNAP finger sensor: the sensor must not be placed on the finger joints.
  • Check if CNAP finger sensor size is correct.
  • Try to measure on the other hand.

4.3 Manual calibration with NBP

  • Trigger a manual NBP after moving or repositioning the subject/the subject’s hand or whenever hydrostatic change/offset happens.
  • Trigger a manual NBP whenever you feel that an update to the NBP reading may be beneficial
  • Triggering a manual NBP is possible at any time and in any mode. 
  • Additional information—view the CNAP NIBP100D operator’s manual here.

4.4 Removal of CNAP finger sensor

  • Do not remove the CNAP finger sensor when a measurement is still in progress. Stop measurement first, then remove the sensor!

 4.5. Battery

  • Never completely discharge the battery.
  • Immediately connect to power supply if battery charge status is below 25%.

To read a recent study which evaluated the agreement of the continuous noninvasive cardiac output measurements by CNAP in comparison with cardiac output measurements obtained invasively using transpulmonary thermodilution (TDCO), go here.

The NIBP100D provides validated, proven accuracy for blood pressure and, with the NIBP100-HD model, full hemodynamics. To ensure the acquisition of good data and accurate readings, researchers should follow the setup procedures outlined above.
For more information on BIOPAC’s Noninvasive Blood Pressure monitoring and measurement systems and advanced functionality in the area of cardiovascular hemodynamics, to include CNAP noninvasive blood pressure systems, visit BIOPAC’s NIBP page or view BIOPAC’s NIBP amplifiers (small animal applications are also supported) and related equipment for a wide variety of research applications.

BIOPAC Systems, Inc. provides life science researchers and educators with data acquisition and analysis systems that inspire people and enable greater discovery about life. Visit us at www.biopac.com.
Electrodes for Physiological Recording

By Alan Macy, BIOPAC Systems, Inc.

In the context of human physiological recording, an electrode is a conductive probe which is used to sense the presence of biopotentials arising at points in the body. When biopotentials are generated in the body, they can be sensed using a differential voltage amplifier. When a biopotential source activates, electrons are moved within the volume of the source thus creating a voltage potential difference (positive to negative) across the volume of the source. Biopotential sources are continually changing in the body, so the associated differential voltage potentials change too.

Electrodes establish an equipotential area when attached to a location on or in the body. An equipotential area means that anywhere on the surface area of the electrode the potential (voltage) will be the same. This is because electrodes are substantially more conductive than the surrounding tissue. To record a biopotential signal, two electrodes are required. The pair of electrodes will measure the voltage which is impressed between the two equipotential areas created by the electrodes.

Biopotential recording electrodes are of two types, namely invasive and noninvasive. Invasive electrodes are designed to sense biopotentials inside the body, meaning they are inserted inside the body, past the skin boundary. Historically, invasive electrodes have been designed as needles or wires to better penetrate the skin. By controlling the conductive and insulating areas of the needle or wire, the electrode can be used to sense biopotentials originating at any depth in the body volume. If the invasive electrode is to be inserted into the body for a long time, then the electrode might take a different shape, such as a conductive disk which can be sutured into place.

Noninvasive electrodes are designed to sense biopotentials which manifest on the outside skin surface. These kinds of electrodes do not penetrate the skin surface layer. Because the body is a volume conductor, biopotentials originating anywhere in the body travel to the entire skin surface area. As an example, a polarized biopotential wave is generated by the heart during the course of each beat. This signal is easily detectable between any two locations on the body’s skin surface that are physically oriented to different sides of the heart.

In practice, it’s best to collect biopotential data as near to the biopotential generating site as possible for the best recording. This is because the body generates a large number of biopotential signals, sourced from a variety of excitable cells. Because the body is conductive, a myriad of these signals will superimpose at any body recording location. As the distance grows between a particular source and the differential recording location, the source signal attenuates. Sources, that are subject to a range of attenuation, will simply add to the desired signal being measured, as they are included in the volume conduction path defined by the differential biopotential recording.

When collecting biopotential data from surface electrodes, the contact area of the electrode has an impact on the frequency and amplitude components recorded in the biopotential. Because the body volume is relatively conductive, increased electrode surface area has a tendency to reduce biopotential amplitudes and suppress higher frequency components. This happens because multiple, and often uncorrelated, biopotential sources in the body can act in random opposition as the various biopotentials superimpose in the conductive body volume and then express on the skin surface. A biopotential averaging process takes place in the body tissue volume and an aspect of the averaged signal is reflected on the skin surface area. This biopotential signal averaging quality increases in scope as the size the measurement surface electrodes increases.

If a biopotential electrode is reduced in size and then inserted into the body near the location of interest, then measured signals will typically increase in amplitude and frequency components. These kinds of electrodes are called needle or wire electrodes and typically have an insulating needle shaft with a conductive tip. Despite certain benefits of needle electrodes, complications can arise when breaking the skin barrier and inserting foreign objects into a subject’s body. Needle electrodes can be difficult to use because they have smaller surface area than surface electrodes. Furthermore, smaller contact surface area always means that the electrode contact impedance is higher. Very high contact impedance, typically in excess of 1 Mohm, specifies the need for excellent lead shielding and specialized input amplifier characteristics.

Biopotential measurements from surface electrodes on the body have material harmonic content of less than 500 Hz. Nearly all of the signal power which can be collected from surface electrodes is between DC and 500 Hz. If the electrode is smaller, such as a conductive-tipped needle, and inserted through the skin surface to near the biopotential of interest, biopotential signal frequencies can exceed 10,000 Hz.

For more information on BIOPAC’s wide range of tools for recording, displaying, and analyzing biopotential measurements from human and animal subjects, visit BIOPAC’s electrocardiograpy, electromyography,  or electroencephalograpy pages and view BIOPAC’s full line of electrodes, amplifiers, and wearable, wireless transmitters and loggers.

BIOPAC Systems, Inc. provides life science researchers and educators with data acquisition and analysis systems that inspire people and enable greater discovery about life.  Visit us at www.biopac.com.

CNAP HD: Noninvasive Hemodynamic Monitoring in Research

Cardiac Output (CNCO® ) and further essential hemodynamic parameters calculated from the continuous non-invasive arterial pressure curve (CNAP®) by means of the Pulse Contour Analysis shows high accuracy and high trending ability (precision) compared to invasive clinical standards (e.g. thermodilution and PiCCO) with valuable benefit for scientific and clinical research.

By Dr. Jürgen Fortin, CEO, CNSystems

Pulse Contour Analysis (PCA) for deriving complete Hemodynamics from continuous blood pressure wave (CNAP)

Pulse Contour Analysis (PCA)[1] derives important physiological information on preload, contractility, afterload and compliance of the heart from the well validated CNAP® Continuous Noninvasive Arterial Pressure Curve[2],[3]. By adding biometric patient data Stroke Volume (SV) and therefrom Continuous Noninvasive Cardiac Output (CNCO®), both essential hemodynamic markers, are calculated. Further hemodynamic parameters such as Systemic Vascular Resistance (SVR) as well as all indexed values SI, CI or SVRI are derived completing the hemodynamic picture.

Validation: CNCO® is clinically validated against invasive methods

Non-invasive continuous CNCO® is the non-invasive continuous cardiac output calculated from CNAP® Arterial Pressure as described above.

Accuracy of CNCO® compared to clinical standards such as invasive thermodilution (TD) or PiCCO is expressed as percentage error. In 1999, Critchley and Critchley suggested a percentage error of 30% or less[4]. In clinical practice, however, percentage errors of 40-45% are more realistic for the interchangeability between two CO-measurement methods (meta-analysis by Peyton and Chong[5]).

Trending ability is the precise tracking of changes in CO. According to Critchley, Lee and Ho, reliable trending ability[6] is indicated by concordance rates of > 90%. Vincent and colleagues state that following hemodynamic trends may be more important than absolute values[7].

CNCO® shows both high accuracy as well as high trending ability (precision) compared to the invasive clinical standards thermodilution and PiCCO fulfilling all Critchley criteria:

Bland-Altman plots show

  • Small bias and narrow limits of agreement
  • Percentage errors ≤ 30% (according to strict Critchley standard [8],[9])
  • Concordance rates ≥ 90% (according to standard [10])

Read more on CNAP accuracy here and here.

Benefit of continuous BP, CO & SVR in research (examples)

Blood pressure, cardiac output and vascular resistance are used to differentiate between challenge and threat states (positive and negative stress)[11],[12] and to quantify emotional response[13] in psychophysiological studies. A challenging situation causes a far bigger rise in cardiac output than a threating state. Total peripheral resistance rises in threat state but shows strong decrease in the challenging situation.

CNCO® is available with the CNAP® HD feature, currently only available in Europe.

For more information on CNAP, to include references to studies and research and plots, click here.

[1] https://en.wikipedia.org/wiki/Cardiac_output#Pulse_Pressure_methods
[2] Jeleazcov C et. al. Precision and accuracy of a new device (CNAP®) for continuous noninvasive arterial blood pressure monitoring: assessment during general anaesthesia. BJA. 2010; 105(3):264-272
[3] Biais, M. et. al. Continuous non-invasive arterial pressure measurement: Evaluation of CNAPTM device during vascular surgery Ann Fr Anesthesia
[4] Critchley, L. A., & Critchley, J. A. (1999). A meta-analysis of studies using bias and precision statistics to compare cardiac output measurement techniques. Journal of clinical monitoring and computing, 15(2), 85–91
[5] Peyton PJ, Chong SW: Minimally invasive measurement of cardiac output during surgery and critical care. Anesthesiology 2010; 113:1220-35

[6] Critchley LA, Lee A, Ho AMH: A critical review of the ability of continuous cardiac output monitors to measure trends in cardiac output. Anesth Analg 2010; 111:1180-92.

[7] Vincent JL et al.: Clinical review: Update on hemodynamic monitoring – a consensus of 16. Critical Care 2011, 15:229.

[8] Critchley, L. A., & Critchley, J. A. (1999). A meta-analysis of studies using bias and precision statistics to compare cardiac output measurement techniques. Journal of clinical monitoring and computing, 15(2), 85–91

[9] Peyton PJ, Chong SW: Minimally invasive measurement of cardiac output during surgery and critical care. Anesthesiology 2010; 113:1220-35.

[10] Critchley LA, Lee A, Ho AMH: A critical review of the ability of continuous cardiac output monitors to measure trends in cardiac output. Anesth Analg 2010; 111:1180-92.

[11] Kirby, L. D., & Wright, R. A. (2003). Cardiovascular correlates of challenge and threat appraisals: A critical examination of the Biopsychosocial Analysis. Personality and Social Psychology Bulletin, 7, 216-233.

[12] Tomaka, J., Blascovich, J., Kelsey, R. M., & Leitten, C. L. (1993). Subjective, physiological, and behavioral effects of threat and challenge appraisal. Journal of Personality and Social Psychology, 65, 248-260.

[13] Lackner, H. K., Weiss, E. M., Schulter, G., Hinghofer-Szalkay, H., Samson, A. C., & Papousek, I. (2013). I got it! Transient Cardiovascular Response to the Perception of Humor. Biological Psychology, 93, 33–40.

For more information on BIOPAC’s Noninvasive Blood Pressure monitoring and measurement systems and advanced functionality in the area of cardiovascular hemodynamics, to include CNAP noninvasive blood pressure systems, visit BIOPAC’s NIBP page or view BIOPAC’s NIBP amplifiers (MRI and small animal applications are also supported) and related equipment for a wide variety of research applications.

BIOPAC Systems, Inc. provides life science researchers and educators with data acquisition and analysis systems that inspire people and enable greater discovery about life.  Visit us at www.biopac.com.

CNAP Noninvasive Blood Pressure Technology – An Overview

The interaction of an easy-to-use finger sensor with unique control loops and algorithms as well as with NBP provides high accuracy of the BP signal – equivalent to invasive arterial line.

By Dr. Jürgen Fortin, CEO, CNSystems

Continuous noninvasive arterial blood pressure measurement (CNAP®) is the technique for measuring blood pressure (BP) that is, as the title describes, both continuous and noninvasive. CNAP combines the advantages of the following two clinical “gold standards:” it measures blood pressure (BP) continuously in real time like the invasive arterial catheter system (IBP) and it is noninvasive, like the standard upper arm sphygmomanometer (NBP).

The CNAP principle is the intelligent interaction and synergy of IP-protected features and functions based on the well-known Vascular Unloading Principle by Penaz (with significant improvement over the past 15 years) [1], on unique control algorithms (e.g. VERIFI) [2] and on calibration mechanisms, making it a reliable and accurate method with results comparable to the intra-arterial measurement.

Pulsating blood flow detected by infrared light sensors is kept constant by the counter pressure exerted on the artery through inflating or deflating the integrated cuff. The resulting pressure in the finger sensor corresponds to the real arterial pressure [1]. The pressure system is controlled by multiple digital feedback loops. The “VERIFI-algorithm” is used for high fidelity signal processing and artifact rejection. This is a superior method for filtering vasomotoric influences, in contrast to Standard methods based on Vascular Unloading Principle, which can show false BP shifts due to influence of vasomotoric tone.

In terms of calibration, CNAP is the only available technology calibrating to directly measured upper arm values, providing blood pressure variations in absolute values at heart-level. The interaction of finger sensor with NBP provides high accuracy of the BP signal – equivalent to invasive arterial line.

Use of CNAP provides researchers with several benefits, including: 

  •  NBP Cuff – Automated scaling to brachial pressure (gold standard) at start of measurement and user programmable
  • Double finger sensor – Quick and error-free application
  • Continuous waveform – Continuous tracing of hemodynamic changes without interruptions to recalibrate; beat-to-beat systolic, diastolic, mean BP values
  • Connectivity – Plug-and-play integration into all common data acquisition systems and patient monitors
  • Data storage and analysis – Unlimited data storage via USB interface. Data format (*.csv) for import into all common data analysis software packages (e.g. BIOPAC’s AcqKnowledge®, Matlab, MS Excel, SPSS, etc.)
  • Accuracy – Reliably equivalent to invasive blood pressure (IBP) [3], [4]

Notes:

[1]  Jan Penaz, Brno, Czech Republic 1973.

[2]  Fortin J et al.: Continuous non-invasive blood pressure monitoring using concentrically interlocking control loops. Comput in BiolMed 36 (2006) 941 – 957.

[3]  Jeleazcov C et. al. Precision and accuracy of a new device (CNAP) for continuous noninvasive arterial blood pressure monitoring: assessment during general anaesthesia. BJA. 2010; 105(3):264-272.

[4]Biais, M. et. al. Continuous non-invasive arterial pressure measurement: Evaluation of CNAP device during vascular surgery Ann Fr Anesthesia.

Studies documenting the CNAP device’s performance can be found below:

Arterial stiffness is higher in older adults with increased perceived fatigue and fatigability during walking

Does conscious intention to perform a motor act depend on slow cardiovascular rhythms?

The Effect of Mainstream Media on Body Image and Stress Reactivity in Latina Females

For more information on BIOPAC’s Noninvasive Blood Pressure monitoring and measurement and cardiology research solutions, to include CNAP noninvasive blood pressure systems, visit BIOPAC’s NIBP page or view BIOPAC’s NIBP amplifiers (MRI and small animal applications are also supported) and related equipment for a wide variety of research applications.

BIOPAC Systems, Inc. provides life science researchers and educators with data acquisition and analysis systems that inspire people and enable greater discovery about life.  Visit us at www.biopac.com.

Practical Tips for Recording Physiological Data in MRI

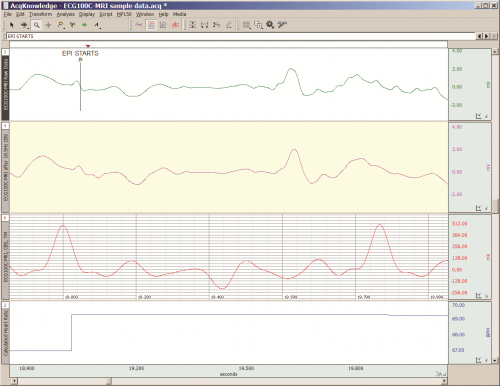
The MRI system incorporates a VERY strong magnetic field and both emits and records radio frequency (RF) energy. This has impacts on subject and experimenter safety and on data accuracy.

By Alan Macy, BIOPAC Systems, Inc.

When recording physiological signals from subjects in MRI systems, two issues are very important:

  1. The MRI system incorporates a VERY strong magnetic field. It is extremely important that no significant magnetically susceptible objects are taken into the room that houses the MRI System.  All materials have some degree of magnetic susceptibility. However, materials with mass magnetic susceptibility values, similar to or have magnitude less than that of water (-0.91E-8 m^3/kg), are typically permitted to be used in the vicinity of MRI Systems. No electrodes, electrode leads, transducers or cabling, that contain significant magnetically susceptible components, should be used when recording data from a subject in the MRI.
  2. The MRI System both emits and records radio frequency (RF) energy. This energy is typically in the range of 5 to 500 MHz. For a 3T MRI, the characteristic proton precession frequency will be 3T * 42.7 MHz or 128.1 MHz.  MRI generated RF energy will, at least, partially reflect from encountered conductors and induce current flow in those conductors. Signal reflections and induced currents can disrupt sensitive imaging operations by creating signal artifacts. Also, RF induced currents, if not properly controlled, can cause local heating.

Care must be taken to limit the flow of RF energy both in and out of the room that houses the MRI. RF energy from the MRI superimposes with the very small biopotentials and transducer signals in the vicinity of the subject. Alternatively, RF energy from recording or other equipment in the MRI Control Room (e.g. digital clocks and power supply switching noise) can leak into the MRI chamber, via subject cabling, and cause degradation of the image created by the MRI. It can be complicated to record biopotentials, from a subject’s body, during an MRI scan. These signals are very tiny and the RF energy, and associated magnetic field shifting, generated by the MRI corrupts the recording. Accordingly, successful biopotential recording in the MRI involves the use of specialized amplifiers, optimized cabling, patch-panel filtering, advanced signal processing and/or synchronization with MRI scanning processes to perform clean measurements.

When RF energy is pulsed into the subject, this energy spreads throughout the subject because the subject is a volume conductor. As the MRI magnetic gradient shifts in synchrony with RF energy pulsing, the gradient shift induces a current flow in conductors that intersect with the field. From a practical standpoint, RF energy pulsing and gradient-induced current flows often manifest themselves as repetitive artifact signals directly in the band of the physiological generated biopotentials. This is because RF energy pulsing and magnetic field gradient switching are performed synchronously for imaging and the repetition rates for image slice generation usually fall within the range of 1-100 Hz. Depending upon the biopotential frequency range (from lowest to highest: EGG, EOG, ECG, EEG and EMG), different amplification and signal processing techniques can be used to isolate the signal of interest. Furthermore, it’s often helpful to control imaging processes so that the MRI artifact signal spectrum does not unduly impact the measured physiological signal spectrum.

For more information on BIOPAC’s MR Safe and MR Conditional solutions, visit BIOPAC’s MRI page or view BIOPAC’s full line of electrodes, amplifiers, and wearable, wireless transmitters and loggers.

Download a related and important application note that describes the relationship between MRI imaging sequences and associated physiological measurements, when subjects are monitored in the MRI. In particular, this note addresses newfound insights on the impact that imaging sequence types have upon simultaneously recorded electrocardiography (ECG) and impedance cardiography (ICG) subject measurements.

BIOPAC Systems, Inc. provides life science researchers and educators with data acquisition and analysis systems that inspire people and enable greater discovery about life.  Visit us at www.biopac.com.
Impedance Cardiography

By Alan Macy, BIOPAC Systems, Inc.

ICG is a measurement method that is primarily used to determine aspects of Cardiac Output (CO).   CO is the total amount of blood, pumped from both the left and right ventricles of the heart for each of its successive systolic phases, over the course of one minute.  The systolic phase, or systole, is when the heart muscle contracts and pumps blood from the chambers (left and right ventricles) into the arteries.  Typical resting cardiac output is 4.9 liters/minute for an adult human female and 5.6 liters/min for an adult human male.

Left ventricular cardiac output is the CO from the left ventricle only and can be estimated via a non-invasive technique called Impedance Cardiography (ICG), which provides an approximation of Stroke Volume (SV).  If SV and Heart Rate (HR) are known, then CO can be determined by:


SV * HR = Cardiac Output


ICG is measured by introducing a constant current (I) through the thoracic volume and then measuring the resulting voltage (V).   The following equation is used to determine thoracic impedance (Z).

 Z = V/I

 Where V and I are the root mean square (rms) values of the measured voltage and supplied (known) current.  ICG systems induce a constant magnitude, alternating current (I) through the thorax via electrodes.  A separate set of electrodes (placed between the current electrodes) monitor the voltage (V) developed across the thorax.  Because the magnitude of I is constant, V will vary in direct proportion to Z.


The applied current (I) flows through the volume of the thorax, which includes skin, skeletal muscle, the lungs, the heart and blood.  Because blood is a conductor, the changes in blood volume during a cardiac cycle produce a measurable change in thoracic impedance.  Researchers have developed equations for estimating left ventricular SV based on thoracic impedance, with the most widely used equation being that developed by Kubicek, et al. (1966):

 SV = rho x (L/Zo)² x LVET x (dZ/dt Max)

 Where:

 SV = Stroke volume (ml)

rho = Resistivity of blood (Ohms·cm) which is assumed to be a constant 135 Ohms·cm (Quail, Traugott, Porges, & White, 1981).

L = Length or distance between inner band (voltage monitoring) electrodes (cm)

Zo = Basal Thoracic Impedance (Ohms)

LVET = Left Ventricular Ejection Time (seconds)

dZ/dt Max = Absolute value of the cyclic peak of the derivative of Zo (Ohms/sec)

LVET varies inversely with heart rate under a broad range of circumstances.  LVET should not be treated as a constant in the Kubicek equation.  Unlike Length (L), which is constant during a session, Thoracic Impedance (Zo) also varies some, although not as much as LVET.   Blood resistivity (rho) also may vary with changes in hematocrit levels and red blood cell orientation, but that variation has largely been ignored because of the difficulties associated with having to draw blood to measure rho.

Impedance Cardiography (ICG) is an indirect measurement of Stroke Volume (SV).  Studies have been performed to correlate ICG to SV, using thermodilution as reference and have found that accuracy improves when variables such as age, height, sex, waist circumference and weight are factored into the SV estimation.  Accordingly, ICG measures are best interpreted as a relative, versus absolute, indication of SV.  Even so, as a relative measure, ICG can provide a clear indication of important physiological processes associated with homeostasis and hemodynamic changes.

Research in psychophysiology, and other areas of physiology, focuses on the left ventricle because it pumps blood that supplies the metabolic requirements of striated (skeletal and cardiac) musculature and thus fundamentally supports behavior and exercise.  For Impedance Cardiography (ICG), the left ventricle is principally important because the dZ/dt signal primarily indicates left ventricular blood ejection into the aorta.  There is very little influence from right ventricular blood ejection in the ICG signal.

For more information on BIOPAC’s ECG solutions, visit BIOPAC’s ECG-Cardiology page or view BIOPAC’s full line of electrodes, amplifiers, and wearable, wireless transmitters and loggers.

For more information on BIOPAC Systems, visit us at www.biopac.com.

error: Content is protected !!