
Human Factors: Physiological Signals Enhance Ergonomics Research

Ergonomics plays a role in almost every aspect of human interaction with the world around us—how we work, entertain ourselves, rest, and relax. Simply put, ergonomics (sometimes termed “human factors and ergonomics” or simply “human factors”) refers to the way in which physiological and psychological principles are applied to design, particularly in ways that benefit a user’s physical and psychological well-being and productivity.

In practice, ergonomics addresses more than our physical interactions but also encompasses our mental, emotional, and interpersonal states. What unites these different applications of ergonomic theory is that they can be studied and better understood with many of the same tools and signals applied in other areas of physiological and psychophysiological research. These can include ECG, EOG, fNIRS, EEG, and EMG, to name just a few.

Ergonomics can be broken down into three primary domains. Physical ergonomics relates to how the body interacts with the physical environment, from the design of tools we use every day to the physical environments in which we live and work. Cognitive ergonomics focuses on how our mental abilities are influenced by the systems and tasks with which we are presented. Organizational ergonomics (also known as macroergonomics) explores how to optimize organizational structures, policies, and processes within various social settings, including work environments.

Eye TrackingOne example of how physiological signals are being applied in physical ergonomics research involves the application of electrooculogram (EOG) signals to analyze eye movements, particularly saccades, as a measurement of eye fatigue caused by exposure to digital screens. The ubiquity of such screens in both our work and recreational environments makes such research critical to maintaining user well-being and productivity. This 2018 study utilized EOG electrodes connected via SS2LB leads to an MP36 data acquisition unit running BSL software to record and analyze EOG signals. Researchers were able to determine the optimal reading and viewing distance to minimize eye fatigue and discomfort, improving user health and productivity.

Cognitive ergonomics come into play when discussing the ease-of-use for a product. This is particularly important when dealing with how less technologically savvy groups interact with new technology, a challenge is explored in a 2019 study into how to develop a home heart monitor that would be easy for older users to operate. The study compared user interaction with device hardware, a mobile app, and a cloud-based software platform while using a BIOPAC research-level system as a control. Researchers created the signal baseline with an ECG amplifier connected to a data acquisition and analysis unit, comparing these results to the quality of the signal the user was able to obtain using the self-administered home devices and applications. This approach accurately assesses both the user-friendliness and quality of data obtained by several telemedicine systems.

These examples offer just a small sample of the ways in which physiological signals are being applied in the study of ergonomics. For an in-depth exploration of the topic, watch our webinar series on Ergonomics and Fatigue.


To learn more about using BIOPAC hardware and software to enhance your ergonomics study or design research, contact your local sales representative.

Silent Partner: Autonomic Function Testing in Research

Like the inner workings of an intricate machine, most of our bodily functions operate with little or no conscious effort. That task falls to the autonomic nervous system, a sort of control system that regulates a wide range of processes, including digestion, heart rate, respiration, urination, and sexual arousal, to name a few. The autonomic nervous system also controls physiological responses to stimuli—the fight-or-flight response, and critical reflex actions like vomiting, swallowing, coughing, and sneezing.

The ability to effectively and accurately test autonomic function allows clinicians to diagnose and treat a range of ailments. Such tests can non-invasively evaluate the severity and distribution of autonomic failure, for example. Beyond these clinical applications, autonomic function testing provides valuable insight into how the body regulates and manages various critical functions and how the autonomic nervous system affects our physical and psychological health.

adolescent depressionAutonomic function testing has been employed to examine the impact childhood trauma has on cognitive function as it relates to adolescent depression. A 2020 study published in Development and Psychopathology looked at whether economic deprivation and threat influenced cognitive processes and autonomic nervous system function connected to the severity of depression. Researchers measured study participants’ electrodermal activity (EDA), respiratory sinus arrhythmia (RSA), and electrocardiogram (ECG) data via an MP150 system. EDA was gathered using a BioNomadix wireless BN-PPGED amplifier set, while ECG and respiration (RSP) recordings were obtained with a BioNomadix wireless BN-RSPEC amplifier set. The study’s findings supported the assumption that a history of trauma and economic deprivation can lead to risk factors for youth depression.

Continuing with the theme of applying autonomic function testing to measure the effects of trauma, a 2021 study publish in Neurobiology of Stress examines autonomic function related to sex differences among individuals with posttraumatic stress disorder (PTSD). Skin conductance, blood pressure (BP), heart rate (HR), and high-frequency heart rate variability (HF-HRV) were recorded with an MP150 data acquisition system among male and female emergency personnel following trauma exposure. The results, which showed notable sex differences in autonomic functioning among trauma-exposed individuals, have implications for predicting cardiovascular risk in those with PTSD.

These are just a few examples of how autonomic function testing is being used outside of the clinical setting to shed new light on several research areas. Check out Part 1 and Part 2 of our webinars demonstrating how to use BIOPAC equipment and software in autonomic function research.


For additional information on how BIOPAC can assist you with a wide range of research and educational applications, contact your local sales representative.

Measuring Moods: Signals for Insight into Emotion

“Do you ever look at someone and wonder what is going on inside their head?”

Joy, an anthropomorphized manifestation of happiness, delivers this line at the opening of Pixar’s 2015 animated hit “Inside Out,” a film that explores the emotional struggles of its young protagonist. She could have been speaking for generations of researchers who have plumbed the depths of the human psyche for a better understanding of the mechanisms behind our feelings, moods, and emotions.

When today’s researchers talk about emotion, they typically do so in terms of affect, the underlying physiological and psychological experience of feelings and emotions as a reaction to stimuli. Affect and emotion are not the same thing, per se, but are fundamentally connected. While the feelings we describe as fear, joy, love, hate, etc. remain abstract, affect is more concrete. BIOPAC co-founder and head of R&D describes it as “the measurable quality or manifestation of emotion in the human body.”

This manifestation can be measured in the human nervous system’s response to stimuli. Depending on the nature of the stimuli and how this sensory data is interpreted by the central nervous system, an array of physiological responses can take place: heart rate changes, the stomach and muscle groups tense, skin temperature responds, triggering sweat glands, among others.

The signals corresponding to these reactions provide researchers with valuable data to help them better understand affect and emotion. These signals—electroencephalogram (EEG), electrodermal activity (EDA), electromyogram (EMG), heart rate, and respiratory rate, to name a few—can be recorded and measured using a range of currently available sensing technologies.

As an example, a 2019 study published through the Queensland University of Technology used respiration signals as a means of classification for human emotions such as happiness, sadness, surprise, disgust, fear, and anger. In the study, breathing signals, including airflow rate and volume, were acquired and recorded using a BIOPAC MP36 data acquisition unit while participants were shown seven film clips, each associated with a different emotion. The study concluded that the respiratory data was 80% effective in accurately classifying affective responses to the film stimuli.

A team of researchers at the Khwaja Fareed University of Engineering and Information Technology in Pakistan took their investigation into the connection between physiological signals and emotion a step further. They used a similar approach by measuring participant response to movie clips, however this time, four types of physiological signals were acquired, including ECG, EMG, respiration, and skin conductivity (SC). The data was acquired with a wide range of signal sensors and analyzed via a BIOPAC MP160 DAQ System.Signals for Emotion

Signal sensing technology also allows researchers to study emotion in multiple participants simultaneously, as was the case in a 2020 dyadic study of how a parent’s stress and emotional suppression affects their children. The study measured physiological responses of both parents and children using ECG and impedance cardiography (ICG) via a BIOPAC MP150 data acquisition unit.

The mysteries of human emotion are being unlocked through a growing understanding of the affective response to stimuli. For more information on how physiological signals can be gathered and analyzed for this purpose, see our app note on emotional state physiology as well as our webinar Emotion and Objective Physiological Measures.


Contact BIOPAC for the latest information on how we can help you measure affect in the lab.

Baby Blues: Neonatal, Infant, and Toddler Research Challenges

The first five years of a child’s life are marked by considerable change—both physiological and psychological. Young children undergo incremental development in their ability to think and solve problems, their emotions, and their linguistic abilities, to name just a few developmental changes. Over time, the rapidity and extent of this development vary by individual, even among children of the same age. For these reasons, research techniques and tools must be adopted that are suitable for the participant’s age group. In this constantly evolving segment of the physiological and psychophysiological field, new approaches and technologies are being implemented with the needs of our youngest participants in mind.

Different Needs, New Approaches

A recent article published by researchers at the University of California Irvine outlined some of the challenges in conducting research within the neonatal to toddler age groups. Chief among these was the higher levels of attrition among these groups compared to older test subjects. Much of this can be linked to the general characteristics of the test group—reduced ability to sit still for long periods of time, shorter attention span, and lack of motivation to participate. While these factors may not surprise an experienced parent or childcare provider, they can throw a wrench into any study that has not taken such challenges into account.

Tools for Toddlers

Choosing the right tools and applying them appropriately in the lab setting can not only significantly improve attrition rates, but also the quality of data. Receiving a clear, uninterrupted signal when gathering data from a research participant is challenging under the best of conditions and can seem insurmountable when it involves a potentially fussy, fidgety young child or infant. Thankfully, research tools and technologies have been developed with our youngest participants in mind. These include electrodes for infants that are not only sized appropriately but also designed not to irritate sensitive skin, as well as infant-sized EEG caps that are comfortable enough to be worn for extended periods and secure to prevent excess movement and signal loss.

Combining Technique with Technology

Dyadic ResearchSome researchers have found the best approach to tackling the challenges presented by these youngest participants is a combination of age-appropriate strategies and specialized equipment. A 2020 dyadic study published in the Journal of Cognitive Neuroscience examined the Effects of Maternal Singing Style on Mother-Infant Arousal and Behavior by using skin conductance (SC) levels as a measure of arousal in both the mother and infant participants. Both participants were fitted with pre-gelled electrodes attached to BioNomadix wireless EDA transmitters, which are less cumbersome than a fully wired solution. While the mother’s electrodes were attached at the neck, the infants were attached to the foot and secured in place with paper medical tape and covered with a sock. This ensured the electrodes would be held securely in place and reduce movement that could negatively impact signal quality.

We have only scratched the surface of the tools and strategies available for conducting lab research on very young participants. For additional information, watch our webinar on Research and Best Practices for Recording from Newborns, Infants, and Toddlers.


For additional information on research tools for young participants, contact your local BIOPAC sales representative.

Choosing the Right Signal: Easy as 1, 2, 3

In physiology and life sciences, researchers rely on a wide range of signals to gather data from humans and animals. These signals provide critical insight into how complex organisms function under a myriad of conditions. However, this wealth of potential data sources can also present a challenge for researchers: choosing the right signals on which to focus their data gathering. For those lacking a background in the disciplines and mechanisms behind these signals, sifting through the available methodology can be overwhelming. The best place to begin is by considering one or a combination of the “Big Three” physiological signals: ECG, EDA, and respiration.

In physiology and life sciences, researchers rely on a wide range of signals to gather data from humans and animals. These signals provide critical insight into how complex organisms function under a myriad of conditions. However, this wealth of potential data sources can also present a challenge for researchers: choosing the right signals on which to focus their data gathering. For those lacking a background in the disciplines and mechanisms behind these signals, sifting through the available methodology can be overwhelming. The best place to begin is by considering one or a combination of the “Big Three” physiological signals: ECG, EDA, and respiration.

One from the Heart

Changes in heart rate can provide information on both the physiological and psychological state of a research participant. Electrocardiography (ECG or EKG) is a biopotential measurement that provides direct metrics on electrical voltage changes in the heart. With the help of simple hardware and software, it is possible to record these voltage variations as waveforms to track how the heart responds to stimuli. Additional data can be provided by creating reoccurring reference points in the waveform, measuring the intervals between beats, and calculating heart rate variability to track changes over time or in response to stimuli.

Skin Deep

Electrodermal Activity (EDA) provides one of the best measurements of how the body responds to psychological stress and anxiety. It can be simply understood as a measure of changes in the electrical conductance of the skin in relation to the production of sweat. The physiological process of EDA comprises two components, skin conductance level (SCL) and skin conductance response (SCR). SCL is a tonic level that slowly changes over time, measuring the period for response to a stimulus to occur, from its onset to its peak. SCR reflects the phasic response to an arousing stimulus that is shown in faster changes of the skin conductance level. As an example of the application of EDA and ECG measurements in psycho-physiological research, a recent study applied both signals in measuring the cognitive states of gamers during human-computer interaction (HCI).

Breathe Easy

ArachnophobiaAs with changes in heart rate, variations in breathing cycle reveal how subjects respond to a wide range of stimuli and conditions. The signal produced by the respiratory cycle is a transduced physiological signal. As such we can apply mechanisms to create a voltage potential to measure phases of inhalation and exhalation in this cycle. This data can be represented in waveforms, providing data on respiratory rate, amplitude, and respiratory sinus arrhythmia (RSA). The latter combines respiratory data with ECG signal data to show changes in heart rate in response phases in the respiratory cycle. A 2020 machine learning study for the development of virtual reality applications combined respiration, EDA, and ECG signals to measure participant’s fear response to spiders, an example of how all three signals can be simultaneously utilized in psychophysiology research.

Choosing the right signal shouldn’t be the biggest hurdle to designing your next research project. Applying one or more of these “Big Three” can cover a wide range of data gathering goals.


For additional assistance, consult BIOPACS online resources on Life Science and Physiological Signals or contact your local BIOPAC representative.

Curriculum Roadmap: Guiding Students with HAPS Learning Goals

When planning any journey, choosing the right route can mean the difference between reaching one’s destination or becoming lost in the wilderness. It helps to know the purpose of the trip; is it merely to get from point A to point B, or is the journey itself as important as reaching the destination? What stops need to be made along the way?

These questions can also resonate for instructors as they guide students along their academic journeys, as the goal of instruction is not limited to just reaching a specific destination. It is often about what occurs along the way: experiences, obstacles, and challenges encountered that shape the student and their understanding of the subject matter.

To help students and instructors on the path to better life science education, BIOPAC created a roadmap with its curriculum for the Biopac Student Lab systems (BSL) for life science instruction. The BSL curriculum comprises more than 65 lessons that serve as carefully plotted points on a path to an in-depth and invigorating understanding of general life science disciplines.

This curriculum follows a route established by the Human Anatomy and Physiology Society (HAPS). HAPS has created a set of learning goals, guidelines, and outcomes that bring together a range of topics covered in Anatomy and Physiology I & II courses at the university level for both clinical and academic degree programs.

The advantages of following such a path are fourfold. First, students are provided with an outline of course expectations. Just as every journey should begin with a clear understanding of where one is going, knowing learning goals allows students to focus their efforts on what matters most. Furthermore, instructors are encouraged to relate learning goals to real-life applications to provide meaning in a relatable context.

Secondly, with straightforward goals in mind, the instructor will find it easier to manage course design by focusing on key elements of their curriculum. These can include the following:

  • Order of topics to cover
  • Pedagogical strategies
  • Lab experiments
  • Periodic assessments that help students stay on track

Taking this a step further, by following HAPS’s goals, guidelines, and outcomes, instructors will be better equipped to plan a comprehensive program of study. Well-defined goals allow the instructor to build a solid foundation for future courses and guide learning specific to the program’s discipline. Additionally, it can reveal redundancies, overlaps, and gaps in the degree track.Goal Planner

Lastly, just as a good cartographer’s map provides evidence of where the traveler has journeyed, carefully plotted goals, guidelines, and outcomes trace the students’ track within the academic program. This provides valuable information for accreditation while ensuring students graduate with the necessary skills for their chosen field in the sciences.


To learn more about how the BSL system and curriculum can help students and instructors get the most out of anatomy and physiology courses, contact BIOPAC today.

‘Tis the Season for Stress: Research Tools for Anxious Times

Holiday-related stress is as much of a seasonal tradition as family gatherings, frantic shopping forays, and over-indulgence in food and drink. Add to this potent mixture nearly two years of pandemic-induced tension and we have a volatile cocktail of emotions and anxiety awaiting us in November and December. What better time to study the causes and effects of stress?

Research has established strong links between stress and our moods and sense of well-being, not to mention overall mental and physical health. While certain types of stress during development can teach individuals to adapt to life’s many challenges, excessive and prolonged stress is shown to contribute to chronic disease and a range of psychological disorders. According to the American Psychological Association, which conducts an annual survey monitoring stress, the COVID pandemic has had an unprecedented impact on stress levels across all demographics, particularly among young people.

The pandemic is just one of many factors driving demand for new approaches to stress research. Thankfully, researchers now have access to a myriad of technologies to support any experiment design. In a recent webinar on techniques for measuring physiological changes related to stress, BIOPAC head of European Sales, Alex Dimov, outlined a range of stress-connected physiological responses that can be measured in the lab with available technologies. These include heart rate, heart rate variability (HRV), trans-radial-ulnar electrical bioimpedance velocimetry (TREV), cardiac output, blood pressure, EDA, pulse, respiration, EMG, EEG, and functional near infrared spectroscopy (fNIRS).

One of the challenges of measuring stress in a natural environment is finding the right data gathering tools to support the mobility of test participants. A 2019 study tackled this by examining a variety of techniques for measuring stress in day-to-day life using mobile phones and wearable sensors. Settings included the lab, automobile, office, school, and other daily life locations. Along with consumer products like smartphones, smartwatches, and fitness bands, researchers also employed wearable sensors, including the BioNomadix wireless PPG transmitter to measure blood volume pulse (BVP) using a photo plethysmogram (PPG) signal. Researchers found that the BIOPAC device provided a high level of accuracy (80%) when employed outside of the traditional lab environment.

Smelling RosesStress research technologies are not limited to data gathering. Stimulus presentation tools offer researchers options for both inducing and alleviating stress in the lab. A 2019 University of Wisconsin study investigating the role scents can play in reducing stress utilized EDA, heart rate, and respiratory rate to measure how rose scent reduced anxiety among students taking a difficult test. Respiratory rate was measured using a BIOPAC respiratory transducer while EDA data was collected with an EDA finger transducer. Data was collected and analyzed via the Biopac Student Lab System. While rose scent was delivered using scented lotion, it should be noted that BIOPAC offers a new modular scent delivery system that is capable of delivering up to eight scents per experiment, with more than 120 scent options.
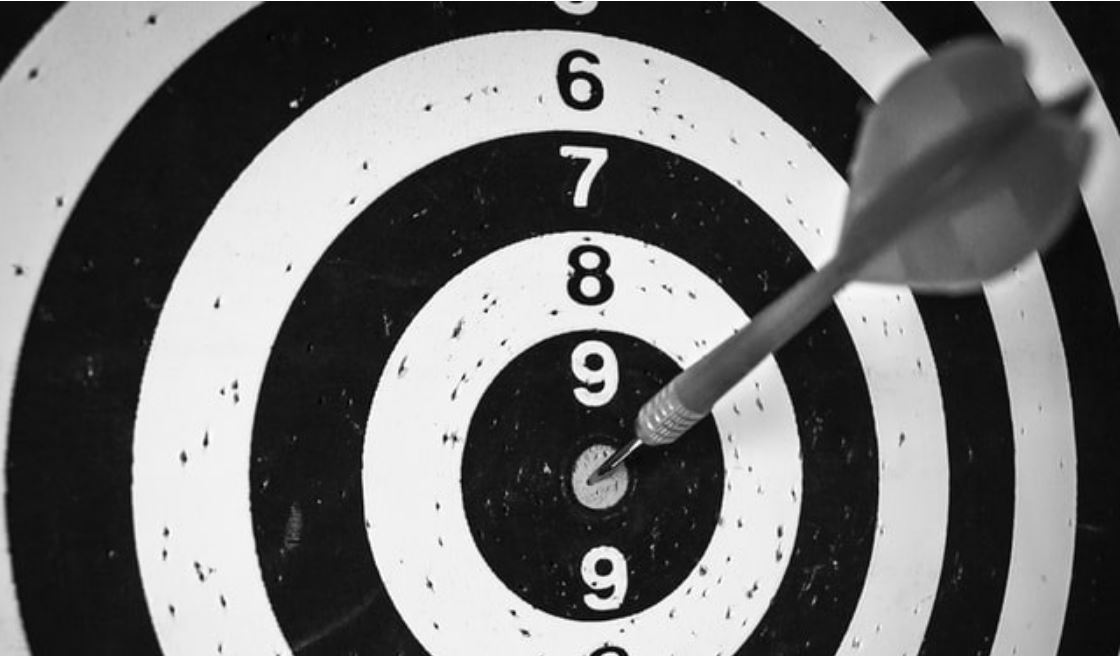
With so many data gathering tools available, planning your next experiment should not leave you feeling on edge. Let your BIOPAC sales rep help you take the stress out of stress research.


BIOPAC offers a wide array of wired and wireless equipment that can be used in your research. To find more information on solutions for recording and analyzing signals such as ECG, heart rate, respiration, and more using any platforms mentioned in this blog post, you can visit the individual application pages on the BIOPAC website.

Hitting the Mark: Using Event Markers to Improve Data Quality

Life is a series of events—some are planned while others catch us completely by surprise. This holds true in the lab where the quality of experiments and data depend on accurately identifying, tracking, and sorting key events as they occur. Events like the introduction of stimuli and a test subject’s reaction directly impact data.

Life is a series of events—some are planned while others catch us completely by surprise. This holds true in the lab where the quality of experiments and data depend on accurately identifying, tracking, and sorting key events as they occur. Events like the introduction of stimuli and a test participant reaction directly impact data. Similarly, unplanned events, such as when a participant coughs or sneezes during a respiratory experiment, can affect overall data quality.

In this context, we define an “event” as piece of information associated with a specific time in a waveform. An event can capture points of interest within a file (e.g., subject moved, dose added) or on a particular channel (e.g., T-wave onset).

Whether intentional or not, critical events need to be easily located and identified by those running an experiment. Event marking provides the key to this by helping researchers eliminate outlier data while making it possible to locate data that is significant to the experiment. Today’s researchers benefit from data acquisition software that offers some form of event marking functionality to easily identify, label, and categorize such events. BIOPAC’s latest build of AcqKnowledge, for example, integrates extremely easy-to-use event marking tools that enable users to mark “quick events” with a simple tap of a function/hotkey for 17 different event categories, each containing multiple types of events.

“I’m struggling to think of any time you wouldn’t be using these,” said BIOPAC Technical Support Manager David Pollock as part of the recent webinar AcqKnowledge Bootcamp: Set Up Experiments to Facilitate Data Analysis. “They are critical to being able to interpret your data after you acquire it.”

The benefits of event markers include:

  • Allowing researchers to differentiate stages of an experiment
  • Making it easy to eliminate outlier data
  • Allowing researchers to track and identify stimuli
  • Providing control over event tracking, thus eliminating errors
A Tale of Two Studies

A pair of recent studies illustrate how data acquisition software like AcqKnowledge can streamline event marking. The first sought to test the viability of various commercial-off-the-shelf ECG sensors for monitoring stress levels in participants. Test participants used a manual button to self-mark stress events triggered by mental arithmetic tasks, startle response tests, and a cold-water response test. A BIOPAC MP Research System data acquisition unit provided a clinical baseline for comparison with the pair of COTS ECG monitors. The limitations of self-reported events were revealed when participants were found to have accidentally activated the stress “clicker” about 60% of the time.

Physiological Data in Military StudyA similar 2018 John Hopkins University study avoided this problem through both automated and researcher-controlled event marking. When examining how military commanders maintain combat effectiveness while responding to a range of potentially stressful battlefield situations, researchers employed AcqKnowledge to record event marks at the onset and offset of various stimuli. Physiological data was fed to an AcqKnowledge-equipped computer via a BIOPAC DAQ connected to an STP100C digital interface module. Event markers generated by both AcqKnowledge and E-Prime allowed researchers to easily identify stimuli as well as each task the participants performed by name, start time, end time, and duration.

Not leveraging the power of event marking tools can result in key experimental events being lost in a flood of data, potentially corrupting results. Check out this video tutorial to learn more about event marking with AcqKnowledge.

Enhance Consistency with an Automated Lab Refresh

The global COVID-19 pandemic made in-person lab work impossible under many circumstances and difficult in the best of conditions. Now, as researchers and students begin to return to the lab, an opportunity presents itself for a fresh start. One way in which labs are refreshing their approach to research and education is by adding software and equipment that allows for the automation of procedures and analysis with the goal of increasing repeatability and reproducibility within experiments and research.

It’s been a challenging 18 months for science educators and those running research facilities. The global COVID-19 pandemic made in-person lab work impossible under many circumstances and difficult in the best of conditions. Now, as researchers and students begin to return to the lab, an opportunity presents itself for a fresh start. One way in which labs are refreshing their approach to research and education is by adding software and equipment that allows for the automation of procedures and analysis with the goal of increasing repeatability and reproducibility within experiments and research.

Crisis of reproducibility

The phrases “reproducibility crisis” and “replication crisis” became buzzwords in the scientific community in the 2010s, with that notoriety spilling over into both the scientific and mainstream media’s coverage of the sciences. Several high-profile scientific and sociological studies were called into question when researchers were unable to reproduce their results. In 2015, a group of psychology researchers under the moniker of the “Open Science Collaboration” found that they were only able to reproduce the findings of 68% of studies published in high-ranking peer-reviewed journals. A 2016 survey of 1,576 researchers by the journal Nature similarly found that 52% agreed that there was a “crisis” of reproducibility, though most said they still trusted published research.

The automated advantage

One step that researchers can take to ensure the reproducibility of their experiments and thereby boost the integrity of their data and conclusions is by automating procedures, workflow, and record keeping. These steps not only reduce the possibility for human error, but also provide a clear roadmap for future researchers to repeat processes in the lab to review and test results. The National Academies of Sciences, Engineering, and Medicine guide Reproducibility and Replicability in Science (National Academies Press, 2019) outlines several of the ways in which automation is being used to enhance reproducibility of research results, including record keeping, data analysis, data version control, and workflow management. The publication notes that “automated scientific workflows are essential in data-intensive and large-scale science missions that aim to be computationally reproducible.”

A 2019 study by researchers at the Indiana University School of Informatics, Computing, and Automated studyEngineering employed these techniques to demonstrate “how automation can be used to address many of these factors contributing to the replication crisis.” The study focused on the controlled rearing of chicks, comparing automated and non-automated research methods. The study found that the automated tracking system allowed researchers to increase the amount of data collected from each test subject, which in turn “reduced measurement error by 60% and increased the effective size of experiments by about 300%.”

An automated refresh

BIOPAC’s AcqKnowledge data acquisition and analysis software allows labs of any size to gain the advantage of automation to improve both the efficiency and effectiveness of research. Features like Batch Processing and  BIOPAC Basic Scripting help eliminate the potential for human error by consolidating multiple tasks into a single automated routine. A heightened level of standardization and consistency results in improved data quality. Adding a Basic Scripting license to AcqKnowledge 5.0.6 ensures results are reproducible regardless of who is carrying out the experiment.

VR—New Worlds to Explore

Use VR to Expand the Capabilities of Your Lab

The immersive technology of virtual reality (VR) literally offers whole new worlds to explore. Combining VR/Immersive Solutions with Physiology Data allows researchers to create virtual worlds that are impossible or prohibitively expensive in the real world. Additionally, researchers can synchronize VR events with physiological response data to record and analyze physiological, behavioral, and subjective response data. Multimodal stimulation can deliver visual (3D), auditory, olfactory, haptic, and/or electric stimulus to add an incredible degree of realism to the immersive world!

Interfacing a VR workstation with a data acquisition system can add a new dimension to your research by combining objective measures with a tightly controlled experimental protocol. Immersive environments can take the subject anywhere and allow you to unlock the boundaries of your physical lab space and budget.

  • Create rich 3D environments that are 100% personalized to match your protocol.
  • Send physiological data back to the VR world to make decisions based on the participant’s physiological responses

Participants can move around naturally within the virtual world while their physiological data is captured. Record any combination of signals: ECG, EDA, EEG, EOG, EMG, EGG, temperature, respiration, and pulse. Include eye tracking to track subjects’ gaze as they view the immersive environment during the experiment. Close synchronization between the stimuli and the physiological signals is achieved through digital markers.

Monitor data in real time and use detailed signal analysis for post-acquisition scoring of the data. Automated analysis routines can streamline the analysis process, eliminate subjectivity, and save time—see AcqKnowledge for some powerful options.

VR software provides you with an unlimited degree of flexibility to create a specific world and control people and items within the world. VR software is easy to use and adaptable, so researchers can make subtle changes to an experiment without having to redesign the entire protocol.

Immerse your subjects in a BIOPAC VR world and record physiological data as the virtual environment influences the subject. Applications are varied and include Psychology, Biomechanics & Kinesiology, Ergonomics, Marketing/Consumer Research, Healthcare, Computer Modeling/Simulation, Education, Training: hazard, medical, etc.,

Use a feedback loop for greater control and automation of the VR world. This allows the world to change in real time, based on the participant’s responses. Timing events are recorded for tight synchronization with physiological data for meaningful analysis.

See VR Resources here for more examples of how VR can expand the capabilities of your lab!

BIOPAC offers a wide array of wired and wireless equipment that can be used in your research. To find more information on solutions for recording and analyzing signals such as ECG, heart rate, respiration, and more using any platforms mentioned in this blog post, you can visit the individual application pages on the BIOPAC website.

Photo by stem.T4L on Unsplash

error: Content is protected !!


