Don’t Let COVID-19 Lock Down Your Labs

By: Jasmine Anderson, Biopac Student Lab Product Manager 

The COVID-19 pandemic turned higher education upside-down when stay-at-home orders forced educational institutions to shift to distance learning this Spring. In hindsight, no one could have predicted what 2020 would entail – and now, while facing the pandemic, the future seems even more impossible to plan. 

When the novel coronavirus put a lockdown on our higher education institutions, instructors were required to make swift decisions on how they would continue. In the news, institutions are slowly releasing their course of action on an individual basis and plans appear to vary across the board. Some schools are announcing that they’ll forge ahead this fall while others are opting to hold off on deciding or have already closed their campus. Regardless of the plan, a common theme shines through – the fact that everyone’s trying to do the best that they can, given these complicated and un–chartered circumstances.  

To help save practical labs, BIOPAC is releasing a new teaching platform, called BSL Home, that brings the lab experience directly to your students. With BSL Home students can learn physiology by recording from their own body and can run the hands-on lessons from their own home, in the dorm, at the library, wherever. The objective of Biopac Student Lab is to learn-by-doing and we’re here to help you navigate this new normal. To find out more about our distance learning solutions and regional events for the Biopac Student Lab community, please contact your local sales representative.

How are you navigating this new normal? 

To start the conversation, use the comment box to share your school’s strategy for saving the practical lab this fall. 


Top Signals for Life Science Instruction

Experience has shown that beginning physiology students are more engaged when acquiring and viewing signals from their own (or a lab partner’s) bodies in real time, particularly signals that are noninvasive to capture and easy to acquire. Watching a waveform trace across the screen and respond immediately to physical input is a sure-fire way to spark wonder and curiosity in a student. The following is a list (in no particular order) of the most common signals gathered in a beginning lab environment using the Biopac Student Lab System.

Electromyogram (EMG)

EMG is probably the top signal as far as simplicity, as the EMG signal can be consciously and directly controlled by the student, whether it be by simply making a fist to contract the forearm muscle or squeezing a hand dynamometer to measure grip strength. In addition to a raw EMG signal, a second channel showing integrated EMG can be simultaneously displayed. (Biopac Student Lab Lesson 1 and Lesson 2.)

Electroencephalogram (EEG)

EEG is another easy-to-acquire signal. Although not consciously controllable as EMG, the student can observe differences in the four simple periodic rhythms present in brain activity (alpha = 8-13 Hz, beta = 13-30 Hz, delta = 1-5 Hz, and theta = 4-8 Hz) while engaged in activities such as opening/closing eyes, solving simple mental math problems, or hyperventilating. (Biopac Student Lab Lesson 3 and Lesson 4.)

Electrocardiogram (ECG)

The ECG represents electrical events of the cardiac cycle whereas Ventricular Systole and Ventricular Diastole represent mechanical events (contraction and relaxation of cardiac muscle, passive opening and closing of intracardiac valves, etc.). Because the ECG reflects electrical activity, it is a useful “picture” of heart activity and presents several interesting components under various conditions, such as while sitting, standing, lying down, and after deep breathing or exercise. Various lead configurations highlight observable differences in the QRS complex which become apparent in analysis. (Biopac Student Lab Lessons 5, 6, and 7.)

Respiration (RSP) cycle and pulmonary function

As easy as breathing, measuring RSP signals under a variety of circumstances is another common study. Using a respiratory transducer (SS5LB) and an airflow transducer (SS11LB), we can record and analyze chest expansion and contraction during the breathing cycle, as well as pulmonary volumes/capacities and the effects of aerobic exercise. (Biopac Student Lab Lessons 8, 12, 13, and 15.)

Electrooculogram (EOG)

Large and small movements of the eye can be tracked and studied under various conditions by attaching simple adhesive electrodes to the forehead and temples in conjunction with the same SS2L electrode lead set used for recording EMG and ECG signals. (Biopac Student Lab Lesson 10.)

Reaction Time

Possibly the most fun signal to record. The participant holds a hand switch (SS10L) and pushes the button when an aural (click sound) or visual (light flash) stimulus is presented. The reaction time interval between the presentation of the stimulus and the participant’s voluntary reaction (button push) are recorded and analyzed. A variety of stimuli are presented, such as reaction to a fixed stimulus (e.g., every four seconds) opposed to a random stimulus (one to 10 seconds). Reactions are recorded holding the hand switch alternately in both the right and the left hand. It’s interesting to compare the difference in reaction time elicited from the dominant vs. non-dominant hand in response to the aural or visual stimulus. (BSL Lessons 11 and 11A.)

Other signals and studies commonly acquired in Biopac Student Lab are:

We also invite you to watch a free on-demand webinar detailing Biopac Student Lab Lessons.


BIOPAC offers a wide array of wired and wireless equipment that can be used in your research. To find more information on solutions for recording and analyzing signals such as ECG, heart rate, respiration and more using any platforms mentioned in this blog post, you can visit the individual application pages on the BIOPAC website.

Photo by JESHOOTS.COM on Unsplash


T4 Conference Wrap-up

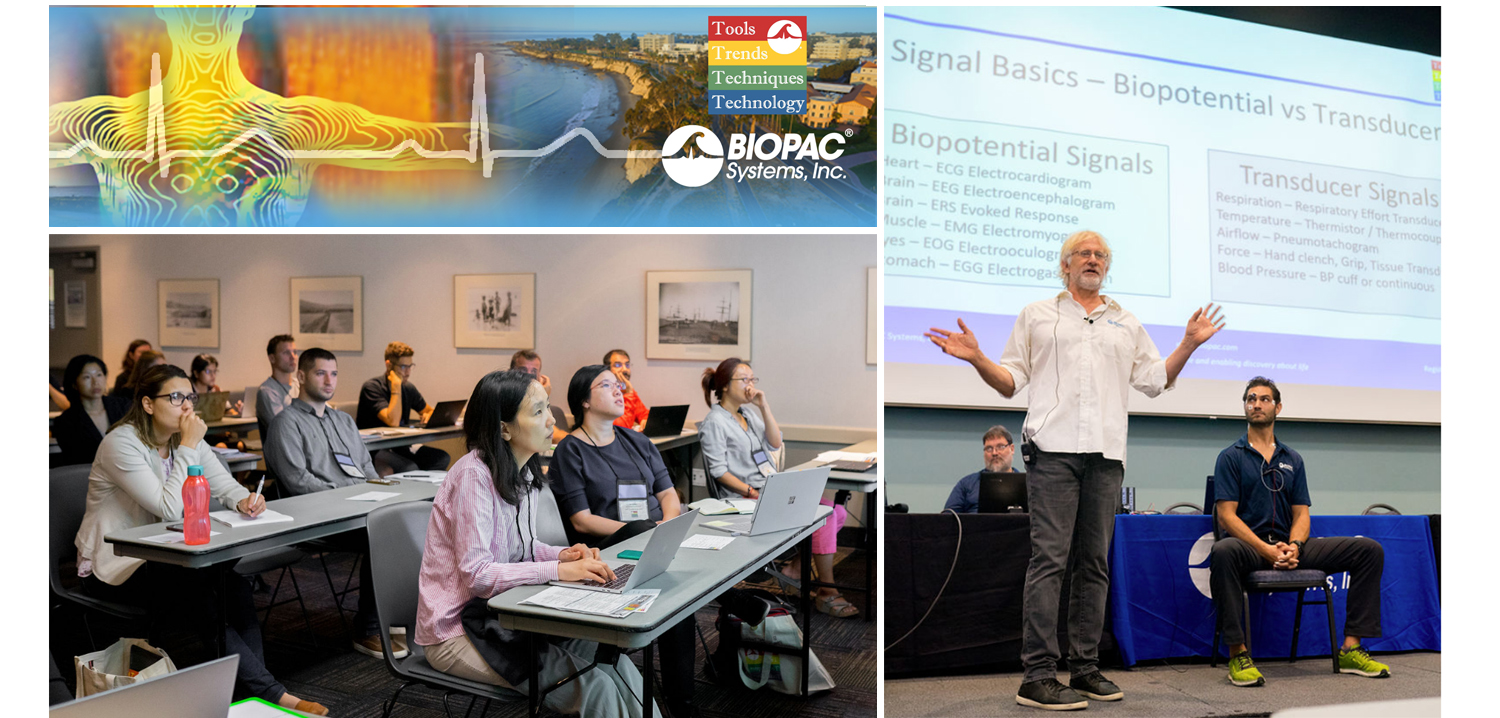
August is a month of barbecues, baseball, and last-minute vacations against the backdrop of a fading summer, and the eighth month of 2019 proved to be an equally exciting time at BIOPAC, with something of a pleasant vacation thrown in. On August 12-14, BIOPAC hosted its 2nd Biennial “Tools, Trends, Techniques, and Technology” Human Physiology Conference, known as “T4” to our friends and partners around the world. This three-day event, first held in 2017, featured lively, informative sessions hosted by BIOPAC staff, partners, noted academics, and industry experts, and covered a wide range of physiological techniques and disciplines. Over 150 attendees joined BIOPAC at the 2019 T4 Conference staged once again at the beautiful University of California at Santa Barbara campus. Participants and instructors winged in from China, Australia, Germany, Sweden, Italy, Spain, U.K., Ireland, and Egypt, as well as from wide regions of the U.S and Canada to soak up the idyllic surroundings of this ocean-side campus.

The focus of BIOPAC’s T4 Conference was to provide a fun, relaxed environment while hosting nearly 40 hands-on, human physiology training workshops chaired by over 20 distinguished instructors from around the globe. One of the many conference highlights was the “Mindfulness, Meditation, and Measurement: Mindfulness Exercises in Physiological Monitoring” session, hosted by Dr. Allan Weiss of the University of Southern California and  BIOPAC Co-founder and Director of R & D Alan Macy. These sessions, conducted in two parts over a two day period were booked beyond capacity, even though the early morning fog hadn’t yet lifted from the campus skyline.

The varied additional sessions covered a range from the basics, “Setting Up Your Lab, Getting Great Data and Troubleshooting,” (hosted by Dr. Terry Blumenthal of Wake Forest University, and BIOPAC’s Alan Macy and Tim Cook), and “Creating Your Own Lessons Using BSL PRO,” (hosted by Dr. Taffeta Elliot of the New Mexico Institute of Mining and Technology), to exciting new technologies such as “Integrating Screen-based Eye Trackers with AcqKnowledge,” with Keith Jackson of BIOPAC partner company EyeTech, BIOPAC CEO Frazer Findlay, and BIOPAC Engineering Manager Ed Peterlin. Additional wide-ranging physiological disciplines were also covered, including MRI techniques, stimulation, and exercise physiology. All sessions were conducted using BIOPAC hardware and software systems, as well as platforms provided by BIOPAC partners such as Cedrus, fNIR, WorldViz, Psychology Software Tools, and CNSystems. At the end of each day, it was time to relax and unwind with a beverage of choice, a a walk along the beach, and some good conversation. Each evening featured excellent meals and camaraderie in the relaxed yet elegant environment of some of Santa Barbara and Goleta’s most stunning surroundings. After three great days of immersive sessions, it came time for everyone to part ways, having forged new collaborative partnerships and an enhanced knowledge about the full potential of BIOPAC and BIOPAC partner products.

You don’t have to wait for T4 2021 to learn more about life science data—watch Fundamentals of Physiological Data Recording now!

For a closer look at T4, and a preview of what is sure to be an exciting 2021 event, we invite you to visit our T4 Human Physiology Conference page.

Looking for additional resources, tips, tricks, and expert advice on BIOPAC and BIOPAC Partner products? Please also visit our Webinars and Video Tutorial pages.


BIOPAC offers a wide array of wired and wireless equipment that can be used in your research. To find more information on solutions for recording and analyzing signals such as ECG, heart rate, respiration and more using any platforms mentioned in this blog post, you can visit the individual application pages on the BIOPAC website.

ECG – The Little Wave You Can’t Live Without

For millennia, ancient healers across the globe long recognized the human heart as immeasurably vital to human life. Other organs may take an occasional time out, but not the heart. This sinewy fist-sized pump contracts and relaxes an average 60 to 80 beats per minute and faithfully repeats this cycle some two and a half billion times over an average human lifespan, constantly driving and recirculating lifeblood through 100,000 miles of veins, arteries, and capillaries. It’s a monumental task that we take for granted, but if the process stops for more than a few minutes, so will this mysterious force we call life.

It’s intriguing to consider the wonder with which the ancients must have contemplated this organ that thumps so audibly. They knew it was of critical importance, and over the centuries learned its form and surface physiology, but what did they imagine animated it? What force kept the heart moving so steadily and faithfully, while remaining implacably divorced from the consciousness of its host? (Go ahead. Try to stop your heart. On second thought, don’t.)

The answer, in a word, is electricity. Although the stethoscope, invented in 1816 by French physician René Laennec, augmented audible heart sounds, it wasn’t until 1901 that Dutch physician Willem Einthoven developed a “string galvanometer,” capable of reliably recording the heart’s electrical activity. Einthoven’s work established a standard configuration for recording the electrocardiogram (ECG) and garnered him the Nobel Prize in 1924. Because the ECG reflects electrical activity, it is a useful “picture” of heart normality or abnormality through the observation and analysis of various distinct components of the cardiac cycle. If there are interruptions of the electrical signal generation or transmission, the ECG changes. These changes can be useful in diagnosing changes within the heart.

The methods for recording ECG have become increasingly sophisticated with the advent of digital technology and have put state-of-the art acquisition and analysis of ECG within reach of not only clinicians, but also researchers and educators. Wired in-lab systems such as the BIOPAC MP160 System with AcqKnowledge software are widely used for Research applications, while the MP36 System with Biopac Student Lab software are the industry standard for physiology education around the globe. Wireless systems such as BioNomadix or BioNomadix Smart Center can be used to collect ECG and other body signals in an untethered environment and the BioNomadix Logger is a great solution for acquiring ECG and other body signals over extended periods outside the lab.

We have come a long way since our forebears contemplated the mysteries of the vital mechanical wonder that beats in every chest, and we now have a myriad of accessible options for unlocking its secrets.

For further exploration of ECG, we invite you to enjoy the following comprehensive free ECG webinars:

Recording Great ECG

HRV & RSA – Fundamental ECG Analysis Techniques

BIOPAC offers a wide array of wired and wireless equipment that can be used in your research. To find more information on solutions for recording and analyzing signals such as ECG, heart rate, respiration and more using any platforms mentioned in this blog post, you can visit the individual application pages on the BIOPAC website.


The Face of Facial Expression Analysis

Say you’re in a situation where it behooves you to keep a poker face. At an auto dealership negotiating a price on the new car of your dreams, or sitting across from your boss trying to make a case for a promotion. Your heart is pounding, sweat is forming in the crevasses of your palms, yet you need to keep yourself in check and not betray your excitement or apprehension. How skilled are we at masking emotions really? Emotions affect everyone in daily life, and play a key role in non-verbal communication. They are essential to understanding human behavior. A growing area of research is geared toward classifying and analyzing human emotions for a variety of studies, and methods for acquiring this data have become increasingly reliable and sophisticated. How do these studies work, and how is something as amorphous as the smallest twitch of a facial expression accurately recorded?

Facial “emotion reading” software such as FaceReader can detect minute variations in facial expressions by analyzing key points on the face (over 500) and has been “trained” with more than 10,000 manually annotated images to enhance facial modeling accuracy. Using this vast classification library, the input is distilled into six basic or universal emotions, (happy, sad, angry, surprised, scared, disgusted, or neutral.) Facial expression data is non-invasively gathered in real-time via a still or video camera, so no electrodes or leads are necessary.

But these refinements are more than skin deep. Additional tools for further quantifying facial expression data are commonly available. “Action Units” is the term used to describe individual or group facial muscle activity. The FaceReader Action Units add-on module allows automatic analysis of a selection of 20 common Action Units (such as raising of cheeks, wrinkling of nose, dimpling, and lip tightening) to measure affective attitudes (such as interest, boredom, and confusion).

Facial expressions can be visualized as bar graphs, in a pie chart, and as a continuous signal. Using FaceReader integrated with AcqKnowledge software and the MP160 System extends the functionality. Not only is the data automatically synchronized with other signals (ECG, fEMG, EDA, etc.,) but the recorded facial video can be monitored in the FaceReader display for real-time feedback.

Perhaps with a bit of practice, you can pull off that promotion and be able to afford that new car without tipping your hand!

For more information about FaceReader Software, watch the free On-Demand Webinar, “Using Facial Expressions to Understand Behavior” with BIOPAC CEO Frazer Findlay.


BIOPAC offers a wide array of wired and wireless equipment that can be used in your research. To find more information on solutions for recording and analyzing signals such as ECG, heart rate, respiration and more using any platforms mentioned in this blog post, you can visit the individual application pages on the BIOPAC website.

Start the First Class with EDA and Emotional Responses!

By Howard Iver Thorsheim, Ph.D., St. Olaf College. I wanted to start the first day of my class with an activity that would engage students’ curiosity and enthusiasm, to set the stage for introducing the course and going over the syllabus!

By Howard Iver Thorsheim, Ph.D., St. Olaf College

Howard Iver Thorsheim is Professor of Psychology and Neuroscience at St. Olaf College, Northfield, Minnesota, USA. In these blogs he offers his first-person insights into effective teaching techniques gleaned from a combination of scholarly research and over 40 years in the classroom.

I find Electrodermal Activity (EDA) to be a great way to demonstrate psychophysiology measurement at the beginning of a course: students easily understand it. It takes little time to set up and record because it only involves two sensors on the finger tip pads. It works every time as a “window” to emotions with clear responses to a variety of stimuli (e.g., visual, auditory, gustatory, olfactory).

I show students a picture of a rock climber climbing a cliff, then ask them to jot down some notes of what they might feel when climbing like the woman pictured, and then buzz with a person sitting next to them about what they wrote. I ask for a show of hands of who has mentioned the bag hanging from the climber’s belt. Depending on the amount of time I choose to devote to the activity, I lead the entire class through a number of probing questions; for example:

“Who knows what the bag is for?” (Chalk for fingers.)

“Why does the climber use chalk?”  (Reduce slipperiness from sweat.)

“Why do fingers get slippery?” (Emotion.)

“What other people encounter emotion daily?”

I then set the stage for EDA: changes in skin conductivity are due to the amount of sweat in sweat glands of the skin, which are produced by the sympathetic branch of the autonomic nervous system responding to emotion.

I explain to the class that I will be the first volunteer, and guarantee that no shock is involved using BIOPAC equipment. I connect electrodes on the volar pads of my index and middle fingers, and take a deep breath, which will generate EDA. Then I tell the class I will think of emotion-producing situations, and ask them if they can see any EDA detected by the equipment. There will be a few good chuckles because in anticipation of doing so, my response will already appear. Two of several easy classroom measurements of EDA include latency (about 1 to 3 seconds between a stimulus and beginning of the electrodermal response), and peak amplitude (the maximum size of the response). My eBook Doing Psychophysiology–Getting Started on the Apple iBooks Store has a graphic narrative and a one-minute video explanations about EDA, as well as other psychophysiology measures you can show your students. The Biopac Student Lab system also includes two lessons in which students can engage in interactive learning activities while measuring EDA; a lesson on the principles of biofeedback and one on the standard physiological measures of a polygraph.

An excellent summary of Electrodermal Activity is provided in the following chapter:

Dawson, M. E., Schell, A. M. & Fillion, D. L. (2007). The electrodermal system. In J. T. Cacioppo, L. G. Tassinary, & G. G. Berntson (Eds.). Handbook of psychophysiology (3rd ed. pp. 159-181). New York: Cambridge University Press.

Learn more about BIOPAC’s education solutions, including complete teaching systems for psychophysiology and the life sciences. BIOPAC also provides a wide range of research systems for recording, displaying, classifying, and analyzing psychophysiological measurements.

BIOPAC Systems, Inc. provides life science researchers and educators with data acquisition and analysis systems that inspire people and enable greater discovery about life. Visit us at www.biopac.com.

Professor Thorsheim is a licensed Psychologist, educator, and author. He has published or presented over 125 papers, journal articles, books, book chapters or monographs, and received a patent in 1985 as a co-inventor for an educational book design with interactive elements. His work has been funded by marquee foundations across the globe. His most recent work is Doing Psychophysiology: Getting Started, available from Knowledge Growers, Inc., available as an iBook download in 51 countries.

 

Forming Cooperative Learning Groups: The Solution

By Howard Iver Thorsheim, Ph.D., St. Olaf College. Students think psychophysiology is cool…. It generates all kinds of buzz, interest, excitement, questions–even from other faculty and administrators–and psychophysiology appeals to many students in related disciplines,

(Photo © 2016 Knowledge Growers, Inc.)

By Howard Iver Thorsheim, Ph.D., St. Olaf College

Howard Iver Thorsheim is Professor of Psychology and Neuroscience at St. Olaf College, Northfield, Minnesota, USA. In these blogs he offers his first-person insights into effective teaching techniques gleaned from a combination of scholarly research and over 40 years in the classroom.

Extensive research* documents the validity and benefits of constructivist learning and peer mentoring. The challenge is how to introduce students to psychophysiology so that they have the opportunity to be engaged.

Psychophysiology is inherently engaging to students because it links with most course topics, as well as whatever are their interests. “Students think psychophysiology is cool…It generates all kinds of buzz, interest, excitement, questions—even from other faculty and administrators–and psychophysiology appeals to many students in related disciplines, creating opportunities for cross-disciplinary collaboration among faculty and student.” (Thorsheim, LaCost & Narum, 2010, p. 27-28).

In what I call The Appetizer Process, the assignment for the next class meeting is for students to search the Internet on a combination of three topics: (1) Their interests (whatever they have a passion for), (2) The word “Psychophysiology,” and (3) The topic for the day in the course I am teaching.

They are to see what pops up, look for a link that strikes them as intriguing, click on it, and print out one first page from that link to bring to the next class meeting. I tell them they will be asked to share what they have found and why it’s intriguing to them, and turn the sheet in so I can learn more about their interests.

Next class, I ask students to form pairs, and tell their partner what their sheet is about and something about why it interests them. While pairs are talking, I identify two or three pairs that seem to be particularly engaged in conversation and ask them if they would be willing to share about 15 seconds worth of what they talked about when we regroup.

I tell the large group that the reason for asking the pairs to share what they talked about is to demonstrate the richly diverse connections that people construct.

I remind the class to make sure their names are on their sheets when they turn them in so I can connect them and their interests. (Another option is to compile all the names and links to share back to the class).

Whatever the plan is for the rest of class, after pairs share and hear from the two or three pairs, I find students are engaged because they have actively constructed connections with their interests, psychophysiology, and the topic for the day.

*Galindo, J. H. (2011). Authentic learning (Simulations, Lab, Field). Download it here.

Mayo, J. A. (2010). Constructing undergraduate psychology curricula: Promoting authentic learning and assessment in the teaching of psychology. Washington, DC: American Psychological Association.

Thorsheim, H., LaCost, H., & Narum, J. L. (2010). Peer mentoring of undergraduate research in community colleges: A “transplantable” model for workshops. Council on Undergraduate Research Quarterly, 31(2), 26-32. View it here.

Learn more about BIOPAC’s education solutions, including complete teaching systems for psychophysiology and the life sciences. BIOPAC also provides a wide range of research systems for recording, displaying, classifying, and analyzing psychophysiological measurements.

BIOPAC Systems, Inc. provides life science researchers and educators with data acquisition and analysis systems that inspire people and enable greater discovery about life. Visit us at www.biopac.com.

Professor Thorsheim is a licensed Psychologist, educator, and author. He has published or presented over 125 papers, journal articles, books, book chapters or monographs, and received a patent in 1985 as a co-inventor for an educational book design with interactive elements. His work has been funded by marquee foundations across the globe. His most recent work is Doing Psychophysiology: Getting Started, available from Knowledge Growers, Inc., available as an iBook download in 51 countries.

Forming Cooperative Learning Groups: The Challenge

By Howard Iver Thorsheim, Ph.D., St. Olaf College. Extensive research has repeatedly validated the value of cooperative learning. Yet, attempts to form cooperative learning groups too often failed to meet the expectations of both educators and students.

Photo © 2016 Knowledge Growers, Inc.

By Howard Iver Thorsheim, Ph.D., St. Olaf College

Howard Iver Thorsheim is Professor of Psychology and Neuroscience at St. Olaf College, Northfield, Minnesota, USA. In these blogs he offers his first-person insights into effective teaching techniques gleaned from a combination of scholarly research and over 40 years in the classroom.

Extensive research* has repeatedly validated the value of cooperative learning, and many educators desire to incorporate cooperative learning into their classrooms. Yet, my attempts to form cooperative learning groups too often failed to meet the expectations of both me and my students.

It took me many tries before I developed a simple process, which was stimulated by a question from a student. The process is an effective way to form cooperative learning groups for students to work together in doing psychophysiology (that’s a favorite name I use to describe teaching and learning psychophysiology in class and lab). The process is one that I have refined and used successfully ever since.

Psychophysiology content, research methods, and learning to use technology for measurement are my goals, as well as helping students learn take-away “soft” skills that will be useful to them in any setting, like how to work cooperatively with others.

But before they could cooperate, I needed to have students get into groups. My first tries to form groups disappointed me: I tried using the class list, taking the first three people in the list to make a group, and then the next three people and made them a group, and so on.

Another time I randomly picked groups of three and assigned them to groups.

Yet another time I thought that providing choice in choosing teammates would be a good reason for success, and asked students to form their own groups of three.

None of these methods generated the kind of “special spark” I was looking for.

I was about to decide that it did not make any difference how groups were formed, and that besides, forming groups just made for more work for them and for me. Then, I decided to ask my next semester students if they had any ideas about forming cooperative groups.

In Part 2 of this blog, I’ll share what I learned and how it worked.

* Johnson, D. W., Johnson, R. T.,  & Smith, K. A. (2014). Cooperative learning: Improving university instruction by basing practice on validated theory. Journal on Excellence in College Teaching, 25(3-4), 85-118. (Find an abstract of their article here). A quick way to get to that information is to download a copy of a 2013 draft version of the 2014 Johnson, Johnson & Smith article, available here.

Learn more about BIOPAC’s education solutions, including complete teaching systems for psychophysiology and the life sciences. BIOPAC also provides a wide range of research systems for recording, displaying, classifying, and analyzing psychophysiological measurements.

BIOPAC Systems, Inc. provides life science researchers and educators with data acquisition and analysis systems that inspire people and enable greater discovery about life. Visit us at www.biopac.com.

Professor Thorsheim is a licensed Psychologist, educator, and author. He has published or presented over 125 papers, journal articles, books, book chapters or monographs, and received a patent in 1985 as a co-inventor for an educational book design with interactive elements. His work has been funded by marquee foundations across the globe. His most recent work is Doing Psychophysiology: Getting Started, available from Knowledge Growers, Inc., available as an iBook download in 51 countries.
.

Impedance Cardiography

By Alan Macy, BIOPAC Systems, Inc.

ICG is a measurement method that is primarily used to determine aspects of Cardiac Output (CO).   CO is the total amount of blood, pumped from both the left and right ventricles of the heart for each of its successive systolic phases, over the course of one minute.  The systolic phase, or systole, is when the heart muscle contracts and pumps blood from the chambers (left and right ventricles) into the arteries.  Typical resting cardiac output is 4.9 liters/minute for an adult human female and 5.6 liters/min for an adult human male.

Left ventricular cardiac output is the CO from the left ventricle only and can be estimated via a non-invasive technique called Impedance Cardiography (ICG), which provides an approximation of Stroke Volume (SV).  If SV and Heart Rate (HR) are known, then CO can be determined by:


SV * HR = Cardiac Output


ICG is measured by introducing a constant current (I) through the thoracic volume and then measuring the resulting voltage (V).   The following equation is used to determine thoracic impedance (Z).

 Z = V/I

 Where V and I are the root mean square (rms) values of the measured voltage and supplied (known) current.  ICG systems induce a constant magnitude, alternating current (I) through the thorax via electrodes.  A separate set of electrodes (placed between the current electrodes) monitor the voltage (V) developed across the thorax.  Because the magnitude of I is constant, V will vary in direct proportion to Z.


The applied current (I) flows through the volume of the thorax, which includes skin, skeletal muscle, the lungs, the heart and blood.  Because blood is a conductor, the changes in blood volume during a cardiac cycle produce a measurable change in thoracic impedance.  Researchers have developed equations for estimating left ventricular SV based on thoracic impedance, with the most widely used equation being that developed by Kubicek, et al. (1966):

 SV = rho x (L/Zo)² x LVET x (dZ/dt Max)

 Where:

 SV = Stroke volume (ml)

rho = Resistivity of blood (Ohms·cm) which is assumed to be a constant 135 Ohms·cm (Quail, Traugott, Porges, & White, 1981).

L = Length or distance between inner band (voltage monitoring) electrodes (cm)

Zo = Basal Thoracic Impedance (Ohms)

LVET = Left Ventricular Ejection Time (seconds)

dZ/dt Max = Absolute value of the cyclic peak of the derivative of Zo (Ohms/sec)

LVET varies inversely with heart rate under a broad range of circumstances.  LVET should not be treated as a constant in the Kubicek equation.  Unlike Length (L), which is constant during a session, Thoracic Impedance (Zo) also varies some, although not as much as LVET.   Blood resistivity (rho) also may vary with changes in hematocrit levels and red blood cell orientation, but that variation has largely been ignored because of the difficulties associated with having to draw blood to measure rho.

Impedance Cardiography (ICG) is an indirect measurement of Stroke Volume (SV).  Studies have been performed to correlate ICG to SV, using thermodilution as reference and have found that accuracy improves when variables such as age, height, sex, waist circumference and weight are factored into the SV estimation.  Accordingly, ICG measures are best interpreted as a relative, versus absolute, indication of SV.  Even so, as a relative measure, ICG can provide a clear indication of important physiological processes associated with homeostasis and hemodynamic changes.

Research in psychophysiology, and other areas of physiology, focuses on the left ventricle because it pumps blood that supplies the metabolic requirements of striated (skeletal and cardiac) musculature and thus fundamentally supports behavior and exercise.  For Impedance Cardiography (ICG), the left ventricle is principally important because the dZ/dt signal primarily indicates left ventricular blood ejection into the aorta.  There is very little influence from right ventricular blood ejection in the ICG signal.

For more information on BIOPAC’s ECG solutions, visit BIOPAC’s ECG-Cardiology page or view BIOPAC’s full line of electrodes, amplifiers, and wearable, wireless transmitters and loggers.

For more information on BIOPAC Systems, visit us at www.biopac.com.

Five Steps to a Better Physiology Lab – Preparation

Integrating new hardware and software into the Physiology lab curriculum…key points from instructors who have created successful labs that will greatly increase the chances of a rewarding lab experience for both students and instructor.

by William McMullen, BIOPAC Systems, Inc.

Integrating new hardware and software into the Physiology lab curriculum can be intimidating. Despite the best of early-summer intentions, in fall Instructors often find themselves apprehensively staring at a box full of unfamiliar equipment a few short days before the first lab. Luckily, the Biopac Student Lab excels in this situation, as it is easy to use and includes all materials necessary for students to prepare, record and analyze their data. This means that, in a crunch, if all one did was install the software and verify the hardware connections, most students should obtain meaningful data. Beyond the default setup, there are multiple customization options as described in the user support documentation. There are, however, some key points we have learned from instructors who have created successful labs that will greatly increase the chances of a rewarding lab experience for both students and instructor.

1. Organize the lab such that each student participates equally and each obtains recorded data from their bodies.
Students are more motivated when working with their own data. The Biopac Student Lab requires a minimum of three students for most lessons; a Recorder, a Director and a Subject. At the end of each lesson recordings, the students should rotate through these rolls and rerun the lesson until each student has recorded their own data. In order to provide enough recording time in a standard 2 hour lab period, the number of students per lab station should be four to five.

2. Setup basic Lesson Preferences before the first lab to minimize confusion.
Run each lesson* that will be used and setup the following:

  • If using lessons L02, L07-L09 or L12-L17, different models of transducers may be used. Check that the image and transducer descriptions in the lesson guide match the hardware used. If changes are needed, choose File > Lesson Preferences and select the desired transducer.
  • Disable undesired recording tasks by choosing File > Lesson Preferences > Lessons Recordings. If none of the recording tasks are desired (if using a custom procedure), disable all and only generic information will be displayed in the lesson guide.

*Note: If using the optional Curriculum Management System (available in BSL 4.1), only changes to the Host computer are required and all other computer/lab stations will be automatically updated. If not using this option, the changes must be made to each computer.

3. For Lessons L12 and L13 (Pulmonary Function), greatly reduce calibration time by matching the hardware with the software.
Label the lab station computer, the MP device and the Airflow Transducer (SS11LA/L) and make sure they are always matched. Run lesson 12 and check File > Preferences > Calibration Syringe Size to make sure it matches the syringe that will be used. Choose File > Preferences > Calibration Syringe Values and then select “Set once and use stored values”. Carefully run through the calibration using the syringe. From then on, when the students run the lesson, they will only need to calibrate for zero baseline (no syringe) which is easy and only takes a few seconds.

4. Students should have a basic understanding of the software before the first lab.
All Biopac Student Lab lessons use the same basic software tools and if students have a basic understanding of these tools in advance, they will experience greater success obtaining good data and having a positive lab experience. Students should be instructed to download the free Biopac Analysis software onto their personal computers.

This software not only provides the ability to analyze the data recorded in the lab but also allows students to prepare for a lab by studying the included tutorial videos and sample data. Some instructors give a test prior to the first lab to make sure students reviewed the BSL Tutorial Video.

5. Demonstrate proper electrode preparation and explain ways to minimize motion artifact. 
For lessons that use electrodes, good electrode contact and minimal EMG/motion artifact are keys to obtaining good data. Although this is explained in the procedures, it cannot be emphasized enough. Demonstrate the cleaning of the skin (with soap or alcohol) to remove dirt and oil and the abrading around the electrode site to remove the dead epidermal layers that impede electrical flow. Always place a drop of electrode gel on the electrode and wait at least 5 minutes after electrode placement before beginning a recording. To minimize EMG artifact, the student should be as relaxed and motionless as possible (unless procedure calls for movement). Talking, blinking (during EEG or EOG recording), laughing or deep breathing will add unwanted EMG artifact to the data.

These easily implemented steps will greatly assist students in obtaining good data from the very first lesson, leading to a positive lab experience and ultimately gaining a better understanding of Physiology.


BIOPAC Systems, Inc. provides life science researchers and educators with data acquisition and analysis systems that inspire people and enable greater discovery about life. BIOPAC lets you measure physiology anywhere, with innovative, compatible wireless, wearable solutions that can be used by anyone for meaningful discovery. We make high-quality scientific tools for physiology measurement and interpretation with superior compatibility and world-class customer service and support. Visit us at www.biopac.com.

error: Content is protected !!




